
Experiments with Lazy Evaluation of Classification Decision Trees Made
with Genetic Programming
Sa
ˇ
so Karakati
ˇ
c, Marjan Heri
ˇ
cko and Vili Podgorelec
Institute of Informatics FERI, University of Maribor, Smetanova 17, 2000, Maribor, Slovenia
Keywords:
Classification, Machine Learning, Genetic Programming, Lazy Evaluation, Dynamic Weighting.
Abstract:
In this paper, we present a lazy evaluation approach of classification decision trees with genetic programming.
We describe and experiment with the lazy evaluation that does not evaluate the whole population but evaluates
only the individuals that are chosen to participate in the tournament selection method. Further on, we used
dynamic weights for the classification instances, that are linked to the chance of that instance getting picked
for the evaluation process. These weights change based on the misclassification rate of the instance. We test
our lazy evaluation approach on 10 standard classification benchmark datasets and show that not only lazy
evaluation approach uses less time to evolve the good solution, but can even produce better solution due to
changing instance weights and thus preventing the overfitting of the solutions.
1 INTRODUCTION
Genetic algorithm (GA) is a metaheuristic process
which uses the theory of evolution to generate the
final solution to a problem with the gradual evolu-
tion of solutions inspired by natural selection process
observed in nature. The basic evolution loop of all
variations of GA is the following. The loop starts
with the evaluation process of the solutions in the
whole population, then continues with the selection
process of evaluated solutions. Next, the mating pro-
cess (crossover) between various solutions generates
new offspring solutions, and then other evolutionary
operators can be applied (such as mutation and elite
selection) (Espejo et al., 2010). The whole process
of the genetic algorithm is computationally intensive,
and every speed up of the evolution without sacrific-
ing the quality of the final solution is welcomed.
The processing time of every genetic operator dur-
ing the evolution process is dependent on the type of
problem we are solving. In this paper, we focus on
classification problem, which is one of the supervised
methods of machine learning field.
One way to solve classification problem with GA
is by using genetic programming (GP), which is a
variation of GA where solutions are programs rep-
resented in a hierarchical decision tree structure (Es-
pejo et al., 2010). The classical techniques of building
these decision trees used in the industry and academia
are CART (Breiman et al., 1984), C4.5 (Quinlan,
2014), ID3 (Cheng et al., 1988) and ensembles of
these methods (Liaw et al., 2002) (Ganjisaffar et al.,
2011). With GP we can utilize the power of evolu-
tion to build these decision trees as has been used nu-
merous times before. In the evolutionary process of
construction classification decision trees, the compu-
tationally most intensive part is the evaluation of the
decision trees (Zhang and Cho, 1998).
In this paper, we propose a lazy evaluation of the
classification decision trees made with GP, where so-
lutions from the population are evaluated only when
needed and on the limited amount of classification
instances. We extend our previous work on this
field (Podgorelec and Zorman, 2015), (Podgorelec
et al., 2013), and add the dynamic evaluation pro-
cess – it can be expanded if the evaluation process
does not differentiate between the quality of differ-
ent solutions. The process of lazy dynamic evalua-
tion also changes the importance of classification in-
stances through the evolution, giving the more impor-
tance to the instances, that are more often misclassi-
fied and less importance to those that are more often
correctly classified.
Not much similar work has been done before, but
we definitely build on the ideas from the existing lit-
erature. The most notable impact to our work was
introduced by Gathercole and Ross (Gathercole and
Ross, 1994). In their paper, they proposed a dynamic
training subset selection for the supervised problem
(such as classification) where they proposed three dif-
KarakatiÄ S., HeriÄ ko M. and Podgorelec V.
Experiments with Lazy Evaluation of Classification Decision Trees Made with Genetic Programming.
DOI: 10.5220/0006515203480353
In Proceedings of the 9th International Joint Conference on Computational Intelligence (IJCCI 2017), pages 348-353
ISBN: 978-989-758-274-5
Copyright
c
2017 by SCITEPRESS – Science and Technology Publications, Lda. All rights reserved
ferent subset selection processes where they heuristi-
cally change the testing classification set in each gen-
eration. Our proposed method of lazy and dynamic
evaluation builds on their idea, where we weight in-
stances through the evolution, but we expand this with
the lazy evaluation, where an individual is tested only
when it is needed and only on it’s testing set. Zhang
and Cho introduced the idea that incrementally se-
lected testing subsets can reduce evaluation time with-
out sacrificing generalization accuracy of evolved so-
lutions (Zhang and Cho, 1998).
ˇ
Sprogar introduced
the idea, that even excluding the fitness of the genetic
solutions can improve the robustness of evolution pro-
cess (
ˇ
Sprogar, 2005). His proposal eliminates the op-
erator for evaluation and can also speed up the process
of evolution.
The rest of the paper is organized as follows. We
start with the section where we analyze the process-
ing time of genetic programming method for classifi-
cation purposes. Next is the section where we present
the idea of the lazy evaluation method and describe
it in detail. In the following section, we describe the
layout of the experiment and present the results of the
implemented method of lazy evaluation. We conclude
with the final remarks, the interpretation of the results
and present our plans for the future research.
2 PROCESSING TIME ANALYSIS
OF GP FOR CLASSIFICATION
Let us analyze the individual processing times of each
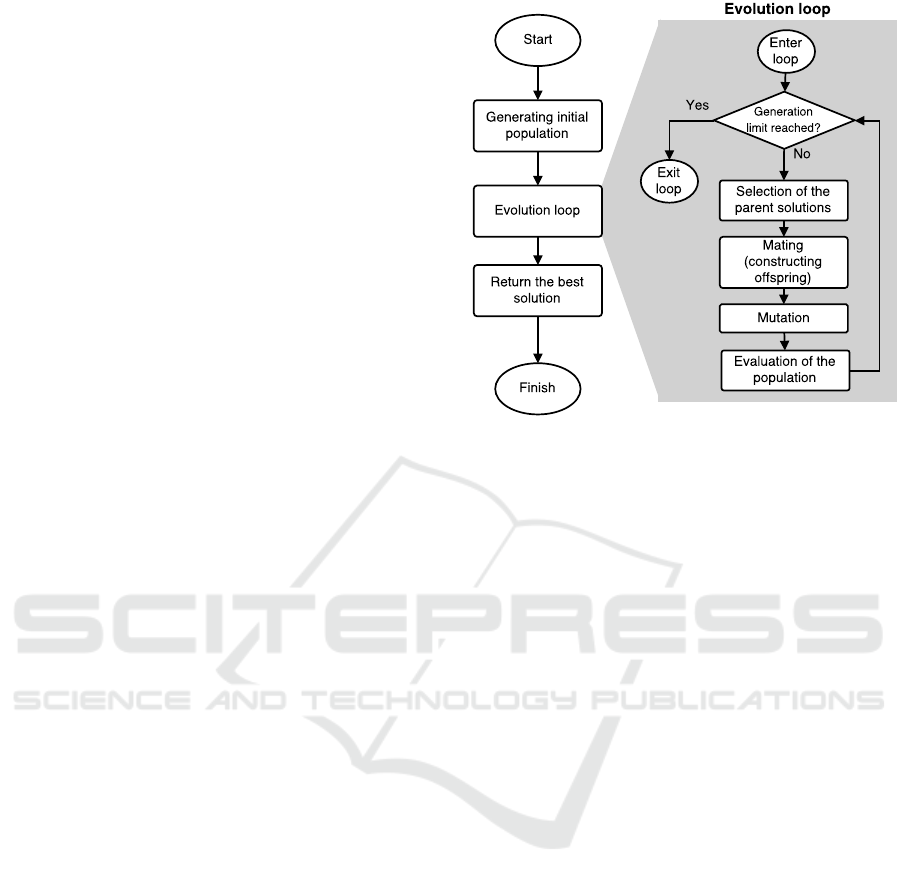
genetic operator in the GP process. Figure 1 shows
the standard evolutionary process in the GP, where the
evolution loop is highlighted with the gray rectangle.
As it is evident from the figure, most of the pro-
cessing time is spent in the evolution loop – the
amount of this time is mostly dependent on the stop-
ping criteria. If there is a dynamic stopping criterion,
such as an amount of stagnating generations (genera-
tions without improvement), the total processing time
varies from run to run and is mostly due to chance.
If we have fixed number of generations, then we can
approximate the processing time more precisely.
If we use the big Omicron (big O) notation, the ap-
proximation of processing time goes as it is presented
in the following. The big O notation is used to express
the upper bound of the processing time growth rate of
a process, or in other words, the time complexity of
an algorithm.
The evolution loop starts with the selection of the
individuals, that are chosen to go through the mating
process. There are many different selection methods,
but here we are only exploring the tournament selec-
Figure 1: Flowchart of genetic programming with the evo-
lution loop highlighted in the light gray background.
tion method. Tournament selection chooses k random
individuals from the populations and the best indi-
vidual (fitness wise) wins the tournament and is se-
lected to participate in the mating process. The order
of growth for one generation is O(mk), where m is
the number of parents chosen (usually the same as the
population size, when parents produce two offspring),
and k is the tournament size (usually between 2 to 10).
The mating process is heavily dependent on the
genotype representation. In GP we present one indi-
vidual in a form of a tree, or more specifically here
one individual is a classification decision tree. So nat-
urally, the processing time of the crossover process
is also dependent on the representation. In our im-
plementation, we set the chance of crossover happen-
ing to 100%. In the regular form GP (without heuris-
tic crossover) the crossover process chooses a random
node in the tree from the first parent, and the random
node from the second parent and exchanges the sub-
trees, creating one or two offspring. The choosing of
the nodes happens two times (two parent trees) and
the loop of node choosing runs from minimal of 1 to
maximum depth of the tree. The maximum depth of
the tree is again a heavily dependent, this time on the
classification problem – simpler classification prob-
lems permit shallower trees and more complex ones
demand bigger decision trees. So the order of growth
for the crossover process in one generation is O(2d)
(2 because of two parent trees), or simpler just O(d),
where d is the maximum depth of the tree.
After the crossover, the mutation process is next.
Here we must consider the chance of the mutation
happening. Standard chances vary from 1% and all
the way to 50%. The time complexity of mutation
operator is similar than in crossover. When the new
child is created and it is determined that it was cho-
sen by chance to go through the mutation, the node is
chosen in a random fashion and is replaced by a ran-
dom subtree or the node content (the decision rule)
is changed. The node picking itself has the order of
growth O(d) as does the creation of the random sub-
tree O(d) (if the maximum depth of the tree is set to
d). So the time complexity is O(2d), or simpler just
O(d), but keep in mind, that this doesn’t happen to
every new individual.
Now for the most time-consuming process in GP
loop – evaluation process. Here we take every in-
dividual and use every classification instance in the
training set to classify that instance. From these clas-
sification results, the classification metrics can be cal-
culated (accuracy, F-score, recall, precision, AUC,
and others), which are then part of the fitness of
that individual. The process of calculating the clas-
sification metrics is another time-consuming process.
The calculation of accuracy is straightforward by just
counting the correctly classified instances, but calcu-
lating the F-score is a more time-consuming process
(as we have to calculate recall and precision for every
class, and then calculate individual F-score for each
class and then aggregate it to get the final F-score).
Let’s assume we have n number of new offspring in-
dividuals, the maximum depth of each individual tree
is d, we have t number of training classification in-
stances that are to be classified by each tree, and that
we calculate only the accuracy for the fitness. The
time complexity of evaluation for every individual in
one generation is O(ndt).
If we combine the time complexities of individual
operators we get the following time complexity of an
evolution loop for one generation:
O(mk) + O(d) + O(d) + O(ndt)
m =number of parents from selection
k =tournament size
d =maximum depth of the tree
n =number of offspring individuals
t =number of classification instances
in the training set
It is evident, that all of the times are linear and
thus the total time should be mostly dependent on the
highest factor in the equation. We also ran the GP
and timed each genetic operator in the evolution loop
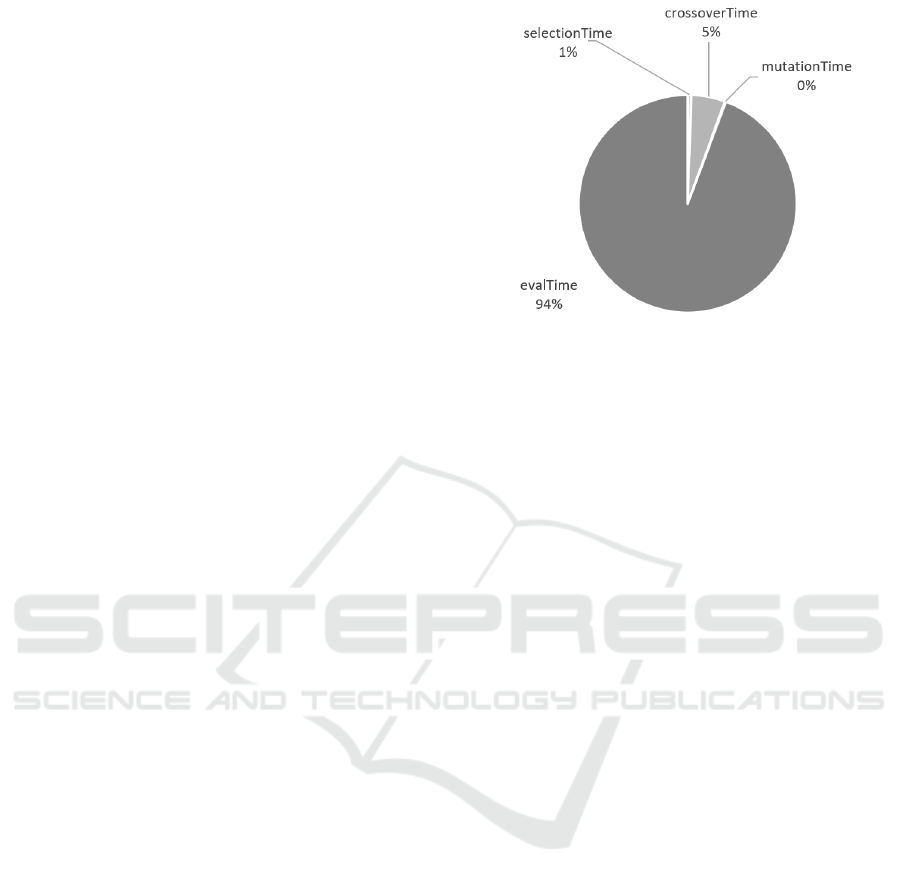
multiple times. In Figure 2 is the pie chart that shows
the proportions of each processing times in one gen-
eration on average of 100 independent runs.
Figure 2: Pie chart showing the average processing times
of genetic operators in one generation of GP for classifica-
tion decision tree construction. The experiment was made
on car dataset with 1382 instances in the training set, 150
solutions in the population, 2000 generations and 100 inde-
pendent runs of GP.
As is evident from the pie chart in Figure 2, 94%
of the total processing time in the evolution loop is
spent the evaluation process. Note that this cannot
be generalized to all GAs or even all GPs and is spe-
cific for GP construction classification decision trees.
Even using different data set (we used the car data set)
could produce slightly different results. Despite this,
we see that shortening evaluation time should signifi-
cantly impact the running time of the GP in general.
3 LAZY EVALUATION METHOD
As we found out in the previous section, the most
time-consuming process in evolution loop is the eval-
uation process, thus we propose an approach which
shortens this time.
In our proposed approach, which we named lazy
evaluation, we do not evaluate the whole population
on all of the classification instances. Instead, we eval-
uate only decision trees chosen to participate in the
tournament of the selection operator and only some
classification instances.
The Figure 3 shows two separated plots. On the
top is the probability of one decision tree from the
population to be chosen to be evaluated in one tour-
nament, dependent on the size of the tournament and
the population size. On the bottom, there is the num-
ber of evaluations (number of classification instances
X population size) in one generation dependent on
lazy evaluation tournament size (and standard GP)
and population size.
As it is evident from the Figures 3, the number
of evaluations per generation is drastically lower as
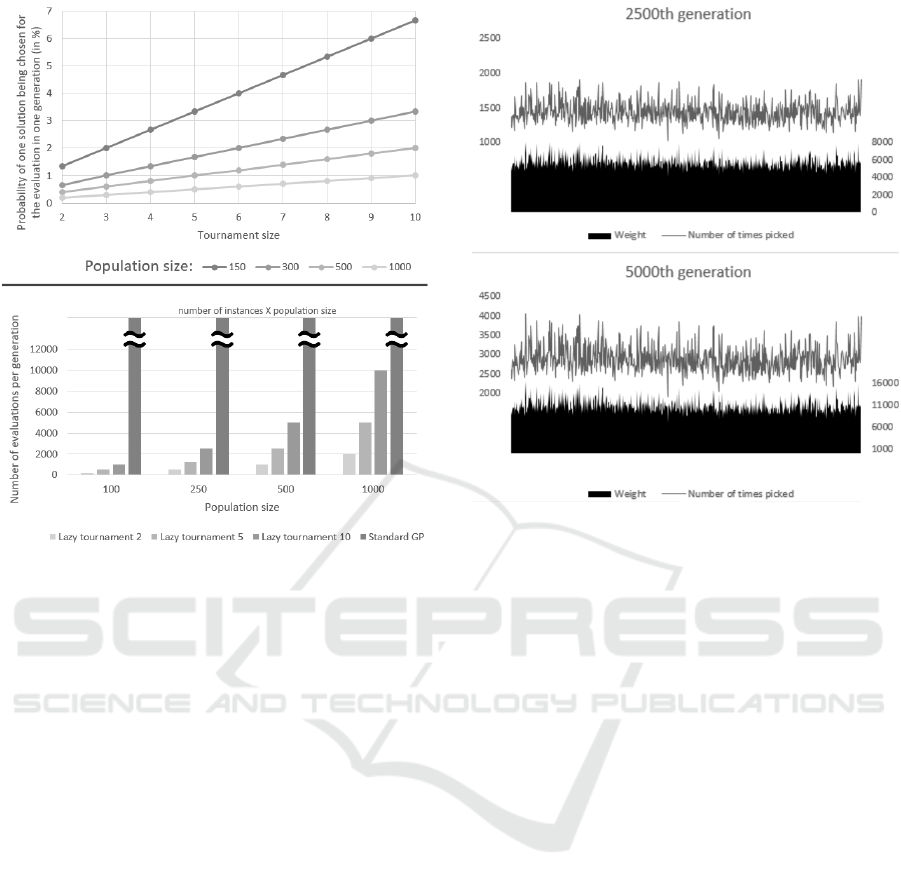
Figure 3: Exploring the number of evaluations.
Top: Line chart showing the probability of one decision tree
being chosen for the evaluation, dependent on the tourna-
ment size and the population size.
Bottom: Number of evaluations in generation dependent on
a number of classification instances and population size.
Standard GP denotes the standard GP without extensions.
in traditional evaluation (all decision trees on all clas-
sification instances). Let us take the example where
we have population size 100 and number of classi-
fication instances is 1000. If we use lazy evalua-
tion with tournament size of 2, we have 400 eval-
uations (2 ∗ 100 ∗ 2), for evaluation with tournament
size of 5 we get 1000 evaluations (5 ∗ 100 ∗ 2) and if
we have the lazy evaluation with tournament size of
10, we have 2000 (10 ∗ 100 ∗ 2). But the standard GP
always has 100,000 evaluations (100 ∗ 1000), much
more than any of the lazy evaluations.
Of course, this is only in theory, so time saved
with this approach would not be directly in the same
proportion in practice. We will test the real time saved
in the next section with the experiment.
3.1 Weighting the Classification
Instances
Based on the proposition and results from the paper
(Gathercole and Ross, 1994), we decided to include
the weighting of classification instances through the
evolution process. The weights of classification in-
Figure 4: The line in the charts shows the number of times
the particular instance was chosen for evaluation process in
the 2500th generation (top) and 5000th generation (bottom).
The area in the bottom part of charts shows the weight of
that particular instance. Note that the number of picks of
any particular instance for evaluation is linked to its weight.
stances determine the probability of that instance get-
ting chosen to be used for the evaluation process –
the higher the weight, more chance of that instance
getting picked. The weights change based on the
difficulty of classifying of that particular instance –
more times the instance is misclassified, the higher its
weight becomes and more chance it has to be chosen
again for the evaluation. This forces the GP to focus
on more difficult instances and compensates for a few
instances used in the evaluation.
In contrast to the paper by Gathercole and Ross
(Gathercole and Ross, 1994), we choose different in-
stances for every tournament in one generation and
not the same instances for every evaluation in one
generation. This raises the chance of one instance get-
ting chosen for the evaluation and further diversifies
the search space without raising the number of total
evaluation in one generation.
Our weighting strategy is as follows. In the begin-
ning, all of the instances have the same initial weight
of 1. For every misclassification of that instance, its
weight is increased by the amount 1/n, where n is the
number of classification instances in the test set.
The Figure 4 shows instance weights and num-
ber of picks, first chart in the middle of the evolu-
tion (2500th generation) and the last chart for the last
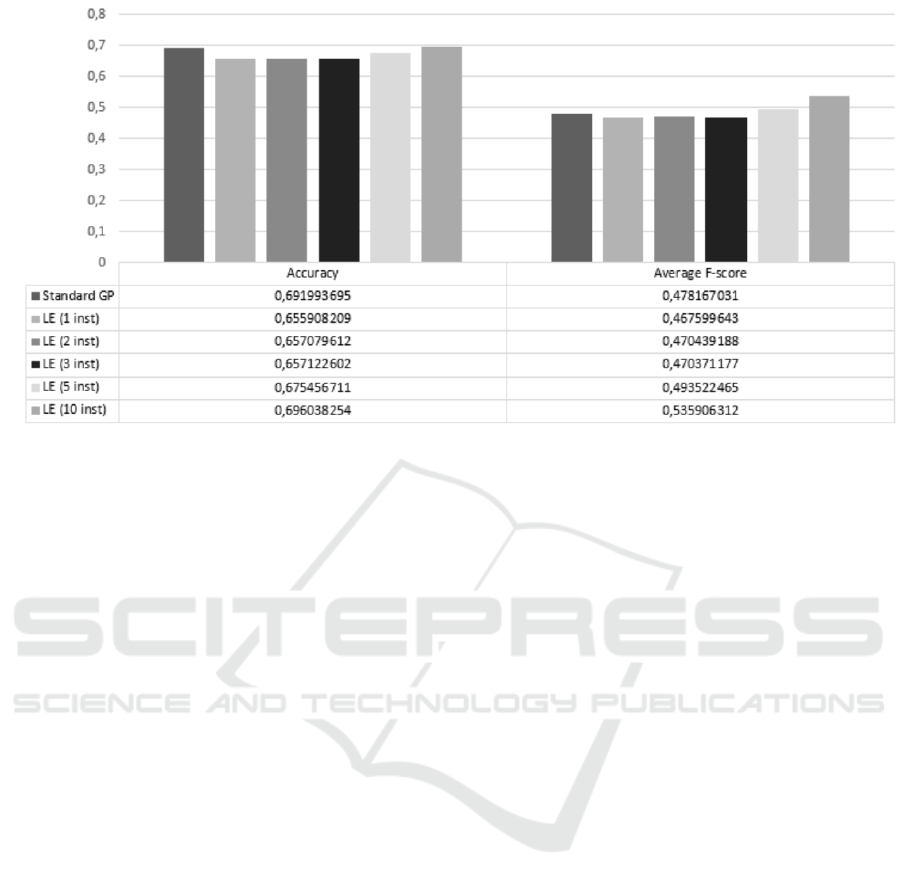
Figure 5: Classification metric of the resulting classification decision trees on all 10 datasets with 5 fold cross validation.
LE = Lazy evaluation; inst = number of instances used in the evaluation process.
(5000th) generation. As we can see from the charts,
some of the weights (and consequently a number of
picks) stay the same through the evolution, but others
increase throughout the evolution.
4 FIRST EXPERIMENTS WITH
LAZY EVALUATION OF GP
FOR CLASSIFICATION
We conducted first set of experiments with our pro-
posed approach with lazy evaluation of evolutionary
classification decision trees. We used 10 classifica-
tion benchmark datasets from UCI repository (Lich-
man, 2013) and we measured following metrics: total
accuracy, average F-score (β = 1) and total running
time of the whole process from start to finish. All of
the tests were done using 5 fold cross-validation.
Datasets used in te experiments were the follow-
ing: autos, balance-scale, breast-cancer, breast-w,
car, credit-a, diabetes, heart-c, iris and vehicle.
The GP settings were set to the following values:
• selection method: tournament
• fitness function:
(1 − accuracy)+ (0.02 ∗ numberO f Nodes)
• population size: 150
• elite size: 1
• number of generations: 2000
• crossover probability: 100%
• mutation probability: 10%
• number of runs: 10
Although some operators in GP can be paral-
lelized, we compared non-parallelized version in our
experiments, but parallelizing the lazy evaluation is
one of our goals in the future.
4.1 Classification Results
Figure 5 shows two classification metrics: overall ac-
curacy and average F-score for all of the 10 datasets.
As it is evident from the number from the table in Fig-
ure 5, there are slight differences in both metrics be-
tween different settings. The best performing GP ac-
curacy wise is GP with lazy evaluation (0.70) where
we used 10 instances in the evaluation process, fol-
lowed by the standard GP with no lazy evaluation.
The same lead is shown in the F-score metric, where
GP with lazy evaluation scored 0.54.
Kruskal-Wallis test for multiple groups returned
that there are statistically significant differences be-
tween groups for accuracy (χ
2
= 370.465, p < 0.001).
Post-hoc test of pair-wise comparison for accuracy
with Holm-Bonferroni correction for multiple com-
parisons shows, that there are no statistically signifi-
cant differences between two of the best performing
GPs (between Standard GP and GP with lazy evalua-
tion with 10 instances. p = 0.852).
Similar are the results of Kruskal-Wallis test
for average F-score metric, where there are statisti-
cally significant differences between different settings
(χ
2
= 191.558, p < 0.001). Here the post-hoc test
with the correction shows that there are statistically
significant differences between standard GP and GP
with lazy evaluation with 10 instances (p < 0.001).
4.2 Evolution Time Analysis
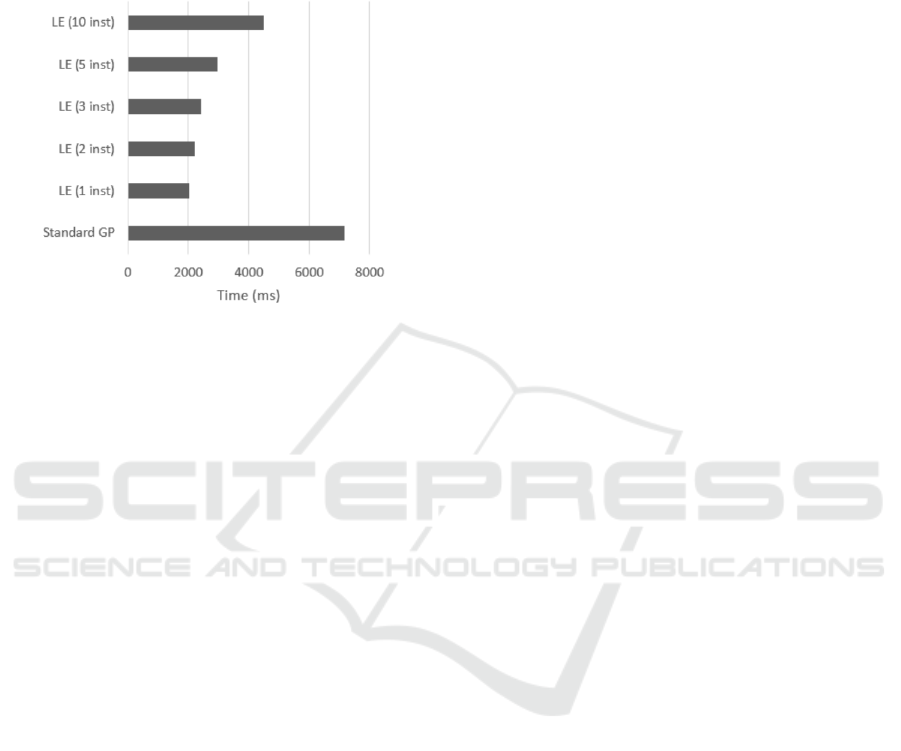
Figure 6: Average total running times of the whole evolu-
tion process in milliseconds for all settings.
LE = Lazy evaluation; inst = number of instances used in
the evaluation process.
Looking at the running time shows a clear lead
of the lazy evaluation GPs in comparison to standard
GP. The slowest lazy evaluation GP is the one with
10 instances used in the evaluation process that used
on average 4495.92 milliseconds, which is just 62.6%
of the average total running time of the standard GP
with the average total running time of 7182,97 mil-
liseconds.
We see that the running times are not proportion-
ally smaller in comparison to the theoretical saving
due to fewer evaluations, but they are still smaller.
5 CONCLUSIONS
We proposed a lazy evaluation approach in genetic
programming process of creating the classification
decision trees that uses dynamic choosing of the in-
stances.
Results of the first experiments show, that this ap-
proach has great potential and should be explored fur-
ther on. Not only that all of the lazy evaluation GPs
took less processing time to finish the whole evolution
process in comparison to standard GP, some settings
(with more instances in evaluation process) returned
comparable results (in accuracy and average F-score).
One of the lazy evaluation settings included (with 10
instances in evaluation) in the experiment even re-
turned better results than the standard GP. This can be
contributed to changing environment of the GP, thus
preventing to overfit the solutions and to the weight-
ing process that gives more importance (more chance
to be involved in evaluation process) to harder to clas-
sify instances.
We are planning to research lazy evaluation fur-
ther and to test the importance of the tournament size
and explore the number of evaluation instances fur-
ther on. Other than that, there is already an ongoing
implementation of parallel lazy evaluation that should
be directly comparable to parallel GP for decision tree
creation.
REFERENCES
Breiman, L., Friedman, J., Stone, C. J., and Olshen, R. A.
(1984). Classification and regression trees. CRC
press.
Cheng, J., Fayyad, U. M., Irani, K. B., and Qian, Z. (1988).
Improved decision trees: a generalized version of id3.
In Proc. Fifth Int. Conf. Machine Learning, pages
100–107.
Espejo, P. G., Ventura, S., and Herrera, F. (2010). A
survey on the application of genetic programming to
classification. IEEE Transactions on Systems, Man
and Cybernetics, Part C: Applications and Reviews,
40(2):121–144.
Ganjisaffar, Y., Caruana, R., and Lopes, C. V. (2011). Bag-
ging gradient-boosted trees for high precision, low
variance ranking models. In Proceedings of the 34th
international ACM SIGIR conference on Research and
development in Information Retrieval, pages 85–94.
ACM.
Gathercole, C. and Ross, P. (1994). Dynamic training subset
selection for supervised learning in genetic program-
ming. Parallel Problem Solving from NaturePPSN III,
pages 312–321.
Liaw, A., Wiener, M., et al. (2002). Classification and re-
gression by randomforest. R news, 2(3):18–22.
Lichman, M. (2013). UCI machine learning repository.
Podgorelec, V.,
ˇ
Sprogar, M., and Pohorec, S. (2013). Evo-
lutionary design of decision trees. Wiley Interdisci-
plinary Reviews: Data Mining and Knowledge Dis-
covery, 3(2):63–82.
Podgorelec, V. and Zorman, M. (2015). Decision tree learn-
ing. In Encyclopedia of Complexity and Systems Sci-
ence, pages 1–28. Springer.
Quinlan, J. R. (2014). C4. 5: programs for machine learn-
ing. Elsevier.
ˇ
Sprogar, M. (2005). Excluding fitness helps improve ro-
bustness of evolutionary algorithms. In Knowledge-
Based Intelligent Information and Engineering Sys-
tems, pages 905–905. Springer.
Zhang, B.-T. and Cho, D.-Y. (1998). Genetic programming
with active data selection. In Asia-Pacific Conference
on Simulated Evolution and Learning, pages 146–153.
Springer.
