
Success of the Functionalities of a Learning Management System
Floriana Meluso, Paolo Avogadro, Silvia Calegari and Matteo Dominoni
Department of Informatics, Systems and Communication (DISCo), University of Milano-Bicocca,
Viale Sarca 336 Building 14, Milano, Italy
Keywords:
Learning Analytics, LMS, Indicator, Message System, Zipf.
Abstract:
The goal of this research is to define and implement indicators for a Learning Management System (LMS). In
particular, we focus on estimating patterns on the utilization of the message system by defining two quantities:
the specific utilization and popularity. The idea is to take into account the perspective of academic institution
managers and the administrators of the LMS, for example to understand if a particular department fails at
providing a useful LMS service, or in order to allocate the correct amount of resources. These indicators have
been tested on the LMS employed by the “Universit`a degli Studi di Milano-Bicocca” (Milan, Italy), and in
general provided a picture of poor utilization of the message system, where the usage follows a pattern similar
to the Zipf law. This feature, correlated with the principle of least effort, suggests that LMSs should join forces
with existing social networking systems to create strong online learning communities.
1 INTRODUCTION
Learning analytics (LA) refers to a wide range of
fields of research such as process mining, business
intelligence, data processing, information retrieval,
technology-enhanced learning, educational data min-
ing and data visualization (Scheffel, 2015; Romero
et al., 2007). LA makes use of indicators and tools to
understand, control and predict (Moodlerooms, 2017)
the processes related to the learning activities for in-
stitutions at different academic levels ranging from
primary schools, high schools to universities, work-
place, etc. LA tools are becoming more and more
popular in the e-learning community because they are
considered an added value for Learning Management
Systems (LMSs) as they provide an insight of the user
learning activities allowing to determine e.g. expert
users, at-risk students, etc.(Avogadro et al., 2016b;
Sclater et al., 2016). Learning is a dynamic activity
that requires a constant monitoring, evaluation, and
adaption to the requests and needs of the stakehold-
ers to guarantee analysis of quality and ad-hoc out-
comes (Lukarov et al., 2015). In the last years, LA
had a strong role within the context of the flipped
learning (FL) paradigm where a novel and emergent
approach to imparting knowledge is proposed (Filiz
and Kurt, 2015). The FL is considered an extension
of the flipped classroom paradigm where a key role
is assumed by the social features within the learning
practice. This view extends learning beyond the for-
mal boundaries of the classroom and provides a vir-
tual learning environment always available (i.e., any-
where and anytime) for consultation and knowledge
sharing with a strong impact on understanding the so-
cial dynamics among peers. Thus, the evolution of
learning (Dalsgaard, 2006) is going toward the defini-
tion of a social learning management system (Social
LMS) which allows to provide a “complete learning
environment” that takes into account the social ele-
ments (e.g. collaborating, networking and informa-
tion sharing capabilities) to improve the practices of
learning. Within these platforms, the social aspects
become central for all the activities. Once a group of
learners establishes a social network, it is possible to
study their participation with social network analysis
(SNA) techniques which allow to uncover non triv-
ial structures (Rabbany et al., 2011). The advantages
which can stem from the utilization of a Social LMS
are related with (but not limited to) providing an eas-
ier and more uniform academic experience with the
help of peers. Currently most of the LMSs cannot be
regarded as “social” ones because of limited imple-
mentations of social features, however most of them
include messaging systems which can be considered
as embryonic versions of social LMSs.
Our research activity is focused on analyzing the
modules defined in a LMS that are related to the
knowledge sharing among peers for having an in-
98
Meluso, F., Avogadro, P., Calegari, S. and Dominoni, M.
Success of the Functionalities of a Learning Management System.
DOI: 10.5220/0006475800980106
In Proceedings of the 6th International Conference on Data Science, Technology and Applications (DATA 2017), pages 98-106
ISBN: 978-989-758-255-4
Copyright © 2017 by SCITEPRESS – Science and Technology Publications, Lda. All rights reserved

sight of the communication within the platform. For
this reason, we decided to study the utilization of the
messaging system of the LMS presently in use at the
Universit`a degli Studi di Milano-Bicocca, Italy. This
LMS is an instantiation of Moodle, version 3.1. In
the literature, LA provides insights for students with
an opportunity to take control of their own learning,
gives them a better idea of their current performance
in real-time and helps them to make informed de-
cisions about what to study (Scheffel et al., 2014;
Scheffel et al., 2015). In addition, LA is a useful tool
for teachers who can have a general vision on how
learners are studying, the success of their learning
practices, etc. (M¨odritscher et al., 2013; Ferguson,
2014). Our research considers LA with a different
look, the goal is to monitor the several LMSs func-
tionalities for managing the governance of academic
institutions to check how learners and academic staff
interact with the LMS. This analysis could improve
the decisional process of the policies (both hardware
and software) dedicated to the effort necessary to pro-
vide to the users a LMS of quality. In our vision,
the quality refers to provide efficient and effective e-
learning services with good performancesof usability.
The methodology followed in this research is the
following: we first defined quantities of interest based
on the present literature on the subject. Following
these needs, a mathematical implementation has been
proposed. The formulae have been confronted with
data, and the patterns have been modeled with para-
metric functions in order to summarize the most in-
teresting features. To this aim, we defined two indica-
tors: “specific utilization” and “popularity”, respec-
tively; they are aimed at analysing how widespread
a specific functionality of a LMS is. In detail, spe-
cific utilization is an indicator aimed at verifying how
many users accessed to the LMS activities in respect
to the whole possible users, whereas popularity is an
indicator aimed at analysing the real usage of the
functionality referred to the e-learning community
which really accessed it. For a better understanding
of this last functionality we defined the real utiliza-
tion plot, which helps in visualizing the distribution
of the utilization among the users. By observing the
real utilization plot, it became clear a similarity of the
observed trends with power laws, and thus we fitted
the data and compared it with the Zipf law. As pre-
viously described, we have applied these indicators
to the analysis of the messaging system used in an
instance of the Moodle LMS. The indicators showed
that the present utilization of the message feature is
far from being mature (although it is growing).
The paper is organized as follows. Section 3 de-
fines the indicators aimed at analysing the utilization
of generic LMS activities, with the objective to tune
the policies of governance for better managing the e-
learning platform. Section 3 presents a case study
where the indicators have been applied to analyse the
“message” activity for the Moodle platform used at
the Universit`a degli Studi di Milano-Bicocca, Italy.
Finally, in Section 4 the conclusions are stated.
2 RELATED WORK
The social activity of the students and teachers on a
LMS has already been addressed in the literature. In
this section, we provide a brief report of those works
and the differences or similarities with the present pa-
per.
A well known suite of learning analytics based on
MoodleRooms is XRay (Moodlerooms, 2017). The
users of this analytic tool are administrators, teach-
ers and students, and its own main features include
many statistical tools to control the learning trend of a
course and make predictions about the behavior of the
students less administrators. At variance with the LA
provided by the XRay dashboard, the research pre-
sented in this paper is more focused on the adminis-
trators point of view, and in detail on the analysis of
the message activity. The intent is to understand if the
students/teachers access to the message activity prop-
erly. The indicators here provided are not defined in
the actual version of XRay. (Macfadyen and Daw-
son, 2010) study how to predict the failure or success
of the students of five classes of an online course (26
students) based on the information which can be re-
trieved from a LMS (which includes the total number
of sent and read messages by each single user). A so-
ciogram based on the properties is established in order
better understand the dynamics among the students.
On top of this a logistic regression is utilized for pre-
dicting the success of the learners. In this respect the
study is also aimed at helping the teachers to have an
evidence of how students are learning; but at variance
with our work it is focused on the single student rather
than providinga global utilization view of the features
of the LMS. In (Romero et al., 2007) it is provided a
survey of the data mining techniques which could re-
sult useful for a LMSs. In particular, it is shown how
to implement these techniques for the Moodle suite.
In (Rabbany et al., 2011) it is presented an interesting
work on the importance of social network analysis in
order to understand the structures which are present
within groups of students. As an application, they
provide a tool aimed at establishing educational so-
cial networks based on the asynchronous interaction
provided by forums. Also in this case the aim is not
Success of the Functionalities of a Learning Management System
99

to provide a tool to control the utilization of the mes-
sage system but rather the structures arising within
the students. (Avogadro et al., 2016a) provide an ex-
tended method to create social graphs due to the inter-
action for both synchronous (chat) and asynchronous
(forums) social interactions within a Social LMS,
moreover the time dependence of the bond between
students is explicitly taken into account. As an exper-
iment, a learning management system for two courses
is replaced by the Facebook groups in the work by
(Wang et al., 2010). Since Facebook is an extremely
popular social tool, it becomes natural to try to under-
stand if it can effectively replace a LMS. The result
of the research is that the features of a carefully made
LMS are still superior to the functionalities provided
by Facebook moreoversome students were concerned
about their privacy.
3 INDICATORS OF UTILIZATION
Modern LMSs provide a large variety of functionali-
ties/activities (such as, messaging system, chat room,
forum, etc.), it is thus natural that some of them have
higher or lower success in terms of access by the
users. Users can be divided into two groups: students
and academic personnel. Students refer to the learn-
ers who access to the LMS functionalities to acquiring
new skills, sharing materials, etc.; whereas, academic
personnel includes teachers, university managers and
LMS administrators. The e-learning community is
very heterogeneous, it is thus common for LMSs to
be provided with monitoring systems which allow to
control the activities from different points of view.
For example, a student might be interested in his/her
own grades, a teacher might be interested in the ac-
tivity of the single student or a whole class within a
single subject. This paper is focused on the point of
view of the university managers and LMS adminis-
trators who are responsible of providing the services
of the LMS. This research proposes an approach to
help the governance of an academic institution, where
the utilization indicators of a LMS are naturally di-
vided according to different features/parameters (such
as courses, academic years, etc.) that allow to corre-
late the utilization with the structure of the courses.
The term utilization in the present paper is referred
to the amount of accesses to a given LMS functional-
ity. This quantity can be specifically divided accord-
ing to particular needs, for example if a person is in-
terested in understanding the structure of a university
it is meaningful to divide the indicators into different
“departments”, and academic years. In this respect,
we propose to consider the amount of accesses divid-
ed by the total number of possible users. This quantity
has been called specific utilization (or, in short, su)
and it is obtained with the formula:
su(a,t,p) =
# of accesses(a,t,p)
# of users who can access(a,t)
(1)
This quantity provides a direct insight of the diffu-
sion of a specific LMS functionality among the users
within a particular department/area/course of utiliza-
tion (a), at a given time (t), according to one or more
given parameters indicated here with the vector (p).
For example, in the following we will consider the
message system accessed by students of the LMS in
use at the Universit`a degli Studi di Milano-Bicocca,
where the parameter (p) refers to the fact that we want
to distinguish between the sent only or received only
messages, and we are also interested in distinguishing
subsets of the whole community who can access to
the functionality. Clearly the specific utilization can
be evaluated for other functionalities accessible to the
students of a LMS. In practice, in order to calculate
this quantity, it is necessary to know a timestamp, and
an identifier of the student who accessed it. Binning
the utilization within fixed time spans allows to set
the time granularity of the information (the academic
year is a very natural choice, but one can decide to
follow shorter or longer time frames).
The specific utilization indicator provides a quick
insight about the success of a functionality, however it
is important to consider that some activities (although
accessible to the whole student population) might be
aimed specifically to a restricted group and, for this
reason, it might be more interesting to obtain spe-
cific information about the utilization of those who
really accessed to the functionality (while neglect-
ing the information regarding those who could access
to the functionality but for some reason did not do
it). For example, a functionality relevant only for a
small subset of the whole student population, might
obtain a small specific utilization score, although it
had reached most of the intended users. This is the
case of the message system for the present case study
(Moodle at Universit`a degli studi di Milano-Bicocca)
where all the enrolled students have access to it, but
some departmentshave a very limited implementation
of the platform and, as a result, it becomes essentially
useless for the student to access message system.
In order to better understand the real usage of an
activity, we consider a plot (called real utilization
plot) where on the abscissa there is the total number of
accesses to a given activity of the LMS, while on the
ordinate we consider the amount of students which
used the activity that particular number of times. A
graph of this kind can return interesting information
DATA 2017 - 6th International Conference on Data Science, Technology and Applications
100

about how the students interact with the functionality.
If the majority of the population accesses the func-
tionality for a very limited number of times one can
expect that the functionality does not require many
usages to provide a complete experience. As an ex-
ample, one might consider the accesses to the area of
the website containing the forms for the definition of
the curricula. Since one student does not modify daily
his/her own curriculum path, this functionality is ex-
pected to be subject to a limited number of accesses
per student (but most of the students should access
it). If the data utilization of this functionality shows
that there is a large amount of students who accesses
the curriculum web page tens of times, this might im-
ply that the associated web page does not provide a
clear indication of the meaning of the forms and this
puzzles the students who need to access repeatedly
before solving their problem. A completely different
scenario would be related with the social functional-
ity of a LMS which allows the students to share in-
formation with their peers. In this case, if the vast
majority of the students accesses this functionality a
limited number of times it is reasonable to think that a
critical number of users has not yet been reached and
for this reason the functionality is not really working
as a social binding mechanism. From the real uti-
lization plot as detailed above, it becomes natural to
extract the weighed average of utilization, which we
call popularity:
popularity(a,t, p) =
∑
∞
n=1
n·U
n
(a,t,p)
∑
∞
n=1
U
n
(a,t,p)
, (2)
where the sum runs over the number of accesses n,
which ranges from 1 to infinity (this is not a prob-
lem since U
n
is different from 0 only on a finite num-
ber of values, which depends on the binning proce-
dure), U
n
(a,t,p) is the number of users who accessed
n times to the functionality according to the depart-
ment (a), time (t) and (possibly) a set of features de-
noted as (p). As a normalizing constant, we divide by
the sum of the users which accessed the functional-
ity). The popularity indicator provides a value of how
much the feature is accessed by the real users (not
counting those who could access and did not access).
From the point of view of the administrators of a
social LMS the popularity of a given module provides
a simple insight about the utilization of the module
itself (once the number of users is known). Given
the (average) amount of resources which are required
for a single utilization times the popularity times the
number of accessing users allows for an estimate of
the total amount of resources required. Since this
study is aimed in particular to universities it is natural
to think that different departments might have differ-
ent managements, and for this reason the specific uti-
lization and popularity are expected to be a function
of the department and the time span considered.
4 CASE STUDY: MESSAGE
MODULE OF MOODLE
This research belongs to a broader project regarding
learning analytics with a particular attention to Social
LMSs. Social LMSs are not yet as diffused as the
“normal” LMS. For this reason, we decided to under-
stand the impact of the social features of a “normal”
LMS to estimate their utilization. The data analysed
in this study belongs to the implementation of Moodle
in use at the Universit`a degli Studi di Milano-Bicocca
(the version currently employed is 3.1.3). Moodle
is a very popular (over 70000 sites in 233 nations)
Learning Management System based on the pedagog-
ical principles of social constructivism, it is an open
source project regulated under the GNU GPL licence
which allows for the creation and management of on-
line courses. By using MySQL and R we were able to
obtain the relevant information and calculate the in-
dicators described in the previous sections. There is
a message module available for Moodle which allows
a student to interact, and exchange knowledge related
to the university or informal material. This module
represents a step toward a social LMS and as such
we wanted to understand its success in a medium-
large state university like Universit`a degli Studi di
Milano-Bicocca where all the students (about 35000,
per academic year during the years of our analysis)
are granted access to this functionality (all the data of
the rest of the paper refers to it).
4.1 Specific Utilization
This paragraph describes the application of the
specific utilization indicator detailed in Section 3
for the academic years 2013/2014, 2014/2015 and
2015/2016. As detailed above, the idea is to use the
indicators for a better governance and control of the
university (both from the point of view of the admin-
istrators of a LMS and the teachers responsible for
its utilization among the different departments). The
process of retrieving the department of each student
was rather cumbersome: from each message, we were
able to obtain the internal email of the sender, at this
point it was possible to find all the courses where the
student was enrolled. In the database, each course is
associated with a “department/area”, and thus it was
possible to link at least one department to each of
the courses. Unfortunately, some of the courses were
shared between different departments and this could
Success of the Functionalities of a Learning Management System
101
0
0.1
0.2
0.3
0.4
0.5
0.6
0.7
0.8
Sciences Education
Sciences
Medical
Sciences
Economy and
Statistics
Law Psychology Sociology
Specific Utilization
2013/2014
2014/2015
2015/2016
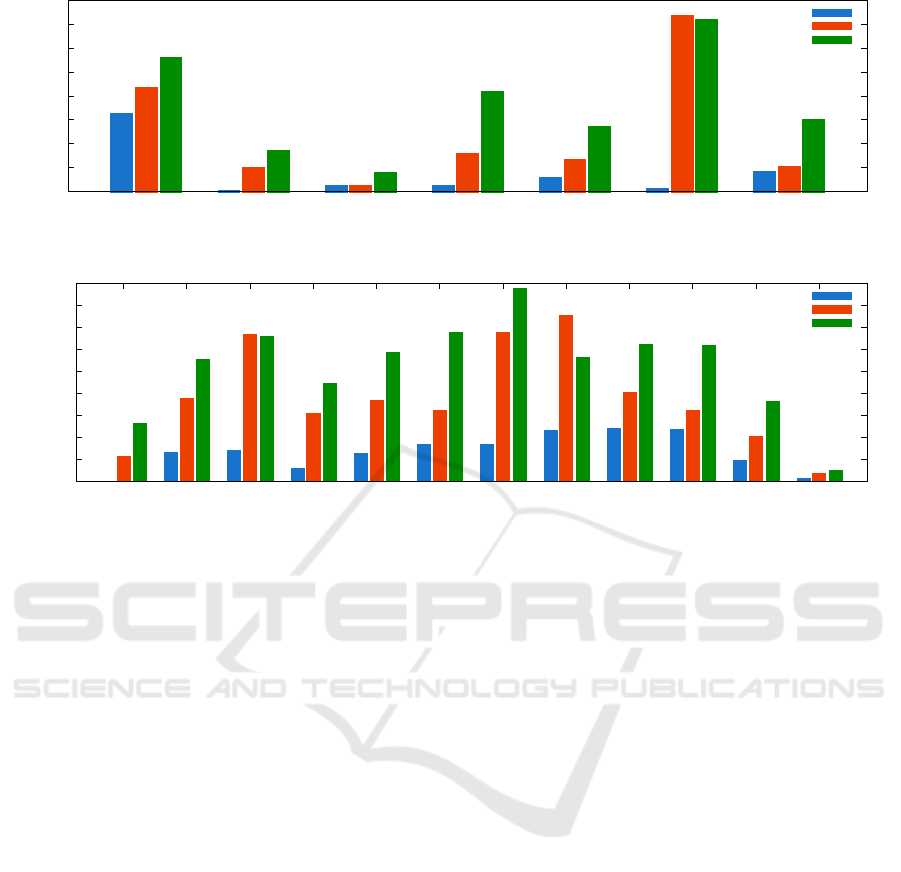
Figure 1: Specific Utilization of the sent messages among the students.
0
200
400
600
800
1000
1200
1400
1600
1800
Sep Oct Nov Dec Jan Feb Mar Apr May Jun Jul Aug
sent messages: students
2013/2014
2014/2015
2015/2016
Figure 2: Total amount of messages sent by month in the three academic years.
lead to uncertainty, i.e. whether a student belonged
to one or the other department. At present, this un-
certainty cannot be avoided, and as a result some stu-
dents have been classified in more than one depart-
ment. Since this problem affects a minority of the
population (less than 5%) we included in our analysis
all the possible students for each department, allow-
ing for duplicates. This implies that all the results
presented in this
paper are subject to an error of the order of 5%
in the quantification of the indicators. Because of the
Moodle implementation, the act of sending or receiv-
ing messages provides different insights about the us-
age of the message functionality and for this reason
a distinction should be made. In the formula pre-
sented in Section 3 we introduced a vector parame-
ter p, for discriminating the functionality under in-
vestigation among different properties, in this case
the parameter is a scalar, p which indicates whether
we are considering only sent messages or only re-
ceived messages (which can also be associated with
different groups of senders/receivers). The reason for
this discrimination is that the LMS of the Univer-
sit`a degli Studi di Milano-Bicocca allows students to
send messages among each other, but it also allows
teachers and administrative employees to send mes-
sages. While the students can only send one-to-one
messages (one sender and one receiver), the adminis-
trators and teachers can access to the modality one-
to-many (one sender many receivers). This last fea-
ture is particularly useful when general information
has to be sent to many people, nonetheless is seems
clear that there is a difference in the purpose of the
one-to-one and one-to-many messages. On the other
hand, there is no explicit track on the system regard-
ing whether the message was a one-to-one or one-to-
many (a detailed analysis of the body of the message
could overcome this problem but at the present stage
of this work it is beyond our scope), while we can dis-
tinguish between sent and received messages. In the
case of the specific utilization associated with the sent
messages we take into account only those messages
which were sent by the student population and remove
those which are due to the academic staff/teachers.
By using this division, we want to obtain an infor-
mation regarding the success of the message system
among the students as a socialization mean. In Figure
1 there is the specific utilization for different depart-
ments and during the academic years under consider-
ation; it is interesting to notice that this indicator is
higher in the Sciences and Psychology departments
than in the Sociology or Medical ones (this last one
attains the lowest score among the departments for
the academic year 2015/2016). On one hand, there
has been a noticeable increase in the utilization since
2013/2014.
However, the absolute values of the specific uti-
lization in all the departments is very limited since it
never exceeds 1.
This means that over one academic year, on av-
DATA 2017 - 6th International Conference on Data Science, Technology and Applications
102
erage, each student used the message system to in-
teract with another person belonging to the university
less than one time. Similar figures can be obtained
for the received messages but in this case the stu-
dents received up to 3 messages per year (it should
be noted that in this case the messages include also
those sent by the academic personnel). The trend ac-
cording to which the specific utilization increases is
common among all the departments. For a better un-
derstanding, we decided to consider the total amount
of sent messages on a month time frame, while we did
not divide among the departments for a better read-
ability (Figure 2). Only during April 2016 there has
been a slight decrease in the total number of sent mes-
sages. The present values of the indicators, however,
confirm a picture where the increase in utilization of
the message modulus from the students, although no-
ticeable, is not going toward important values within
the next few years, for example the highest increase
was in the Psychology department from 2013/2014
to 2014/2015 and it was less than 1 message per
year. This increase can be attributed to internal reg-
ulations of the Psychology department, which under-
went a change in the policies, according to which all
the courses had to be available online on the Moodle
framework (this was not true in the previous year).
In this respect, this is an example of the impact that
regulations can have on the utilization of a feature.
However it also reminds that, when considering a so-
cial feature like a message system where the peers
are expected to input and populate the data, a sin-
gle policy does not necessarily have an impact which
can provide qualitative change. The social network
which should result from the exchange of messages
suffers, in fact, from the very strong concurrence of
other means of communication (Susilo, 2014) which
are already well established among the students. In
fact, even considering that all of the departments fol-
low this increasing trend it would take tens of years to
reach specific utilization values of the order of tens of
messages per year. For this reason, the present status
of the message system seems to require a qualitative
change related to the LMS in order to reach a critical
level. The indicators can thus be useful to the admin-
istrators to understand if their efforts to improve the
message system are being successful or not.
There is clear indication of seasonality (see Figure 2),
however the data in our possession regards only three
academic years, and a possible seasonality analysis
should be confirmed in future investigations. In par-
ticular during July, August and September the amount
of messages exchanged is lowerthan the other months
(due to the summer breaks), while March and April
are typical exam session months which spark the need
to exchange information.
4.2 Popularity
We consider here the popularity associated with the
sent messages. The sent messages have been split in
two parts, those due only to the students and those
messages sent by the academic personnel (including
staff and teachers). However, there is no direct dis-
tinction between administrative staff and teachers.
1
10
100
1000
10000
100000
1 10 100 1000
amount of senders: students
message count
observed
y= 4896/x
1.47
y=27246/x
2.73
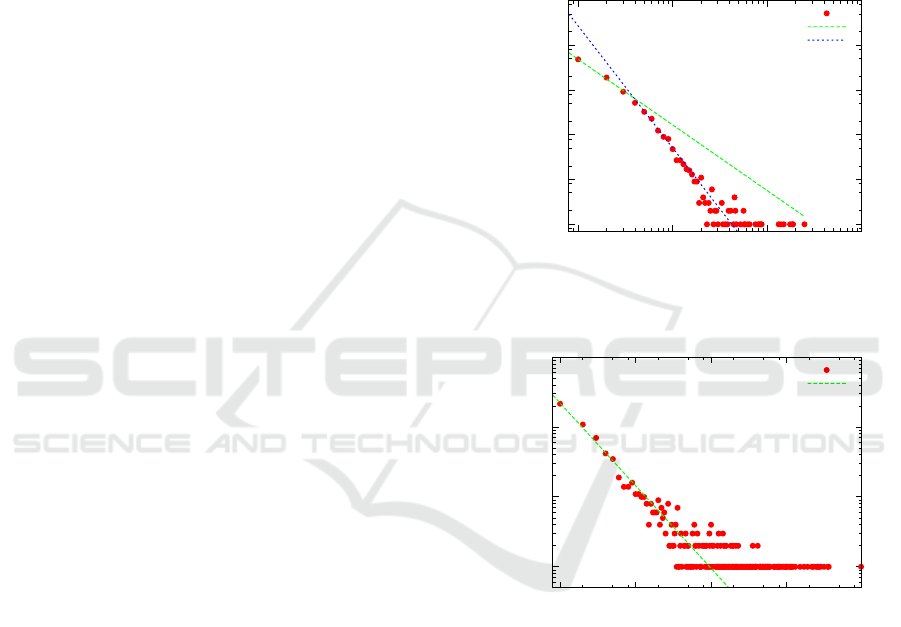
Figure 3: Real utilization plot of the sent messages for the
students.
1
10
100
1000
1 10 100 1000 10000
amount of senders: academic
message count
observed
y=220.8/x
1.2
Figure 4: Real utilization plot of the sent messages for the
academic personnel.
As a result, it becomes unfeasible to divide by
department the senders labeled as academic. Since
we were interested in comparing the functionality be-
tween the two user groups (students and academic),
we did not divide by department the students either.
The resulting graphs span many orders of magnitude
in terms of number of users and of sent messages, as
such we resorted at using double logarithmic plots
for the representation (Figure 3 and 4). The total
number of senders (students) in the academic years
2013/2014, 2014/2015 and 2015/2016 is 9330, and
the number of sent messages amounts to 24881. As
denoted in Section 4.1 the specific utilization of this
Success of the Functionalities of a Learning Management System
103
module is very limited. In Figure 3 it is shown the
real utilization plot of the senders as a function of
the number of messages sent during the three aca-
demic years. For a better understanding, we decided
to use parametric functions to fit the data. A single
parametrization does not seem sufficient to provide
a comprehensive understanding of all the significant
features. As a result, in order to constrain the func-
tional behaviour we decided to fit it with two power
laws of the form:
U
n
=
A
n
k
(3)
Where A is a constant, n represents the number
of sent messages, while k involves the steepness of
the power law (higher k implies a steeper descent as
a function of n). There are at least three different pat-
terns: between 1 and 4-5 sent messages the points
seem to fit nicely a power law (which takes the form
of a straight line in a double logarithmic plot), then
there is a kink in the distribution, and the points be-
tween 5 and 20 messages form another line with a
different slope (k). Above 20 messages it becomes
difficult to consider the data as following a simple
parametrization, this is also due to the fact that it is
nonsense to have a fractional number of senders and
this in turn implies staggering distributions. In the
first part of the graph the power law which better fits
the data has a coefficient k = 1.5 and A is 4896. The
value of the parameter A is, essentially, the number
of users which sent just one message during the three
academic years. Between n = 5 and n = 20 the data
distribution can be fitted nicely with a power law with
exponent k = 2.73 (which implies a rather steep de-
scent of the distribution) and A = 27246 (this would
be the amount of users sending just one message if
all the points followed this parametrization). The tail
of the distribution corresponds to single students who
sent many more messages than the average, however
this tail does not represent a high percentage of the
whole volume of sent messages. The popularity of
the message module among the students is 2.8, which
means that even those who used the message feature
had a very limited access to it. A different situa-
tion arises when considering the diffusion of the mes-
sage module among the academic personnel (staff and
teachers). In this case, there are 531 active users who
sent 73357 messages during the three academic years
under consideration. The popularity of the message
system among the academic personnel is 138. This
shows that the message modulus is much more uti-
lized by the academic personnel in respect to the stu-
dents (although in this case the tail plays an impor-
tant role). The data distribution (see Figure 4) seems
to be reasonably explainable with a single power law
0.01
0.1
1
10
100
1 10 100 1000 10000
% of users
message count
students
academic
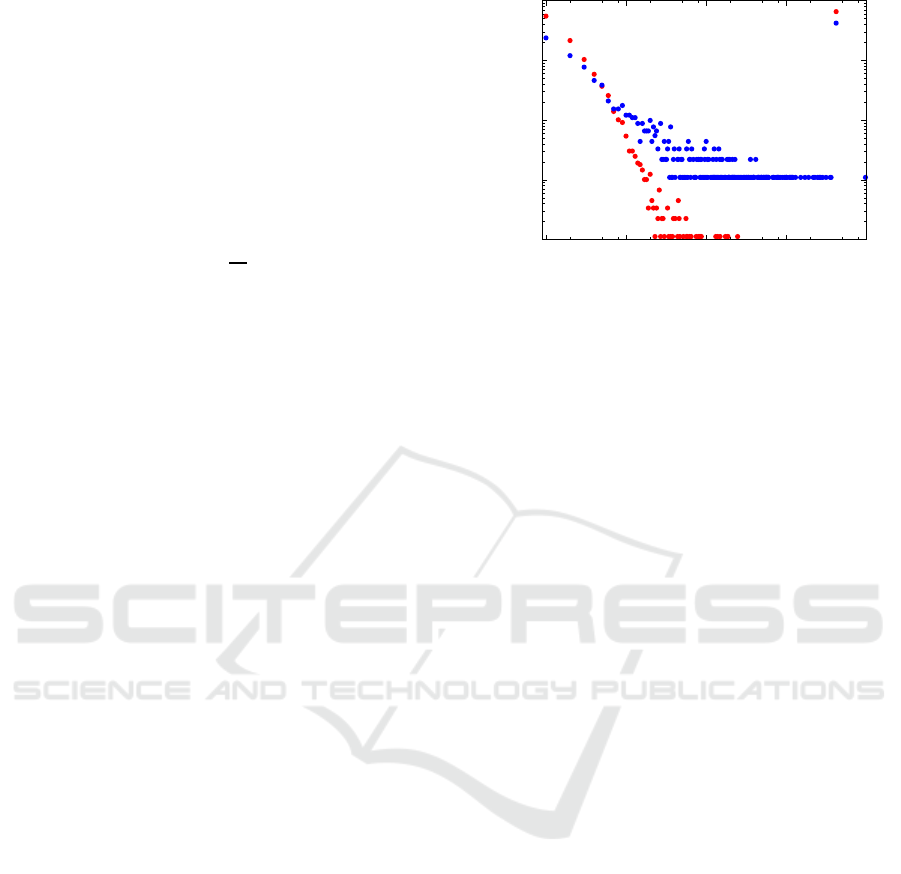
Figure 5: The percentage of message senders as a function
of the number of sent messages.
from n = 1 to n ≈ 40, where the exponent is equal
to 1.2. Beyond n ≈ 40 it becomes difficult to use
a parametrization since there are many single users
who sent a lot of messages. It is useful to remind
that the academic personnel can access to the one-to-
many message system. For this reason, the users of
the tail might appear as very active users, while in
practice they are mainly sending the notifications to
large groups of people at the same time.
We decided to compare the data obtained from the
academic personnel and the students to better under-
stand the different behaviours. However, the absolute
values of the two cases differ by orders of magnitude
and for this reason, in order to show both of the distri-
butions on a single plot, we re-normalized the amount
of users dividing by the total number of users who
accessed to the message module (times 100, thus ob-
taining a percentage value). In Figure 5 the two differ-
ent kinds of utilization are displayed. The usage due
to the students shows shorter tails than the academic
counterpart and also the number of users drops more
quickly as a function of the number of sent messages.
It is interesting to notice that around 20% of the aca-
demic personnel who accessed the message system
did it only once, while this quantity raises to about
45% in the case of the students (this seems a clear
indication of the fact that the academic personnel is
more involved in the message system of the LMS). A
confrontation of the shapes of tails is misleading. In
the tails, there are single users who sent many mes-
sages but when re-normalized on the total population
this returns different percentage values. Nonetheless
it is striking that a large percentage of the population
of the personnel belongs to the tails while the num-
bers are much smaller for the student population.
DATA 2017 - 6th International Conference on Data Science, Technology and Applications
104

4.3 Zipf Law
Although the context is rather different, the utiliza-
tion data here reported has some similarities with the
Zipf law (Zipf, 1935). In detail, this law was first dis-
covered studying the appearance frequency of words
within a given text; the interesting feature is that (for
a large set of texts, independent of the language or
the nature of the text) the second most frequent term
has a frequency which is roughly half in respect to
the first one, the third most frequent word has a fre-
quency which is about one third of the first one, and
so on. The frequency of the n
th
is thus 1/n in respect
to the most frequent term. A generalized version of
this distribution follows a law of the kind 1/n
k
, where
patterns with k close to 1 are closer to the original Zipf
law. The data collected from the messages sent by the
students does not conform very well with the Zipf law
(for example because a single power law does not pro-
vide a good fit of the data, Figure 3). Regarding the
academic personnel however, the similarity between
the classic Zipf law and the data collected is more in-
teresting since a single power law with k = 1.2 pro-
vides a good explanation of the amount of sent mes-
sages (Figure 4). The Zipf law has been associated
with the principle of least effort (Kingsley, 1946), ac-
cording to which humans tend to use the least effort if
the result is acceptable for a given purpose. In this re-
spect since there are easier means of communication
it is reasonable that the students resorted at using the
message module only when other forms were not fea-
sible. The academic personnel, however, which does
not have the same level of personal connection with
the students was simplified by the features accessi-
ble via Moodle. This could be confirmed by the long
tails, where, for the teachers/personnel, becomes eas-
ier to send one-to-many messages through the LMS
rather than via normal email where they should input
the name of each receiver.
In considering the pattern displayed as due to the
principle of least effort one can use this as a hint of
success or failure of the message system. In a success-
ful message system (e.g. Facebook chat, Whatsapp,
etc.) the users are not aimed at doing the minimum
possible effort to exchange information, while rather
the information is naturally spread and enriched when
passing from one person to the other. It is thus con-
ceivable that the real utilization plot of a successful
message system does not follow a Zipf-kind law, or at
least that the exponent, associated with the descent in
number of messages sent per person, should be very
small (< 1).
5 CONCLUSIONS
In this research, we built indicators aimed at pro-
viding an analysis of the amount of accesses to
the functionalities of a LMS. The goal is to pro-
vide tools which follow the perspective of the man-
agers/teachers of the university; in detail, specific uti-
lization provides information about the usage of a
functionality in respect to all the possible users, while
popularity provides insights about the real usage of
those who actually access the functionality. These in-
dicators have been tested on the database produced
by an instance of Moodle 3.1, adopted by the Uni-
versit`a degli Studi di Milano-Bicocca, Italy. As a
result, it was possible to observe that the functional-
ity under investigation, the messaging system, has not
yet reached a critical stage where there are strong ac-
tive groups creating a self-sustained community. The
level of interest for the message system depends on
the department but on the overall the utilization is
very scarce. It has to be noted that there has been
an increase of utilization through the years, however
a change of paradigm is required in order to achieve
an active social community. Although most of the
students have never accessed the message function-
ality there is minority of them which did it. Even
for those students the access was very sporadic, since
the overall popularity is less than 3. A different sce-
nario arises when considering the real utilization plot
of the message system associated with the academic
personnel. In this case the popularity reaches a value
of 137 (although this is strongly influenced by the
one-to-many message feature available to this group
of users). The present analysis has been introduced to
the administrators, and it is going to be taken into ac-
count for the next versions of the LMS. In the future,
we plan to design more indicators in order to obtain
a global monitoring of the functionalities of a LMS,
and apply it to the case of the Universit`a degli Studi
di Milano-Bicocca.
The utilization indicators detailed for the message
system can be implemented, in fact, for other kinds of
modules of a LMS, and form part of a more general
project aimed at providing tools to control and im-
prove the learning experience both from the point of
view of the students and the academic staff. A natural
improvement regarding the social aspects of the mes-
sage system is to monitor the timings between the act
of sending and receiving a message, and to check for
significant differences between these indicators due to
the gender of the users.
An interesting outcome of this research is that the
distribution of the users versus the number of sent
messages for the academic personnel (real utilization
Success of the Functionalities of a Learning Management System
105

plot) follows quite well the empirical Zipf law. This
is also true for the case of the students (although the
parameters used to fit the data differ). The fact that
these data follows power laws, might be interpreted as
a sign that the users are employing the message sys-
tem mainly when they are forced to do it (principle of
least effort) rather than considering it as an everyday
tool to be naturally used. The strong concurrence of
popular messaging systems might be a cause of this
unwillingness to use a more cumbersome module of
a LMS and might suggest that a synergy with those
systems (e.g. integrating the LMS and an already ex-
isting social network) might lead to better results in
terms of establishing a strong social learning commu-
nity.
This hybrid approach might help in overcoming
some of the natural limits of the social communities
which are being established on a LMS. First of all,
the time window which is naturally bounded to the
study course could be overcome (and for example the
messages would not be “lost” after the person is no
longer part of the LMS system). The students would
not need to access to many different messaging sys-
tem, and since they already access often times their
favorite social network they would be updated in real
time.
REFERENCES
Avogadro, P., Calegari, S., and Dominoni, M. (2016a). An-
alyzing social learning management systems for edu-
cational environments. Knowledge Discovery, Knowl-
edge Engineering and Knowledge Management.
Avogadro, P., Calegari, S., and Dominoni, M. (2016b). Ex-
pert students in social learning management systems.
Interactive Technology Smart Education 13(3): 202-
217.
Dalsgaard, C. (2006). Social software: e-learning beyond
learning management systems. European Journal of
Open, Distance and E-Learning Vol. 2 No. 1, pp. 1-9.
Ferguson, R. (2014). Learning analytics dont just measure
students progress they can shape it. theguardian.com.
Filiz, O. and Kurt, A. (2015). Flipped learning: misunder-
standing and the truth. Journal of Educational Re-
search, Vol. 5 No. 1, pp. 215-229.
Kingsley, G. (1946). Human behavior and the principle of
least effort. Addison-Wesley Press.
Lukarov, V., Chatti, M. A., and Schroeder., U. (2015).
Learning analytics evaluation - beyond usability. In
Proceedings of DeLFI Workshops 2015 co-located
with 13th e-Learning Conference of the German Com-
puter Society (DeLFI 2015), Seiten/Artikel-Nr: 123-
131.
Macfadyen, L. P. and Dawson, S. (2010). Mining lms data
to develop an early warning system for educators: A
proof of concept. Computers & Education 54 588-
599.
M¨odritscher, F., Andergassen, M., and Neumann., G.
(2013). Dependencies between e-learning usage pat-
terns and learning results. In Proceedings of the 13th
International Conference on Knowledge Management
and Knowledge Technologies (i-Know ’13),. Stefanie
Lindstaedt and Michael Granitzer (Eds.) ACM, New
York, NY, USA, Article 24 , 8 pages.
Moodlerooms (2017). Xray learning analyt-
ics. https://www.moodlerooms.com/resource/
x-ray-learning-analytics/. Accessed: 26-04-2017.
Rabbany, R., Takaffoli, M., and Za¨ıane, O. R. (2011). Ana-
lyzing participation of students in online courses using
social network analysis techniques. In Proceedings of
the 4th International Conference on Educational Data
Mining, Eindhoven, The Netherlands, July 6-8, 2011.
Romero, C., Ventura, S., and Garc´ıa, E. (2007). Computers
& education volume 51, issue 1, august 2008, pages
368384. Elsevier.
Scheffel, M. (2015). A framework of quality indicators for
learning analytics. Learning Analytics Review, no. 2,
ISSN: 2057-7494.
Scheffel, M., Drachsler, H., and Specht., M. (2015). Devel-
oping an evaluation framework of quality indi- cators
for learning analytics. In Proceedings of the Fifth In-
ternational Conference on Learning Ana- lytics and
Knowledge LAK 15. New York, New York, USA pp
16-20. ACM Press.
Scheffel, M., Drachsler, H., and Stoyanov., S. (2014). Qual-
ity indicators for learning analytics. Educational Tech-
nology & Society, 17(4), 117-132.
Sclater, N., Peasgood, A., and Mullan, J. (2016). Learning
analytics in higher education. Jisc.
Susilo, A. (2014). Exploring facebook and whatsapp as sup-
porting social network applications for english learn-
ing in higher education. In PDE Professional De-
velopment in Education Conference 2014, 11-12 Juni
2014, Park Hotel Bandung.
Wang, Q., Woo, H. L., Quek, C. L., Yang, Y., and Liu, M.
(2010). Using the facebook group as a learning man-
agement system: An exploratory study. Computers &
Education 54 588-599.
Zipf, G. (1935). The Psychobiology of Language.
Houghton-Mifflin.
DATA 2017 - 6th International Conference on Data Science, Technology and Applications
106
