
A Data-driven Framework on Mining Relationships between Air
Quality and Cancer Diseases
Wei Yuan Chang
1
, En Tzu Wang
2
and Arbee L. P. Chen
3
1
Department of Computer Science, National Tsing Hua University, Hsinchu, Taiwan
2
Computational Intelligence Technology Center, Industrial Technology Research Institute, Hsinchu, Taiwan
3
Department of Computer Science and Information Engineering, Asia University, Taichung, Taiwan
Keywords: Data Mining, Air Pollution Indicators, Cancer Statistics, Data Driven, Data-as-a-Service (DaaS).
Abstract: According to the report on global health risks, published by World Health Organization, environmental
issues are urged to be dealt with in the world. Especially, air pollution causes great damage to human health.
In this work, we build a framework for finding the correlations between air pollution and cancer diseases.
This framework consists of a data access flow and a data analytics flow. The data access flow is designed to
process raw data and to make the data able to be accessed by APIs. The cancer statistics is then mapped to
air pollution data through temporal and spatial information. The analytics flow is used to find insights,
based on the data exploration and data classification methods. The data exploration methods use statistics,
clustering, and a series of mining techniques to interpret data. Then, the data mining methods are applied to
find the relationships between air quality and cancer diseases by viewing air pollution indicators and cancer
statistics as features and labels, respectively. The experiment results show that NO and NO
2
air pollutants
have a significant influence on the breast cancer, and the lung cancer is significantly influenced by NO
2
, NO,
PM
10
and O
3
, which are consistent with those from traditional statistical methods. Moreover, our results also
cover the research results from several other studies. The proposed framework is flexible and can be applied
to other applications with spatiotemporal data.
1 INTRODUCTION
Rapid development of industry has caused serious
environmental damage since the Industrial Revolu-
tion. Air pollution is the biggest environmental issue
of the world, which we must urgently face (Pope III,
2016) (W.H.O., 2009). According to the report on
global health risks, published by World Health Or-
ganization, air pollution is the 14th biggest health
risk in terms of global deaths (W.H.O, 2014). In
Taiwan, air quality has been getting worse. The
Environmental Protection Administration (EPA) of
Taiwan conducted a survey on the perceptions of the
environment and found out that air pollution is per-
ceived as the most serious environmental problem
among Taiwanese people. There are many latent
effects of air pollution on health, ranging from mi-
nute physiological changes to slight symptoms and
to more obvious diseases. For example, the condi-
tions of patients with chronic respiratory diseases
will worsen when they breathe in air pollutants.
With the release of open data (Delen, 2009), people
will no longer be hindered by inadequate infor-
mation and the limited right of access in conducting
analysis and developing relevant applications. The
open data of air pollution indicators and cancer sta-
tistics from the EPA and the Ministry of Health and
Welfare (MHW) in Taiwan are analysed in this work.
We build a framework for data collection and insight
finding to investigate the influence of air pollution
on cancers. Our framework consists of a data access
flow and an analytics flow. The data access flow is
used to convert raw data into Object Relational
Mapping (ORM) objects and release the data using
the standard Web APIs to improve data accessibility.
The analytics flow is composed of the steps of data
access, data exploration, and data mining. The step
of date access is to get raw data by APIs. Then, the
characteristics of the data are explored in the phase
of data exploration, followed by the phase of data
mining to discover knowledge and to find rules. The
rules indicate which air pollution indicators are re-
lated to which cancers. A number of rules identified
are consistent with the results generated by the
Chang, W., Wang, E. and Chen, A.
A Data-driven Framework on Mining Relationships between Air Quality and Cancer Diseases.
DOI: 10.5220/0006471902550262
In Proceedings of the 6th International Conference on Data Science, Technology and Applications (DATA 2017), pages 255-262
ISBN: 978-989-758-255-4
Copyright © 2017 by SCITEPRESS – Science and Technology Publications, Lda. All rights reserved
255
statistical methods in the existing studies.
The remainder of the paper is organized as fol-
lows. The related works are reviewed in Section 2.
Section 3 introduces the framework and the analytics
flow. The analytics flow is composed of three stages
including data access, data exploration, and data
mining, to be detailed in Sections 4, 5, and 6, respec-
tively. Finally, Section 7 concludes this work.
2 RELATED WORK
Air pollution influences human health and destructs
environment. Many governments have established
air quality monitoring stations in many areas to
collect air pollution data for analysis. Sahafizadeh
and Ahmadi predicted air pollution using data min-
ing techniques with the Boushehr data (Sahafizadeh
and Ahmadi, 2009). They employed decision tree to
predict the trend of air pollution based on various
features such as atmospheric pressure and humidity.
Hsieh et al. inferred real-time air quality of various
locations given environmental data and the data
from very sparse monitoring locations (Hsieh et al.,
2015).
Payus et al. integrated health data with an air
quality database, and analysed data using a straight-
forward mining method (Payus et al., 2013). Dicken
et al. applied clustering and classification methods to
study air pollution. They employed data driven
method to examine NIDCH disease data as well as
local air pollution data acquired from Dhaka, Bang-
ladesh, in an attempt to find out the correlation be-
tween air pollutants and the number of inpatients
admitted into local hospitals. The reasons behind the
increase/decrease of the number of inpatients were
further analysed in (Dicken et al., 2015). K-means
clustering algorithms were employed to analyse air
pollutants in different seasons while the inpatients
admitted into hospitals were classified using CART.
Moreover, environmental streaming data were col-
lected using heterogeneous sensors while events
were detected using the association rule mining
method as well as classification method. Dao and
Zettsu predicted the occurrence of asthma based on
the environmental monitoring data (Dao and Zettsu,
2016).
3 FRAMEWORK AND
ANALYTICS FLOW
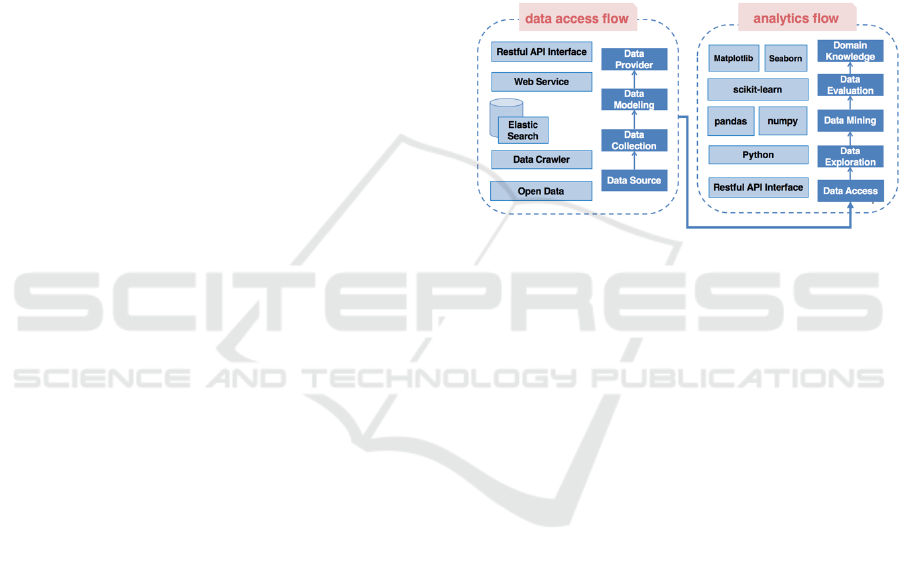
As shown in Figure 1, the framework is made up of
data access flow and analytics flow. The data access
flow refers to a procedure in which data are pro-
cessed for the purpose of Data-as-a-Service (DaaS).
Data are analysed in four steps based on the analyt-
ics flow, including the steps of data access, data
exploration, data mining, and data evaluation based
on the data driven strategy. We use open-source
tools and libraries to implement the solutions for
open data analysis.
Figure 1: The flows of data access and analytics.
Since open data are published in different formats
and by different agencies, much time is often needed
to do the data pre-processing. The data access flow
is used to describe how raw data are converted into
Object Relational Mapping (ORM) objects and then
released by using the standard RESTFul APIs for
improving data accessibility and realizing data-as-a-
service, therefore allowing data to be repeatedly and
conveniently used.
The analytics flow comprises a series of steps, in-
cluding data access, data exploration, data mining,
and data evaluation. The step of data access is to call
APIs to get the data for analysis from DaaS to be
detailed in Section 4. In the step of data exploration,
the characteristics of data are explored and then used
to make up the absence of professional backgrounds.
The data are interpreted by a data driven method
which is effective for data scientists without domain
knowledge. Then, the data mining methods extract
rules from data. Finally, experts with domain
knowledge and expertise are introduced to evaluate
the results. All steps in the analytics flow are ex-
plained and discussed in Sections 4, 5, and 6.
DATA 2017 - 6th International Conference on Data Science, Technology and Applications
256

4 DATA ACCESS
The step of date access refers to a procedure in
which raw data are collected and then processed to
be ready for analysis. This procedure is divided into
three parts: data-as-a-service, data description, and
data pre-processing to be discussed in the following.
4.1 Data-as-a-Service (DaaS)
Many government agencies have released enormous
data for public use, so called open data. However,
some of these open data are not easy to use due to
their formats or access methods. A successful analy-
sis relies on the quantity of usable data. The more
the usable data are, the better the research quality
may be. Moreover, with a reliable architecture, raw
data can be processed easily and data availability
can be upgraded to 5-star level or higher (Bertot et al,
2010). Therefore, the data access flow, shown in
Figure 1 and divided into three parts including data
collection, data modeling, and data provider, is
proposed to ensure that the data sources are availa-
ble for analysis.
The first issue of interdisciplinary data analysis
is to deal with different data sources and convert the
collected data into a consistent format. In this paper,
we collect open data from web pages by crawlers,
originally with a low level of usability. The open
data are then repackaged using object-oriented
methods in an attempt to convert the data into ob-
jects within a specific timeframe and space. For this
purpose, Object-Relational Mapping (ORM) tech-
nique is employed. ORM is a data abstraction tech-
nique designed to map database contents into object-
oriented data, thus allowing developers to manipu-
late the database simply by manipulating objects
without using SQL syntax. In other words, develop-
ers may write access logic using the same syntax
regardless of the lower-layer database systems. Ap-
parently, ORM sets data access logic free from low-
er-layer database systems and thereby minimizes the
coupling relationship between development and the
database, allowing data access architecture to be
more flexible.
With the ORM technique, object-oriented data can
be packaged easily and the data can be accessed
flexibly. In an effort to enhance the benefits associ-
ated with the ORM technique, the API access inter-
face has to be implemented. The API interface is
designed in compliance with RESTFul standard
specifications, thus allowing users to manipulate the
data using the HTTP protocol. Once the API access
interface is implemented, all remote hosts are al-
lowed to manipulate the data. Apparently, all re-
searchers and developers benefit from the API ac-
cess interface. The API access interface allows them
to concentrate on the data analysis and applications
without worrying about the problems related to data
processing. This work releases the procedure and
open data access interface to the general public,
allowing all researchers to access the data effortless-
ly through the Web API.
4.2 Data Description
This subsection introduces the datasets, followed by
an overview of the analysis methods.
4.2.1 Air Quality Monitoring Data
The EPA established 77 air quality monitoring sta-
tions across Taiwan in an attempt to monitor the air
quality all over Taiwan, and broadcast warning no-
tices accordingly. The Pollutant Standards Index
(PSI) is calculated using the monitoring data ob-
tained from major pollution sources to convert air
densities into various pollutants’ vice-values. After
that, the data were transformed and released through
API. The monitoring stations have been established
for nearly 20 years and the monitoring data released
by all monitoring stations have been collected by
this study, including all major pollution sources and
monitoring data across Taiwan.
Table 1: Schema for air quality monitoring data.
Attribute
Range
station
77 cities in Taiwan
time
1979 – 2014
Attribute
Unit
Normal Scale
Mean
CO
ppm
0.47 - 0.83
0.71
PM
10
μg/m3
46-86
67.96
NO
ppb
3.84-11.55
10.81
NO
2
ppb
15.7-28.41
22.62
NO
x
ppb
20.07-39.4
33.47
SO
2
ppb
3.3-6.7
7.06
O
3
ppb
19.6-30.5
25.44
4.2.2 Cancer Occurrence Statistical Data
According to the report of catastrophic illness pub-
lished by the MHW of Taiwan, cancer is one of the
major diseases in Taiwan. Cancer refers to the pro-
liferation of abnormal cells in human body. The
abnormal cells grow so fast that the normal organs
are jeopardized, resulting in hemorrhages, pains, and
functional incapacitation. Cancer has ranked the top
of the ten major causes of death for a long time, and
has imposed a far-reaching influence on health. This
study has collected the statistical data released by
A Data-driven Framework on Mining Relationships between Air Quality and Cancer Diseases
257

the MHW over the past 30 years, including the oc-
currence rates and mortality rates of ten major can-
cers. In the next section, the data driven method is
introduced so as to make up for the inadequate
knowledge in cross domain data analysis and to
discover knowledge using data mining methods.
Table 2: Schema of cancer occurrence statistical data.
Attribute
Range
city
21 cities in Taiwan
area
373 districts in Taiwan
time
1979 – 2012
Attribute
Unit
Scale
Mean
Lung Cancer
Standardized
Incidence
Rate
(%)
29.30-58.50
44.48
Liver Cancer
26.35-42.80
34.85
Colorectal Cancer
26-46.46
37.48
Breast Cancer
23-35.07
29.25
Oral Cancer
19.62-27.11
19.68
Prostate Cancer
8.64-21.27
15.79
Gastric Cancer
10.25-16.34
13.45
Pancreatic Cancer
11.6-26.28
19.64
Esophagus Cancer
4.92-10.9
8.63
Cervix Cancer
4.41-10.77
8.11
4.3 Data Pre-processing
The interdisciplinary data analysis involves an effec-
tive integration of various datasets (Fotopoulou et
al., 2016). Data integration refers to the connection
between the datasets located in similar geographic
areas and occurring in the same period of time. It is
necessary to convert geographic areas into coordi-
nates in order to integrate the data located in similar
geographic areas.
In view of the implementation, the raw data do
not have the coordinate field. It is necessary to im-
port external resources such as NGIS or Google
Maps to convert the address into coordinates using
Geopy Additionally. How to transfer different dis-
eases to the corresponding monitoring stations is an
important work that has to be contemplated. This
study uses the K-d tree structure to minimize the
time complexity when searching for correspondence
(Bentley, 1975). First, the points representing air
quality monitoring data are built up as a K-d tree.
Then, we select one point from the cancer occur-
rence statistical data to query the nearest point as
shown in Figure 2. The different diseases can corre-
spond to the nearest monitoring stations in the valid
coverage based on the K-d tree. In general, an air
monitoring station has a 25km valid coverage (Wen,
2003).
Figure 2: Data integration.
5 DATA EXPLORATION
5.1 Statistical Analysis
The first method of data exploration is learning
about the data preliminarily using simple statistics
and observations. Statistics includes descriptive
statistics and inferential statistics. Descriptive statis-
tics is employed in this work because it has better
intuition and interpretability. In descriptive statistics,
data are processed and categorized to describe and
summarize the characteristics of data as well as the
relationships between variables.
5.2 Row-wise Analysis
Row-wise analysis is designed to observe the trans-
verse relationships between data using clustering
techniques. Clustering methods are used to gather
similar data into a cluster as shown in Figure 3.
The Clustering Method. As soon as data access
procedure is completed, data could be easily ac-
cessed through Web API. The data formats are
shown in the following table in which each row of
data represents the data in an area, including the
monitoring station’s location, time, and various
values related to air pollutions. Firstly, the transverse
data, or the data in different areas, are clustered so
that all row data with similar properties are grouped
into a cluster. In other words, the locations with
similar indices of air pollutions are grouped into the
same cluster.
The Clustering Representation. Upon the comple-
tion of the clustering procedure, the compositions of
a cluster are analysed, followed by the discussion of
the clustering representation. However, it is not easy
to observe the data characteristics contained in the
cluster.
DATA 2017 - 6th International Conference on Data Science, Technology and Applications
258

Figure 3: Row-wise analysis.
5.3 Column-wise Analysis
Column-wise analysis is designed to observe the
longitudinal relationships or the relationships among
attributes. The correlation coefficient is employed to
calculate the correlation between attributes. In short,
the relationship between different attributes is ob-
served by comparing the correlation between attrib-
utes as shown in Figure 4.
Cancer Occurrence Statistical Data. As shown in
Figure 4, all attributes in all locations are serialized
to acquire the data related to every attribute in every
location within a certain timeframe. Each series
indicates the changes of every attribute in the same
location for the period.
Correlation. The correlation coefficient is em-
ployed to calculate the correlation between different
attributes. Next, the correlation between any two
time-series is calculated using the correlation coeffi-
cient.
Figure 4: Column-wise analysis.
5.4 Results and Observations
5.4.1 Statistical Analysis
Figure 5 shows different pollutant statuses in indi-
vidual cities and Figure 6 shows different pollutant
statuses with different cancers.
Figure 5: Statistical analysis: the status of air pollution in
2012.
Figure 6: Statistical analysis: the status of air pollution and
cancer in Taipei from 1992 to 2012.
5.4.2 Row-wise Analysis
We conduct the experiment of the row-wise analysis
as follows. To start with, the data are divided into
two parts, air pollution and cancer occurrence, and
then grouping these data by a cluster algorithm. If
the ground truth labels are not known, the evaluation
must be performed using the model itself such as the
Silhouette Coefficient, where a higher Silhouette
Coefficient score relates to a model with better de-
fined clusters (Rousseeuw, 1987).
Silhouette Coefficient score is bounded between
-1 for incorrect clustering and +1 for highly dense
clustering. Scores around zero indicate overlapping
clusters. The score is higher when clusters are dense
and well separated, which relates to a standard con-
cept of a cluster. The results in Table 3 indicate that:
1) when all of the air quality indicators were used as
a feature, the value of Silhouette Coefficients
reached a certain level and could be grouped in clus-
ters, 2) when all of the statistical values of cancerous
cases were used as a feature, the value of Silhouette
A Data-driven Framework on Mining Relationships between Air Quality and Cancer Diseases
259
Coefficients did not reach a certain level and the
data could not be effectively grouped and clustered,
and 3) when individual statistical values of cancer-
ous cases were used as a feature, we obtained many
remarkable results and concluded that individual
data could produce data clustering effect. Different
cancers were divided into clusters using different
methods. Thus, putting them all together would
cause confusion and a failure of grouping. For in-
stance, one cancer was mainly affected by demo-
graphical factors, while another cancer was decided
by economic structural problems. When taking these
two into consideration simultaneously, cross-
influence effects might happen and cause grouping
errors.
Table 3: Silhouette Coefficient.
Silhouette Coefficient with N clusters for Air pollution
N
20
60
120
360
600
1200
Score
0.33
0.35
0.37
0.49
0.62
0.68
Silhouette Coefficient with N clusters for All Cancers
N
3
6
9
12
18
20
Score
0.21
0.10
0.07
0.10
0.09
0.07
Silhouette Coefficient with N clusters for Lung Cancer
N
20
60
120
360
600
1200
Score
0.51
0.51
0.50
0.49
0.52
0.54
Silhouette Coefficient with N clusters for Cervix Cancer
N
20
60
120
360
600
1200
Score
0.51
0.51
0.50
0.50
0.552
0.55
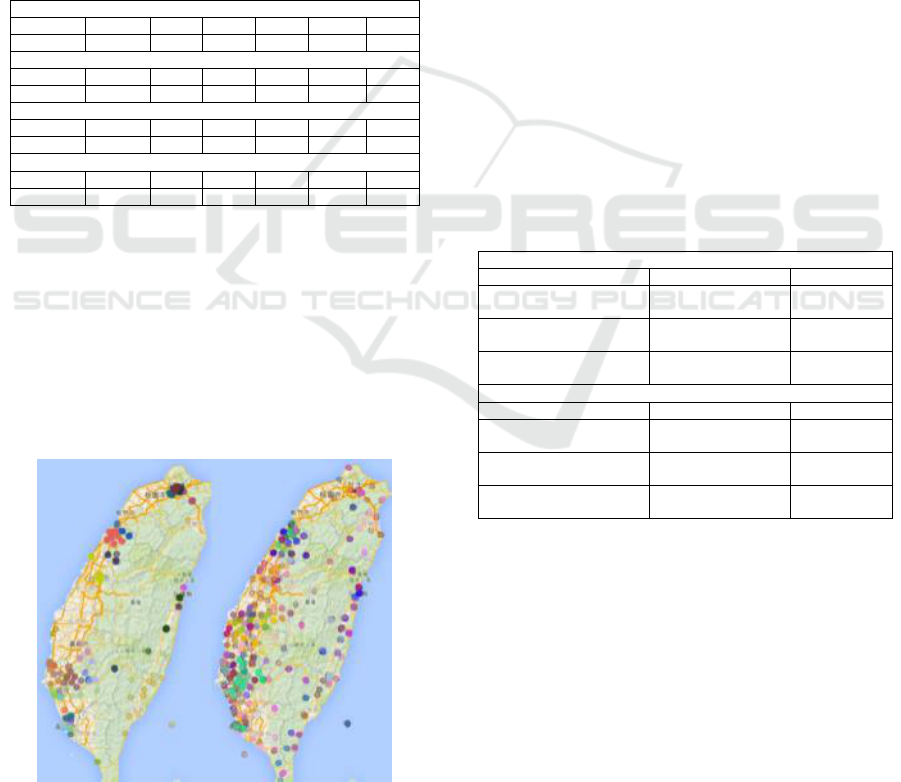
Figure 7 shows how certain cancers were distributed
in certain geographical areas in Taiwan (left figure)
and how air pollution played a part in it (right fig-
ure). The same signs are meant for clustering of the
same type. The results indicate that clustering effects
in the geographic and temporal dimensions can be
spotted in the data. However, these observations are
not necessarily the cause of the overall condition. In
other words, data exploration can only help us better
comprehend the data without rushing to conclusions.
Figure 7: Visualization on Google Map: clusters for all air
pollutant indicators (left) and lung cancer statistics data
(right).
5.4.3 Column-Wise Analysis
Through the exploration into the column-wise analy-
sis, we discussed the correlations among attributes
via an observation of sequential correlation coeffi-
cients. A sequence should be viewed as the changing
process of an attribute in time. In this work. Pearson
product-moment correlation coefficient is used for
the measure of the linear correlation between two
variables, giving a value between +1 and −1 inclu-
sive, where 1 is total positive correlation, 0 is no
correlation, and −1 is total negative correlation.
However, correlation is not sufficient to demonstrate
the presence of such a causal relationship (i.e., corre-
lation does not imply causation).
Table 4 reveals how Lung Cancer or Cervix
Cancer was associated with air pollution in certain
areas. Disparate results were discovered in the Lung
Cancer case, suggesting Lung Cancer was associated
with different air pollutants in a different way. In
addition, obvious differences can be found in the
results from Lung Cancer and Cervix Cancer, imply-
ing not all cancers are highly relevant to air pollution.
For the sake of observation, we purposely chose the
same area. Cross-area observations, however, are
also worth discussing.
Table 4: Correlation on cancer series.
Correlation on All series as Lung Cancer
Series1
Series2
Correlation
South District, Tainan - Lung
Cancer
South District, Tainan -
NO
0.7878
South District, Tainan - Lung
Cancer
South District, Tainan -
NO
0.7793
South District, Tainan - Lung
Cancer
South District, Tainan -
PM
10
0.7573
Correlation on All series as Cervix Cancer
Series1
Series2
Correlation
South District, Tainan -
Cervix Cancer
South District, Tainan –
O
3
0.4652
South District, Tainan -
Cervix Cancer
South District, Tainan -
NO
x
0.4470
South District, Tainan -
Cervix Cancer
South District, Tainan -
PM
10
0.4327
6 DATA MINING
Data mining techniques are used to figure out the
implications hidden behind the data. The models are
constructed to interpret the data. We employ classi-
fication in data mining for the following two pur-
poses: 1) describing why the model is constructed
and explaining data characteristics as well as its
applications, and 2) predicting the trend of data
based on the data models. As stated in Section 5,
various air pollutants resulted in diseases. In this
section, classification techniques are employed to
DATA 2017 - 6th International Conference on Data Science, Technology and Applications
260

analyse the influence on the disease imposed by air
pollutants. After that, the influences on all diseases
related to air pollutions are summed up. Lastly, the
results are presented.
6.1 Classification
Classification. Firstly, the influence on the disease
imposed by air pollutants has to be identified. For
this purpose, health information is classified using
classification models in accordance with the pollu-
tions in all geographic areas. A classifier is trained
for each disease and all classifiers are compared
through experiments in order to find out the rational-
ity of the classifiers.
Applications. Most importantly, the results will be
able to develop more applications, such as summary
of influences or geographic visualization. For exam-
ple, the results can sum up the influences on each
disease and find out the influence on health imposed
by air pollutions. The health risks can be fitted into
maps using geographic information, allowing users
to easily find out the difference in health risks be-
tween different geographic areas.
6.2 Results and Evaluation
Table 5: Accuracy score.
Accuracy Score of RandomForestClassifier as two types
N
1200
6000
12000
18000
64000
Breast Cancer
0.75
0.72
0.70
0.65
0.63
Lung Cancer
0.74
0.76
0.65
0.68
0.64
Cervix Cancer
0.52
0.57
0.60
0.56
0.61
Accuracy Score of RandomForestClassifier as three types
N
1200
6000
12000
18000
64000
Breast Cancer
0.70
0.54
0.61
0.62
0.6
Lung Cancer
0.81
0.67
0.56
0.65
0.56
Cervix Cancer
0.50
0.46
0.44
0.50
0.47
Result. Table 5 shows two types of labels: 1) divid-
ing the cancer occurrence into two types of high and
low based on the mean; 2) dividing the cancer occur-
rence into three types of high, medium and low
based on quartile. The results indicate that different
diseases incur different results in both tables, regard-
less of the algorithms used. A stronger separability
can be found in breast cancer and lung cancer than
uterine cancer, which might be evidence for a closer
correlation between the former two diseases and the
properties of the air pollutants. The result is im-
proved by dividing the value of cancer occurrence
into more types.
We discovered the level of impact of various at-
tributes using classification algorithms. Take the tree-
based classification algorithms as an example. The
importance of a feature is computed as the total re-
duction of the criterion brought by that feature. In the
table below, similar results are produced by a differ-
ent classification method. We consider that these
common results for the specific cancer are significant.
Table 6: Importance of features for breast cancer and lung
cancer.
Importance
Classifier
Breast Cancer
Lung Cancer
LogisticRegression
NO, O
3
, NO
2
O
3
, PM
10
, NO
2
, NO
SVC
NO
2
, NO
NO
2
, NO, O
3
, PM
10
Ensemble method
NO
2
, NO
NO
2
, NO, PM
10
, O
3
Evaluation. In our work, the occurrence of breast
cancer is affected by NO
2
and NO. In the past re-
search, the relationship was also found. A link be-
tween post-menopausal breast cancer and exposure
to nitrogen dioxide was found in (Crouse et al., 2010;
Hystad et al., 2013). It found out that women living
in the areas with the highest levels of pollution were
almost twice as likely to develop breast cancer as
those living in the least polluted areas. These results
can be used to strengthen the monitoring of air pol-
lutant emissions. It also provides medical institutions
for breast cancer awareness advocacy to enhance
people's knowledge on risk factors for breast cancer.
The occurrence of lung cancer is effected by NO
2
,
NO, PM
10
and O
3
, found in our results. The results
are also consistent with the past studies. In a study,
lung cancer incidence was increased most strongly
with NO
2
exposure (Hystad et al., 2015). Further
investigation is needed into possible effects of O
3
on
the development of lung cancer. Another study
aimed to assess the association between long-term
exposure to ambient air pollution and lung cancer
incidence (Raaschou-Nielsen et al., 2013).
Summing up the above literature, the results in the
cases of lung cancer or breast cancer are consistent
with ours. We also compare the results for lung
cancer and breast cancer to see that lung cancer has
a more extensive relationship to air pollution than
breast cancer. From the comparison of the results
from different classifiers, we can see that some fea-
tures are considered more important in the different
classifiers.
7 CONCLUSION
This study uses environmental pollution factors and
health statistic reports to establish a set of health risk
analysis processes in order to investigate the influ-
ence of air pollution on diseases. More specifically,
we focus on the air pollution indicators in conjunc-
tion with the cancer statistics data. The proposed
A Data-driven Framework on Mining Relationships between Air Quality and Cancer Diseases
261

framework consists of the data access and analytics
flows. The data access flow is to improve the availa-
bility of open data, while the analytics flow is to find
insights. A number of existing studies are reviewed
and the results generated by our analysis framework
are compared with those from traditional statistical
methods. Moreover, our results also cover the re-
search results from several other studies. The pro-
posed framework shows a more general approach
than the traditional statistical methods, and can be
applied to the other applications with spatiotemporal
data.
REFERENCES
Bentley, J.L., 1975. Multidimensional binary search trees
used for associative searching. Communications of the
ACM, 18(9), pp.509-517.
Bertot, J.C., Jaeger, P.T. and Grimes, J.M., 2010. Using
ICTs to create a culture of transparency: E-
government and social media as openness and anti-
corruption tools for societies. Government information
quarterly, 27(3), pp.264-271.
Crouse, D.L., Goldberg, M.S., Ross, N.A., Chen, H. and
Labrèche, F., 2010. Postmenopausal breast cancer is
associated with exposure to traffic-related air pollution
in Montreal, Canada: a case-control study. Environ-
mental health perspectives, 118(11), p.1578.
Dao, M.S. and Zettsu, K., 2015. Discovering Environmen-
tal Impacts on Public Health Using Heterogeneous Big
Sensory Data. In Proceedings of IEEE International
Congress on Big Data, pp. 741-744.
Delen, D., Fuller, C., McCann, C. and Ray, D., 2009.
Analysis of healthcare coverage: A data mining ap-
proach. Expert systems with applications, 36(2),
pp.995-1003.
Dicken, R.A., Rubby, S.M.F., Naz, S., Khaled, A.A.,
Rahman, S.A., Rahman, S. and Rahman, R.M., 2015.
Analysis and classification of respiratory health risks
with respect to air pollution levels. In Proceedings of
IEEE/ACIS International Conference on Software En-
gineering, Artificial Intelligence, Networking and Par-
allel/Distributed Computing, pp. 1-6.
Fotopoulou, E., Zafeiropoulos, A., Papaspyros, D.,
Hasapis, P., Tsiolis, G., Bouras, T., Mouzakitis, S. and
Zanetti, N., 2016. Linked data analytics in interdisci-
plinary studies: The health impact of air pollution in
urban areas. IEEE Access, 4, pp.149-164.
Hsieh, H.P., Lin, S.D. and Zheng, Y., 2015, August. Infer-
ring air quality for station location recommendation
based on urban big data. In Proceedings of ACM
SIGKDD International Conference on Knowledge
Discovery and Data Mining, pp. 437-446. ACM.
Hystad, P., Demers, P.A., Johnson, K.C., Carpiano, R.M.
and Brauer, M., 2013. Long-term residential exposure
to air pollution and lung cancer risk. Epidemiology,
24(5), pp.762-772.
Hystad, P., Villeneuve, P.J., Goldberg, M.S., Crouse, D.L.,
Johnson, K. and Canadian Cancer Registries Epidemi-
ology Research Group, 2015. Exposure to traffic-
related air pollution and the risk of developing breast
cancer among women in eight Canadian provinces: a
case–control study. Environment International, 74,
pp.240-248.
Payus, C., Sulaiman, N., Shahani, M. and Bakar, A.A.,
2013. Association rules of data mining application for
respiratory illness by air pollution database. Int J Basic
Appl Sci, 13(3), pp.11-16.
Pope III, C.A. and Dockery, D.W., 2006. Health effects of
fine particulate air pollution: lines that connect. Jour-
nal of the air & waste management association, 56(6),
pp.709-742.
Raaschou-Nielsen, O., Andersen, Z.J., Beelen, R., Samoli,
E., Stafoggia, M., Weinmayr, G., Hoffmann, B.,
Fischer, P., Nieuwenhuijsen, M.J., Brunekreef, B. and
Xun, W.W., 2013. Air pollution and lung cancer inci-
dence in 17 European cohorts: prospective analyses
from the European Study of Cohorts for Air Pollution
Effects. The Lancet Oncology, 14(9), pp.813-822.
Rousseeuw, P.J., 1987. Silhouettes: a graphical aid to the
interpretation and validation of cluster analysis. Jour-
nal of Computational and Applied Mathematics, 20,
pp.53-65.
Sahafizadeh, E. and Ahmadi, E., 2009. Prediction of air
pollution of Boushehr city using data mining. In Pro-
ceedings of International Conference on Environmen-
tal and Computer Science, pp. 33-36.
World Health Organization, 2009. Global health risks:
mortality and burden of disease attributable to selected
major risks.
World Health Organization, 2014. Burden of disease from
household air pollution for 2012.
Wen, Y. W., 2003, Two-Phase Spatiotemporal Models for
Air Pollution and Health. PHD dissertation in Depart-
ment of Information Management at National
Chengchi University, Taiwan.
DATA 2017 - 6th International Conference on Data Science, Technology and Applications
262
