
EcoLogic: IoT Platform for Control of Carbon Emissions
Tsvetan Tsokov
1
and Dessislava Petrova-Antonova
2
1
Department of Information Technologies, Sofia University, Sofia, Bulgaria
2
Department of Software Engineering, Sofia University, Sofia, Bulgaria
Keywords: Clustering, Internet of Things, Reduction of Carbon Emissions, Sensor Data Processing.
Abstract: Today, the sensors and the Internet of Things (IoT) presence naturally in the people’s lives. Billions of
interactive devices exchange information about variety of objects in the physical world. The IoT
technologies affect the business processes of all major industries such as transportation, manufacturing,
healthcare, agriculture, etc. Despite the fact that the IoT has a positive impact to both people and industry, it
also provides benefits for the environment. The IoT is recognized as a powerful tool in the fight against
climate change. More specially, it has a significant potential in saving carbon emissions. Taking into
account the promising areas of IoT application, this paper proposes a solution for real-time monitoring of
vehicles and detection of rising levels of carbon emissions, called EcoLogic. The EcoLogic consists of
hardware module that collects sensor data related to vehicles’ carbon emissions and cloud based
applications for data processing, analysis and visualisation. Its primary purpose is to control the carbon
emissions through smart notifications and vehicle’s power limitations.
1 INTRODUCTION
Today, the Internet of Things (IoT) is incorporated
in people’s lives providing an ecosystem in which
applications and services are driven by data
collected from devices that interact with the physical
world. The IoT paradigm exists in everyday physical
objects responding to human’s motion, presence,
commands and physiological behaviour. It plays a
fundamental role in economic and social
development. The combination of network
connectivity, sensors, devices and people enable a
new way of conversation between persons and
machines as well as between software and hardware
systems. The growth of sophisticated data analysis
techniques inspired by the artificial intelligence and
machine learning allows devices to anticipate, react,
respond and enhance the physical world. Advanced
applications are developed to collect and process
large amounts of data generated by the IoT devices
in all economic sectors such as transportation,
agriculture, health and education. According to the
IoT forecast of the International Data Corporation 30
billion connected devices are expected in the market
by 2020 (MacGillivray, 2016). The economic value
of IoT is evaluated around 1.46 trillion (Turner,
2016). For the same time period Gartner expects
20.8 billion connected things and 3 trillion IoT
endpoint spending (Gartner, 2015).
One of the sectors that is most affected by the
IoT is automotive industry. IoT technologies enable
production of highly automated and connected
vehicles that will change the global automotive
market. Recently, tens of millions of cars are said to
be connected to the Internet and their number is
expected to become hundreds of millions in the near
future (Automotive IT-Kongress, 2015). At the same
time, mobile communication technology is
recognized to have considerable potential to enable
carbon emissions reduction across a variety of
applications in a wide range of sectors (Stephens,
Iglesias and Plotnek, 2015). According to Global e-
Sustainability Initiative, 70% of the carbon savings
currently being made come from the use of machine-
to-machine (M2M) technologies. The greater
savings comes from buildings (29%) and
transportation (28%). The survey data shows that
68% of smartphone users are willing to adopt
behaviours that could result in even more substantial
future reductions to personal carbon emissions. IoT
is pointed as a key lever to reduce the carbon
emissions in a statistic of A.T. Kearney (A.T.
Kearney, 2015). In particular, car sharing,
automotive telematics and smart home are the most
178
Tsokov, T. and Petrova-Antonova, D.
EcoLogic: IoT Platform for Control of Carbon Emissions.
DOI: 10.5220/0006462201780185
In Proceedings of the 12th International Conference on Software Technologies (ICSOFT 2017), pages 178-185
ISBN: 978-989-758-262-2
Copyright © 2017 by SCITEPRESS – Science and Technology Publications, Lda. All rights reserved
promising cases.
The current software solutions for tracking and
monitoring vehicles give evidence for the efforts of
using IoT technologies in automotive industry.
Geotab provides a service for monitoring and
analysis of vehicles using integrated hardware
module that sends data to private cloud platform.
The hardware module is directly connected to the
onboard diagnostic system of the vehicle and
collects data about fuel consumption, travelled
distance and other parameters (GO7, 2017). The
analysis provided by the cloud platform allows
identification of vehicles with suboptimal fuel
consumption (MyGeotab, 2017). Unfortunately,
Geotab solution does not provide control over
vehicle’s parameters and detect anomalies related to
increasing rate of carbon emissions. The data logger
of Madgetech provides functionality for regular
monitoring of carbon dioxide levels (Data Loggers).
It measures the carbon emissions in exhaust system
of vehicles and sends data to private cloud platform
through a wireless network. The measured data is
visualized by mobile application, but further analysis
are not supported. In addition, functionality for
control of the carbon emissions is not provided. The
CanTrack solution provides a system for real-time
GPS tracking of vehicles (CanTrack GPS). Its
Driver Behaviour Module support driver profiling
based on 5 key driving elements including driving
style, speeding and idling. The drivers are assisted to
avoid traffic delays, blocked roads and accidents
through real-time and directional traffic information.
After a collision has been detected system alerts are
generated in order to provide accurate location
information to emergency services if required. A
drawback of the CanTrack solution is that it works
only with GPS data and does not takes into account
the vehicle’s parameters related to carbon emissions.
Inspired by the low-carbon economy roadmap of
European commission and the grate opportunity
provided by the IoT technologies for reducing the
carbon emissions, this paper proposes a solution for
real-time monitoring of vehicles and detection of
rising levels of carbon emissions, called EcoLogic.
The proposed solution includes hardware module,
which collects sensor data related to vehicle’s
carbon emissions such as air pressure, air
temperature and fuel mixture and sends it to a cloud-
based application for further analysis. The results
from the analysis are used to control the carbon
emissions through smart notifications and vehicle’s
power limitations.
The rest of the paper is organized as follows.
Section 2 presents the architecture of EcoLogic,
while Section 3 describes its components. Section 4
shows a case study that validates the feasibility of
the proposed solution. Finally, section 5 concludes
the paper and gives directions for future work.
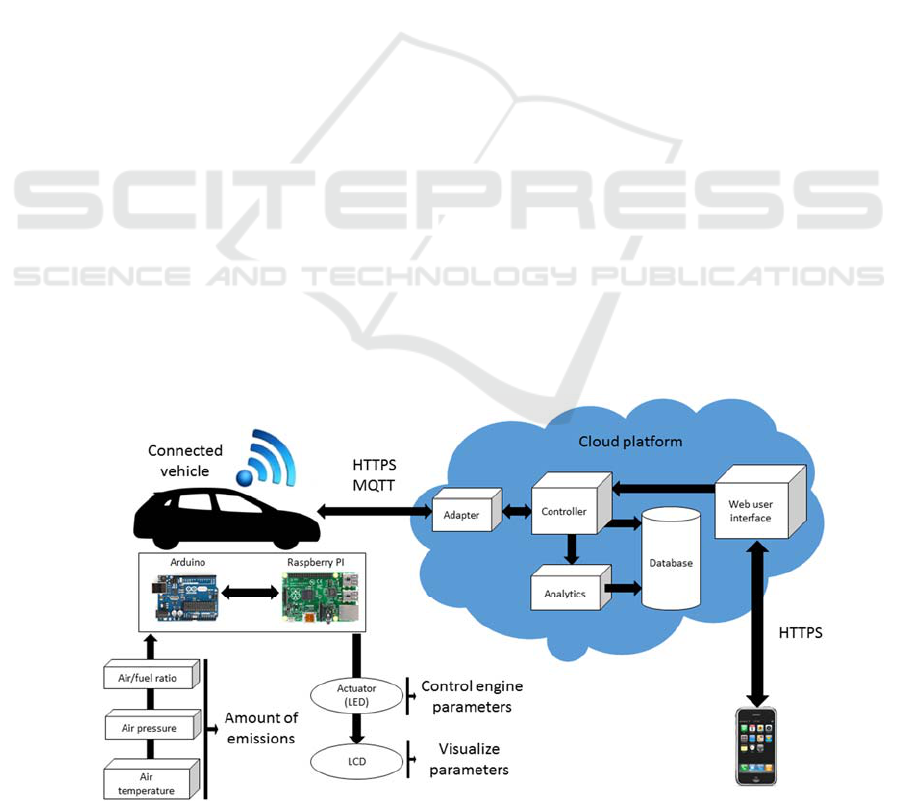
2 ECOLOGIC ARCHITECTURE
The EcoLogic is composed of hardware modules,
which are installed on vehicles and applications
providing services, which are deployed on a cloud
platform. Its architecture is shown in Figure 1.
Figure 1: EcoLogic general architecture.
EcoLogic: IoT Platform for Control of Carbon Emissions
179

The hardware module measures several physical
parameters by sensors or extracts them from the
onboard diagnostic system of the vehicle. The data is
sent to the cloud platform. The measured physical
parameters are:
Air/fuel ratio, which is measured by lambda
sonde sensor, which is located into the exhaust
system of the vehicle.
Absolute pressure of the air that is consumed
by the engine.
Temperature of the air that is consumed by
the engine.
The cloud applications are implemented as
microservices, which are designed in a platform
independent way in order to have the possibility for
deployment on different cloud platforms. The cloud
applications are communicating with a relational
database, which is provided by backing service from
the cloud platform. They process the incoming data,
store it into the database and analyse it. The
hardware modules communicate with the cloud
platform with wireless network via HTTPS or
MQTT protocols. The following physical parameters
are calculated on the base of the incoming sensor
data:
Mass of the consumed air by the engine;
Mass of the consumed fuel by the engine;
Mass of the carbon dioxide emissions,
exposed into the atmosphere.
All measured and calculated physical parameters
are stored in the database. A cloud-based Analytics
application performs an anomaly detection on the
streamed data by searching for vehicles that have not
optimal amount of carbon dioxide emissions or
system failures. The anomaly detection process is
based on clustering analysis. When some vehicle is
detected by the system as an anomaly, with not
optimal amount of emissions, the hardware module
is notified automatically by the cloud platform and
hardware actuator is activated to reduce the amount
of emissions. In this way the system monitors and
controls the amount of carbon dioxide emissions in
the atmosphere in real time. The hardware modules
are equipped with three actuators:
Liquid crystal display (LCD), which visualize
the measured and calculated physical
parameters to the driver.
Light-emitting diode (LED), which indicates
to the driver that the amount of carbon dioxide
emissions is not optimal or there is a system
failure (not optimal parameters).
Actuator, which controls the amount of
injected fuel in the engine and regulates the
amount of emissions.
Currently, the EcoLogic has only the display and
LED actuator. The purpose of the LED actuator is to
notify the driver to manually reduce the speed and
change the driving behaviour, which leads to
reduction of the amount of emissions.
The cloud platform provides web user interface,
which is a set of HTML5, JavaScript and CSS
resources. The web user interface is publicly
available and accessible by clients via HTTPS
protocol.
The user management of the system is composed
of two roles: driver and operator. The process flow
of the system is the following:
Driver buys a hardware module from a dealer.
The driver installs the hardware module into
vehicle.
The driver registers the vehicle with the
hardware module and sensors in the system.
All components have unique identification
numbers.
Drivers are authorized to monitor, analyze and
control their own registered vehicles.
Operators are authorized to monitor, analyze
and control all registered vehicles by regions.
Each driver gets score points proportional to
the amount of carbon dioxide emissions
exposed in the atmosphere by their vehicles.
Drivers can participate in greenhouse gas
trading and decrease pollution taxes with their
score points.
3 ECOLOGIC COMPONENTS
This section outlines the main components of
EcoLogic. First, the components of the hardware
module are presented. After, the cloud applications
are described.
3.1 Hardware Module
The hardware module is composed of two embedded
systems: Arduino Uno and Raspberry Pi B+. The
Arduino embedded system handles the low-level
hardware sensors and actuators in the vehicles, while
the Raspberry Pi embedded system works on higher
level and communicates with the cloud platform.
3.1.1 Arduino Embedded System
The Arduino Uno embedded system provides a
functionality to measure physical parameters,
visualize the measured parameters on 4x16 liquid
crystal display, control of actuator (light emitting
diode) and communication with Raspberry Pi
ICSOFT 2017 - 12th International Conference on Software Technologies
180
embedded system. The physical parameters are
measured by sensors or extracted from the onboard
diagnostic system (OBD2), which is provided by the
electronic control module of the vehicle. If the
vehicle provides the necessary parameters in the
onboard diagnostic interface, no additional sensors
will be installed. If the vehicle does not provide the
necessary parameters in the onboard diagnostic
interface, additional sensors, which measure these
parameters, will be installed. In this way the
hardware module is platform independent and can be
installed on different vehicles. The amount of carbon
dioxide emissions is calculated from the measured
physical parameters as follows.
The law of ideal gas (Clapeyron, 1834) is presented
with Equation 1.
,
(1)
where P is the absolute pressure of gas [Pa], V is the
volume of gas [m
3
], n is the amount of substance of
gas [mol], m is the mass of gas [kg], R
specific
is a
specific gas constant for dry air (287.058 J kg
−1
K
−1
)
and T is the temperature of gas [K].
The mass of the consumed air by the engine is
calculated by the ideal gas law as shown on
Equation 2.
(2)
The air fuel ratio (AFR) is calculated according to
Equation 3:
(3)
The mass of the consumed fuel by the engine is
calculated by the measured air/fuel ratio (AFR) as
follows:
(4)
The relation between mass of carbon dioxide
emissions and mass of consumed unleaded petrol
fuel is given on Equation 5 (Carbonfund, 2017).
1.73
(5)
The final equation of the mass of the carbon dioxide
emissions exposed into the atmosphere is calculated
according to Equation 6.
1.73
(6)
The application, which is deployed on the Arduino
embedded system, is implemented using C++
programming language and consumes the API
provided by the Wiring library, which is part of the
Arduino platform. The Wiring library communicates
with the appropriate microcontroller via drivers.
Currently, the Arduino Uno is used, which has
Microchip ATmega328 microcontroller with RISC
architecture.
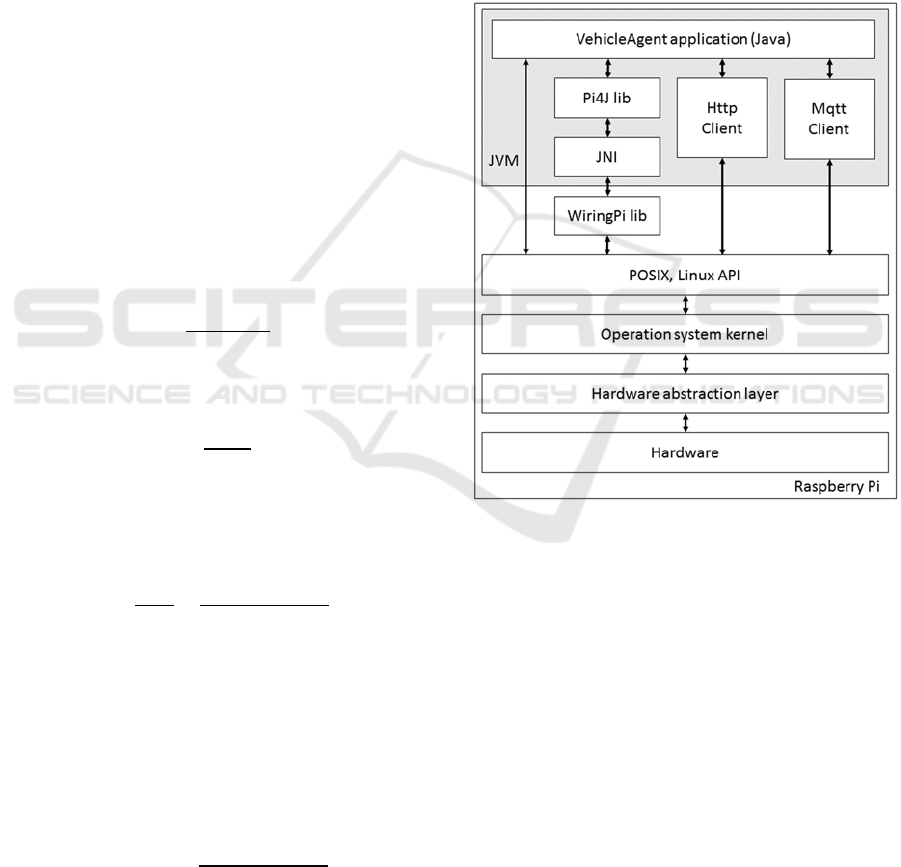
3.1.2 Raspberry Pi Embedded System
The Raspberry Pi B+ embedded system is a proxy
between the Arduino embedded system and the
cloud platform. Its architecture is shown in Figure 2.
Figure 2: Raspberry Pi Architecture.
The Raspberry Pi B+ embedded system
communicates with the Arduino embedded system
via serial communication (UART – Universal
Asynchronous Receiver/Transmitter) over a custom
protocol. It is connected to the cloud platform via
802.11n wireless network. The Raspberry Pi B+
embedded system consumes the measured physical
parameters by the Arduino embedded system, stores
the last data in a local storage for further processing
to the cloud platform. It sends the data to Adapter
application in the cloud platform via HTTPS or
MQTT protocol and receives response that contain
information about the state of the vehicle, including
the amount of the carbon dioxide emissions. The
state can be optimal (eco) or not optimal (not eco). If
the emissions are not optimal, the Raspberry Pi
module notifies the Arduino embedded system to
EcoLogic: IoT Platform for Control of Carbon Emissions
181

activate the hardware actuator in order to reduce the
amount of emissions. The Raspberry Pi embedded
system is composed of System on a Chip (SoC) with
ARM architecture and Linux based operation system
– Raspbian. VehicleAgent application is deployed on
it. The VehicleAgent application is implemented
using Java programming language and runs on Java
Virtual Machine.
The VehicleAgent application uses the Pi4J and
WiringPi libraries, which are used for implementing
the hardware serial communication between the
Raspberry Pi and Arduino embedded systems. The
wireless communication with the cloud platform is
provided by 802.11n WiFi adapter connected to one
of the USB ports of the Raspberry Pi. It can
communicate to the cloud platform via several
application layer protocols: HTTPS or MQTT,
depending on the supported protocol by the cloud
platform. The application has a modular architecture
and enables extension with other protocols. If the
wireless network is faulty and the communication to
the cloud platform is constrained, the application
stores the last data in the local storage. After
successful connection with the cloud platform, the
locally stored data is sent to the cloud platform. The
application consumes configuration file
(config.xml), which is located into the local file
system and contains identification strings for the
vehicle, sensors and type of the communication with
the cloud platform (HTTPS, MQTT). The
configuration file should be filled by the driver or by
operator, who registers the vehicle into the system.
3.2 Cloud Applications
The EcoLogic consists of several cloud applications,
namely Controller application, Adapters applications
and Web user interface.
3.2.1 Controller Application
The Controller application is the main cloud
application, which handles all vehicles with their
hardware modules with sensors, calculates data,
stores data into database, analyze the data and
provides HTTP REST API. It is implemented using
the Java Enterprise Edition programming language
on top of JPA and Apache CXF services framework.
The Controller application has the following
functionality:
Represents the data model by users, vehicles,
sensors and measurements. Each user has
vehicles, each vehicle has sensors, each sensor
has measurements of physical parameters.
Manages the lifecycle of all users, vehicles,
sensors and measurements.
Stores the data into relational database, which
is provided as a backing service by the cloud
platform. The application is platform
independent and can work with any relational
database, which provides Java connectivity.
The database contains four tables: User,
Vehicle, Sensor and Measurement.
Calculates the mass of the carbon dioxide
emissions exposed into the air by vehicles.
Handles the state of each vehicle: optimal
(eco) state and not optimal (not eco) state.
Communicates with Analytics application,
which make anomaly detection – vehicles
which have not optimal amount of carbon
dioxide emissions.
Exposes HTTP REST API which is consumed
by the Adapter applications and web user
interface.
3.2.2 Adapter Applications
The Adapter applications are cloud applications,
which adapt the data coming from the vehicle
hardware modules to the Controller cloud
application. They are implemented using the Java
programming language. There are two types of
Adapter applications that handle different types of
network protocols: ControllerAdapterHttps and
ControllerAdapterMqtt for HTTPS and MQTT
protocols respectively. ControllerAdapterMqtt
application communicates with MQTT broker. The
MQTT broker can be: Mosquitto, HiveMQ, Mosca
or other. The MQTT broker and the Adapter
applications have public URLs and can be accessed
by the vehicle hardware modules. The cloud
platform routes the traffic to the appropriate
application depending on the application layer
protocol that is used. In case of HTTPS traffic, the
cloud platform routes the traffic to the
ControllerAdapterHttps application. In case of
MQTT traffic, it routes the traffic to the MQTT
broker. This routing capabilities of the cloud
platform are based on TCP routing. TCP routing
enables cloud platforms to support applications,
which communicate with different non-HTTP
protocols. Cloud Foundry platform is an industry
standard cloud platform and it is a typical example
for platform, which uses TCP routing (Cloud
Foundry).
The lifecycle of the MQTT traffic is the
following: when a new vehicle is created, the
Controller application registers a topic with name
ICSOFT 2017 - 12th International Conference on Software Technologies
182

vehicles/{id}/sensors/{id}/measurements and
subscribes to the ControllerAdapterMqtt application
for that topic. The appropriate hardware module also
subscribes to that topic and publish measurements
related to it. The ControllerAddapterMqtt
application receives the measurements and sends
them to the Controller application, but via the HTTP
protocol. The response from the request contains
information whether the corresponding vehicle is in
optimal state or not. Finally, the
ControllerAddapterMqtt application publish the
state to the topic vehicles/{id}/state and the
appropriate vehicle is notified. In this way the
ControllerAddapterMqtt application adapts the data
from MQTT to HTTP and vice versa.
3.2.3 Web User Interface
The web user interface is provided by static
HTML5, JavaScript and CSS resources that are
served by a web server. The web resources contain
only front-end code without back-end functionality.
Most of the cloud platforms support serving of static
web resources. The web user interface in the
EcoLogic is implemented by the open-source
JavaScript-based front-end web application
framework OpenUI5 (OpenUI5). The web user
interface makes AJAX (Asynchronous JavaScript
and XML) calls to the HTTP REST API provided by
the Controller application. It provides public access
and it is used by the drivers and operators of the
system. The web user interface and the Controller
application have different domain names, which
means that they have different origins. Most of the
cloud platforms provide way for resolving the
problem of the same-origin policy (OpenUI5), which
states that one web application can access web
resources from the same origin or only permitted
web resources from different origin.
The web user interface has model-view-controller
architecture and provides the following
functionality:
Management of the lifecycle of the users,
vehicles, sensors and measurements: performs
create, read, update, and delete operations.
Visualization of all measured parameters and
historic data in real-time.
Manual control of the state of all vehicles,
which leads to control of the vehicle’s
actuator.
Automatic control of the state of the vehicles,
based on the amount of emissions or
parameters that are not optimal.
Static limitation of emissions for all vehicles,
which can be enabled or disabled.
Visualization of all anomalies (outliers) –
vehicles with not optimal emissions or
parameters.
3.2.4 Analytics Application
The Analytics application makes a clustering
analysis on the stored data by two parameters:
engine capacity of the vehicles and amount of
carbon dioxide emissions. In this way it places
vehicles that have adjacent engine capacity and
emissions amount in clusters and detects the vehicles
with anomalies. The analytics application uses K-
Means algorithm for clustering analysis, where the
number of clusters (K) is the number of engine
capacities of the registered vehicles. The application
is connected to the backing service with the
relational database.
4 CASE STUDY
In order to prove the feasibility of the EcoLogic
solution, a case study with two datasets is
performed. The goal of the cases study is to validate
the ability of EcoLogic to detect anomalies in the
vehicles’ behaviour related to increased carbon
dioxide emissions. One hardware module installed
on a real vehicle is used for the experiment. The
cloud platform and services that are configured for
the case study are as follows:
SAP Cloud platform for deployment of all
described cloud applications (SAP Cloud
platform).
HANA database – SAP cloud platform
provides backing service with HANA
relational database, which is used for storing
the data (SAP HANA database).
SAP cloud platform predictive service,
providing an algorithm for clustering analysis
and anomaly detection, which serves as
Analytics application (Morzaria, 2016).
4.1 Validation on a Dataset with
Known Anomalies
In order to validate the correctness of the anomaly
detection algorithm it should be tested with a test
dataset, which contains known anomalies. An
official test dataset is used for that purpose
(Mugglestone, 2014). It contains information for
customers with the following parameters: id, name,
lifespend, newspend, income and loyalty. The test
EcoLogic: IoT Platform for Control of Carbon Emissions
183
dataset contains 152 rows. The results from
application of the clustering analysis on the test
dataset are presented in Figure 3.
Figure 3: Clusters of Dataset with Known Anomalies.
The income of the customers is placed on the x-
axis. The loyalty of the customers is placed on the y-
axis. Two clusters (K1 and K2) and one anomaly
detection are obtained. The clusters define two types
of customers: customers with low income and low
loyalty and customers with high income and high
loyalty. The anomaly, marked in Figure 3 as Outlier,
corresponds to a data point, which is outlying from
the centres of the clusters K1 and K2.
4.2 Validation on a Real Dataset
The hardware module of the EcoLogic is integrated
into a real vehicle with internal combustion engine
that works on petrol and has a capacity of 1800
cubic centimetres. The collected real data for it is
extended proportionally with appropriate simulated
data in order to obtain bigger dataset. The final
dataset contains data for vehicles with different
engine capacities. The engine capacity measured in
cubic centimetres (cc) is placed on the x-axis. The
mass of the carbon dioxide emissions, measured in
milligrams (mg) is placed on the y-axis. The
obtained clusters after application of the clustering
algorithm are presented in Figure 4. The data points
corresponds to the vehicles, which have unique IDs.
Figure 4: Clusters of Real Dataset.
In the most preferable case, the clustering
algorithm should place vehicles, which have equal
engine capacity and different amount of emissions in
the same cluster. Thus, the vehicles, which have not
optimal emissions will not be placed in cluster and
should be detected as anomalies. For the current
dataset 8 clusters (K1-K8) are obtained. The
distance from the vehicle with ID 8759305 to the
nearest cluster K4 is 38 milligrams. The maximal
internal cluster distance in the cluster K4 is 18
milligrams. The distance from vehicles with IDs
6947228 and 5915180 to their nearest cluster K8 is
54 and 56 milligrams respectively. The maximal
internal cluster distance in cluster K8 is 24
milligrams. The anomalies are detected for the
vehicles with IDs 8759305, 6947228 and 5915180,
since the distance from them to their nearest clusters
is bigger than the internal cluster distance. These
vehicles don’t have optimal amount of carbon
dioxide emissions in contrast to the rest of the
vehicles, which are placed into clusters K1-K8. The
values of the anomalies are measured on cold engine
of the vehicle. The hardware modules successfully
notify the actuators for the detected anomalies.
5 CONCLUSIONS
The paper presents an IoT platform, called
EcoLogic, for real-time monitoring and control of
carbon dioxide emissions of vehicles with internal
combustion engines.
It has the following benefits:
High scalability, resilience and possibility to
work with big amounts of data due to cloud
computing model used.
Platform independence – possibility to work
with different vehicles and cloud platforms.
The hardware modules can work with variety
sensors or extract data from the onboard
diagnostic system of the vehicles. The
implemented cloud applications are
microservices, which can be deployed on
different cloud platforms.
Fully completed solution for monitoring and
control of vehicles’ carbon dioxide emissions,
which is ready for production usage to solve a
global problem such as reduction of the
carbon dioxide emissions in the atmosphere.
The following directions for further improvements
are identified during the validation on the real
dataset:
The measured parameters on cold engine are
not consistent with the measured parameters
ICSOFT 2017 - 12th International Conference on Software Technologies
184

on hot engine (with normal working
temperature). The detected anomalies are
obtained based on measurements on a cold
engine. The EcoLogic solution could be
optimized to split the data in two subsets: data,
which is taken on cold engine and data, which
is taken on normally working engine.
The data, which is taken from cold engine
could serve as a training dataset, which
defines not optimal amount of carbon dioxide
emissions.
Integration of new application protocols such
as CoAP, DDS and AMQP that can be used
by default.
Implementation of analytics functionality for
prediction of potential failures in vehicles,
based on the current and historical data.
Intergradation of EcoLogic with third party
systems and services such as emissions
trading systems, vehicle tax institutions and
smart cities systems. For example, the drivers
of the more ecological vehicles could get
bigger tax discounts. The traffic lights in
smart cities could be controlled depending on
the amount of carbon dioxide emissions
detected in a region. Adaptation mechanisms
for service selection based on criteria like
geographic location, price, load balancing, etc.
will be considered.
ACKNOWLEDGEMENTS
The authors acknowledge the financial support by
the National Scientific Fund, Bulgarian Ministry of
Education and Science within the project no. DN
02/11/2016 and project no. DFNI I02-2/2014, and by
the Scientific Fund of Sofia University within
project no. 80-10-192/24.04.2017.
REFERENCES
MacGillivray, C., 2016. Worldwide Internet of Things
Forecast Update. 2015-2019, International Data
Corporation (IDC).
Turner, V., 2016. The Internet of Things: Getting Ready to
Embrace Its Impact on the Digital Economy.
International Data Corporation (IDC), 2 March 2016,
Directions 2016: San Jose, CA.
Clapeyron, E. (1834). Mémoire sur la puissance motrice
de la chaleur. Journal de l'École Polytechnique (in
French).
Gartner, 2015. Gartner Says 6.4 Billion Connected
‘Things’ Will Be in Use in 2016, Up 30 Percent From
2015. Gartner website, 10 November 2015, Available
at: http://www.gartner.com/newsroom/id/3165317
(Accessed 8 Apr. 2017).
Automotive IT-Kongress 4.0, 2015, Available at:
http://www.t-systems.de/news-media/automotiveit-
kongress-industrie-4-0-veraendert-
automobilindustrie/1339486 [Accessed 4 Apr. 2017]
Stephens A., Iglesias M., Plotnek J., 2015. GeSI Mobile
Carbon Impact, Available at:
http://gesi.org/files/Reports/GeSI%20mobile%20carbo
n%20impact.pdf (Accessed 2 Apr. 2017).
A. T. Kearney, 2015. Internet of Things, a key lever to
reduce CO2 emissions, Available at:
http://www.atkearney.fr/documents/877508/879237/2
0151113_IoT+Impact+on+energy_Europe+EN.pdf/67
57111f-21da-49ee-82fd-915ff42dc26d (Accessed 6
Apr. 2017).
GO7. (2017). UK: Geotab.
MyGeotab. (2017). UK: Geotab.
Data Loggers. USA: Madgetech.
CanTrack GPS. UK: CanTrack Global Ltd.
Mugglestone Ph., (2014). SAP HANA Academy. Available
at: https://github.com/saphanaacademy/PAL/tree/
master/Source%20Data/PAL (Accessed 6 Feb. 2017).
OpenUI5. (2017). SAP SE.
Cloud Foundry. Enabling TCP Routing. Available at:
https://docs.cloudfoundry.org/adminguide/enabling-
tcp-routing.html.
SAP Cloud platform. (2017). SAP SE.
SAP HANA database. (2017). SAP SE.
Morzaria, A. (2016). Announcing “SAP HANA Cloud
Platform predictive services”. [Blog] SAP Blogs,
Available at: https://blogs.sap.com/2016/02/18/
announcing-sap-hana-cloud-platform-predictive-
services/ (Accessed 18 Feb. 2017).
Carbonfund. (2017). How we calculate. Available at:
http://www.carbonfund.org/how-we-calculate
(Accessed 12 Jan. 2017).
EcoLogic: IoT Platform for Control of Carbon Emissions
185
