
Evolutionary Type-2 Fuzzy Blood Gas Models for Artificially
Ventilated Patients in ICU
S. H. Indera-Putera and M. Mahfouf
Department of Automatic Control and Systems Engineering, The University of Sheffield, U.K.
Keywords: Type-2 Fuzzy Modelling, Optimization, Blood Gases.
Abstract: This paper proposes a new modelling and optimization architecture for improving the prediction accuracy of
arterial blood gases (ABG) in the SOPAVent model (Simulation of Patients under Artificial Ventilation). The
three ABG parameters monitored by SOPAVent are the partial arterial pressure of oxygen (PaO
2
), the partial
arterial pressure of carbon-dioxide (PaCO
2
) and the acid-base measurement (pH). SOPAVent normally
produces the initial ABG predictions and also the ABG predictions after any changes in ventilator settings are
made. Two of SOPAVent’s sub-models, namely the relative dead-space (Kd) and the carbon-dioxide
production (VCO
2
) were elicited using interval type-2 fuzzy logic system. These models were then tuned
using a new particle swarm optimization (nPSO) algorithm, via a single objective optimization approach. The
new SOPAVent model was then validated using real patient data from the Sheffield Royal Hallamshire
Hospital (UK). The performance of the new SOPAVent model was then compared with its previous version,
where Kd and VCO
2
were modeled using a neural-fuzzy system (ANFIS). For the initial ABG predictions,
significant improvements were observed in the mean absolute error (MAE) and correlation coefficient (R) for
PaCO
2
and pH. When the ventilator settings were changed, significant improvements were observed for the
prediction of pH and other improvements were also observed for the prediction of PaCO
2
.
1 INTRODUCTION
Mechanical ventilation is the main life support system
in the intensive care unit (ICU). Clinicians optimize
ventilator settings to ensure appropriate oxygenation
of patients, and at the same time, to prevent risks of
ventilator induced lung injuries. Changes in ventilator
settings can affect blood gas parameters in as-early-
as 30 minutes. However, arterial blood gases (ABG)
sampling is only carried out every several hours.
Sampling is also invasive and often cause discomfort
to patients. Therefore, a non-invasive, and automatic
ABG prediction tool is essential to assist clinicians
with optimal ventilator management strategy.
SOPAVent (Simulation of Patients under
Artificial Ventilation) (Figure1) is a mathematical
model that simulates the human respiratory system
under artificial ventilation. It was first developed by
Goode (2001). The objective of SOPAVent is to
predict ABG parameters of partial arterial pressure of
oxygen (PaO
2
), partial arterial pressure of carbon-
dioxide (PaCO
2
) and the acid-base measurement
(pH). SOPAvent is also integrated with neural-fuzzy
advisory models, which provide decision support for
ventilator settings as described by Kwok et al.,
(2004), Wang et al., (2010) and Mohamad-Samuri et
al., (2011). Inputs to the SOPAVent system consists
of routine ICU data as follows:
i) Ventilator settings and ventilator monitoring:
Positive-end expiratory pressure (PEEP),
respiratory rate (RR), inspiratory pressure (Pinsp),
minute volume (MV), inspiratory to expiratory
ratio (IE ratio), fraction of inspired oxygen (FiO
2
),
minute volume (MV) and tidal volume (Vt).
ii) ABG analyses: PaO
2
, PaCO
2
, pH and oxygen
saturation (SpO
2
), and,
iii) Patient’s physiological information: Height,
weight, blood pressure, airway pressure, body
temperature and end-tidal carbon-dioxide
production (EtCO
2
).
To accurately represent the human respiratory
system, SOPAVent also uses parameters that are not
regularly measured in the ICU. These parameters are
the relative dead-space (Kd), carbon-dioxide
production (VCO
2
), shunt, cardiac output (CO), and
oxygen consumption (VO
2
).
112
Indera-Putera, S. and Mahfouf, M.
Evolutionary Type-2 Fuzzy Blood Gas Models for Artificially Ventilated Patients in ICU.
DOI: 10.5220/0006434701120121
In Proceedings of the 14th International Conference on Informatics in Control, Automation and Robotics (ICINCO 2017) - Volume 1, pages 112-121
ISBN: 978-989-758-263-9
Copyright © 2017 by SCITEPRESS – Science and Technology Publications, Lda. All rights reserved

Figure 1: SOPAVent.
Several efforts have been devoted to the
modelling of VCO
2
and Kd. In SOPAVent v.1, Goode
(2001) tuned Kd so the predicted PaCO
2
matches the
measured PaCO
2
. VCO
2
was obtained using a
metabolic computer. In SOPAVent v.2, Kwok et al.,
(2004) proposed a fuzzy model for Kd. VCO
2
was
estimated using mean population. In SOPAVent v.3,
Wang et al., (2010) modelled Kd and VCO
2
using
artificial neural-fuzzy systems (ANFIS) and tuned the
models using a hybrid Levenberg-Marquardt and
back-propagation algorithm.
Indera-Putera et al., (2016) proposed a new
interval type-2 fuzzy logic system (IT2 FLS) for
modelling Kd and VCO
2
(Figure 2). Type-2 fuzzy
logic is an approach normally used in systems with
high levels of uncertainty. Type-2 membership
functions which are in itself fuzzy allows for a robust
and adaptable model suitable for handling complex
input-output relationships (Wu, 2012). An example of
an IT2 FLS fuzzy set is shown in Figure 3. Each
membership function is defined by a footprint of
uncertainty (FOU), which is the area between the
lower membership function (LMF) and upper
membership function (UMF).
Figure 2: Type-2 Fuzzy Logic System.
The IT2 FLS in this work employs a singleton
fuzzifier and a Takagi-Sugeno-Kang (TSK)
consequent rule-base. The outputs were calculated
using the Karnik-Mendel algorithm, as defined in Wu
and Mendel (2009). The inputs used for Kd are
PaCO
2
, RR, Vt, Pinsp and PEEP. A total of 44 fuzzy
rules were generated to map the inputs to Kd (Figures
4-5). The inputs used for VCO
2
model are Vt, MV and
EtCO
2
. A total of 27 fuzzy rules were generated to
map the inputs to VCO
2
(Figures 6-7).
Figure 3: Membership function for an internal type-2 fuzzy
logic system (Indera-Putera et al., 2016).
Inputs were selected using sensitivity analyses
described by Goode (2001) and Wang et al., (2010).
All membership functions (MFs) and rules were
manually tuned.
Figure 4: The IT2 FLS Kd model.
Figure 5: The IT2 FLS Kd model fuzzy set.
This paper proposes to optimize the Kd and VCO
2
models, and to validate their performances once these
are integrated in the latest version of SOPAVent,
SOPAVent v.4.
RR
Vt
Pinsp
Kd
IT2FLS
Kd
Model
PEEP
PaCO
2
Crisp
Inputs
Fuzzifier
Inference
Engine
Rulebase
Type
Reducer
Defuzzifier
Crisp Output
Evolutionary Type-2 Fuzzy Blood Gas Models for Artificially Ventilated Patients in ICU
113

Figure 6: The IT2 FLS VCO
2
models.
Figure 7: The IT2 FLS VCO
2
model fuzzy set.
2 OPTIMIZATION OF KD AND
VCO
2
MODELS
2.1 New Particle Swarm Optimization
Particle swarm optimization (PSO) mimics the
behaviour of flocking birds, also known as
“particles”. Each particle has knowledge of the best
location for resources through its own experience,
and shares this information with other particles in the
swarm. Each particle then adjusts its speed and
direction in order to get to that best location. This
optimal location is known as the “global best
solution”.
In this work, a new PSO algorithm (nPSO) by
Zhang et al., (2006) was used to further improve the
prediction accuracy by optimizing the output MFs of
Kd and VCO
2
models (Figure 8). The algorithm used
“momentum weight” which varies depending on the
particle’s current position and velocity. The
maximum velocity (V
max
) was used to contain the
particle within a specified search area as follows:
v
id
(t+1) = [w
id
(t+1)*r
1
*(t+1)v
maxi
] +
[c
1
*r
2
(t+1)*[p
id
(t) - x
id
(t)] +
(1)
c
2
*r
3
(t+1)*[p
gd
(t) - x
id
(t)]
x
id
(t+1) = x
id
(t) + v
id
(t+1)
(2)
1, if
V
i
(t)<Ɛ*V
max
and pos
id
(
t+1
)
=1;
w
id
(t+1) =
w
id
(t)*m
1
, If(notV
i
(t)) <
*V
max
and
f
(
X
i
(
t
)
>f
(
P
i
(
t-1
))
;
(3)
w
id
(t)*m
2
, if(notV
i
(t)<Ɛ*V
ma
x
)
and f(X
i
(t)<f(P
i
(t-
1))
m
1
<1 and m
2
>1
(4)
Here, i is particle number and d
is the dimension, v
id
is the velocity or change in particle position within its
search area, w is the momentum weight, r
1
, r
2
and r
3
are random variables between 0 and 1, V
max
is the
maximum velocity, x
id
is the particle position, c
1
and
c
2
are acceleration constants, m
1
and m
2
are scaling
parameters, Ɛ is a positive coefficient and pos
id
is a
discrete variable (0 or 1).
The objective of nPSO is to return the output
fuzzy set that produced the least mean squared error
(MSE) as the global best solution. The nPSO
dimension is determined by the number of output
MFs multiplied by two; each representing the LMF
and UMF of every MF in the fuzzy set.
The relative dead-space (Kd) with 44 output MFs
has a particle dimension of 88. The carbon-dioxide
production (VCO
2
) with 27 output MFs has a particle
dimension of 54. The fuzzy sets were tested on the
models until the maximum epoch is reached. The
nPSO algorithm then returned the fuzzy set with the
least MSE. The initialising parameters for nPSO are
shown in Table 1. An example of the nPSO
optimization result for Kd output MF is shown in
Table 2.
Table 1: nPSO Initialization.
Paramete
r
Value
c1, c2 1.8, 1.8
m1, m2 0.5, 2
dimensions 88, 54
V
xar
data ran
g
e
V
max
0.5V
xar
epoch 30
r1 [0, 1]
r2 [0, 1]
r3 [0, 1]
Vt
MV
EtCO
2
VCO
2
IT2FLS
VCO
2
Model
ICINCO 2017 - 14th International Conference on Informatics in Control, Automation and Robotics
114

MF = Membership Function, MSE = mean squared error
Figure 8: nPSO flowchart for MF selection.
Table 2: Optimization Result for Kd output MF.
Output
MF
Manually tuned MF nPSO Tuned MF
LMF UMF LMF UMF
Y1 6 36 11.95 26.76
Y2 11 41 1.94 56.03
Y3 6 36 6.30 31.59
… … … … …
… … … … …
Y42 19 49 27.92 47.64
Y43 25 55 23.86 49.23
Y44 33 63 28.57 62.57
2.2 Validation of Kd and VCO
2
Models
using Real Patient Data
The data used for validation of the optimization
algorithm was obtained from the Sheffield Royal
Hallamshire Hospital, United Kingdom and approved
by the Research Ethics Committee (Table 3 and 4). A
set of 447 data from 25 patients was available for Kd
modelling and a set of 764 data from 21 patients was
available for VCO2 modelling.
A set of 230 data was randomly selected for
optimization of Kd, and a set of 254 data was
randomly selected for optimization of VCO
2
. The
optimized Kd model was validated using 68 data from
13 patients and VCO
2
model was validated using 82
data from 5 patients. Results for Kd and VCO
2
predictions were then compared with the manually
tuned models.
Table 3: Kd Data Summary.
Parameter
Kd modelling data
mean s.d. min max
PaCO
2
(kPa) 5.72 1.10 3.82 10.1
RR (breath/min) 17.06 3.35 12 28
Vt (l) 0.52 0.12 0.29 0.88
Pinsp (cmH
2
O) 13.98 3.68 6 30
PEEP (cmH
2
O) 11.13 3.91 5 20
Kd 28.13 6.65 14 48
Parameter
K
d validation data
mean s.d. min max
PaCO
2
(kPa) 5.39 0.84 3.74 7.62
RR (breath/min) 16.21 4.19 12 28
Vt (l) 0.47 0.11 0.17 0.75
Pinsp (cmH
2
O) 13.30 3.23 8 20
PEEP (cmH
2
O) 9.01 2.87 5 15
Kd 29.10 7.37 14 50
Table 4: VCO
2
Data Summary.
Parameter
VCO
2
modelling data
mean s.d. min max
MV (l/min) 7.76 1.68 4.09 15.55
Vt (l) 0.54 0.09 0.29 0.9
EtCO
2
(kPa) 4.80 0.97 3.18 8.51
MV (l/min) 7.76 1.68 4.09 15.55
Parameter
VCO
2
validation data
mean s.d. min max
MV (l/min) 8.90 1.79 5.66 15.55
Vt (l) 0.54 0.07 0.39 0.65
EtCO
2
(kPa) 4.68 0.69 3.38 6.39
MV (l/min) 217.75 33.42 144.5 292
2.3 Kd and VCO
2
Prediction Results
The surface plots for the Kd model and Kd prediction
curves are shown in Figure 9. Prediction results for
Kd are shown in Tables 5-6. The optimized Kd model
has reduced the number of predictions outside of the
+10% margin of error. However, some predictions
were slightly higher than the actual measurements.
The new model has reduced the overshooting error
that exists when PaCO2 is between 8.0kPa and
8.18kPa, and when PEEP is between 16cmH
2
O and
20cmH
2
O.
MSE
new
< MSE?
Yes
End
Start
Use initial MF and calculate MSE
Generate particle positions
MSE = MSE
new
,MF = MF
new
Generate MF
new
and calculate MSE
new
Maximum
dimension reached?
Maximum
particle number reached?
Maximum
epochs reached?
Yes
Yes
No
No
No
No
Yes
Update particle number
Update particle dimension
Calculate particle velocity
Update particle positions
Evolutionary Type-2 Fuzzy Blood Gas Models for Artificially Ventilated Patients in ICU
115

There still exist ‘plateaus’ in the lower regions of
PaCO2 which relates to the middle and upper regions
of PEEP. This is likely due to the existing fuzzy rules
which were unable to represent the entire range of
inputs. A revised type-2 fuzzy model for Kd is
proposed to overcome this problem.
Figure 9: Surface plot and prediction curve for Kd model,
(top) manually tuned model, and (bottom) nPSO tuned
model.
In Kd modelling data set, the optimized model has
reduced the MSE from 19.61 to 14.47 (26.21%
improvement). It has also increased the correlation
from 0.79 to 0.83. In Kd validation data set, the
optimized model has reduced the MSE from 28.91 to
22.39 (22.55% improvement). It has also increased
the correlation from 0.69 to 0.80.
Figure 10: Surface plot and prediction curve for VCO
2
model, (top) manually tuned model, and (bottom) nPSO
tuned model.
The surface plots for the VCO
2
model and VCO
2
prediction curves are shown in Figure 10. Prediction
results for VCO
2
are shown in Tables 7-8. The
optimized VCO
2
model has removed the majority of
predictions outside of the +10% margin of error. The
model has smoothed the indentation observed for MV
values between 12 l/min and 14 l/min. A plateauing
effect can be seen on the upper region of the input,
this is due to limitations of the lungs to produce
carbon-dioxide (CO
2
) more than its maximum
capacity.
In VCO
2
modelling data set, the new VCO
2
model
has reduced the MSE from 629.97 to 476.85 (24.30%
improvement). It has also increased the correlation
significantly from 0.79 to 0.92. In VCO
2
validation
data set, the optimized model has reduced the MSE
from 395.72 to 315.46 (20.28% improvement). It has
also increased the correlation from 0.84 to 0.91.
Table 5: Kd Results (Modelling Data).
Tuning MSE MAE s.d R
Manual 19.61 13.45 4.10 0.79
nPSO
cycle
1 14.47 10.92 3.81 0.83
2 20.99 14.53 4.37 0.76
3 15.11 11.48 3.85 0.82
4 14.29 11.23 3.76 0.83
5 16.71 12.17 4.05 0.80
6 16.61 12.40 4.04 0.80
Table 6: Kd Results (Validation Data).
Tuning MSE MAE s.d R
Manual 28.91 14.62 5.35 0.69
nPSO
cycle
1 22.39 10.98 4.53 0.80
2 27.26 14.35 5.26 0.73
3 23.92 13.63 4.90 0.75
4 22.09 13.35 4.69 0.77
5 24.64 13.68 4.98 0.74
6 22.32 13.23 4.74 0.77
Table 7: VCO
2
Results (Modelling Data).
Tuning MSE MAE s.d R
Manual 629.97 9.65 25.11 0.88
nPSO
cycle
1 510.03 8.13 22.62 0.91
2 501.64 8.52 22.31 0.91
3 463.26 8.17 21.55 0.91
4 476.85 7.96 21.88 0.92
5 507.83 8.49 22.50 0.91
6 612.70 9.23 24.80 0.89
Table 8: VCO
2
Results (Validation Data).
Tuning MSE MAE s.d R
Manual 395.72 6.98 19.86 0.84
nPSO
cycle
1 344.40 6.36 17.74 0.89
2 384.26 6.96 18.10 0.88
3 373.56 6.91 18.64 0.87
4 315.46 6.33 16.60 0.91
5 369.05 6.88 17.45 0.90
6 311.59 6.37 16.79 0.91
ICINCO 2017 - 14th International Conference on Informatics in Control, Automation and Robotics
116

2.4 Revision of the Dead-Space (Kd)
Model
The type-2 fuzzy model for Kd was revised to include
all possible combinations of input membership
functions to form the fuzzy rules. The Kd model has
five inputs and three MFs for each input. This resulted
in 243 manually tuned rules for the revised fuzzy
model. The revised model appears to have removed
the plateauing effect and the ‘peaks’ at the higher
region of the input parameters (see Figure 11).
The overall performance of the revised Kd
prediction was reduced when compared to the nPSO
optimized model (Table 9). This is mainly due to the
fact that the fuzzy sets and rules were manually
selected. The following section will discuss the
revised model’s performance when integrated into
SOPAVent v.4.
Figure 11: Surface plot for revised Kd model.
Table 9: Result for Kd Revised Model.
Data Set MSE MAE s.d R
Modelling 21.76 14.48 4.53 0.74
Validation 32.76 14.96 5.76 0.62
3 VALIDATION OF SOPAVENT
BLOOD GAS PREDICITION ON
REAL PATIENT DATA
The Kd and VCO
2
models were integrated into
SOPAVent to create the latest version, SOPAVent
v.4. In combination with the other inputs, SOPAVent
v.4 will predict the ABG parameters of PaO2, PaCO
2
and pH. The predicted ABG parameters were
compared with actual ABG measurements. Two types
of output were generated by SOPAVent: i) the initial
ABG prediction and, ii) the ABG prediction after
settings changes were applied to the ventilator. Data
processing protocol, as defined in Goode (2001) and
Wang et al., (2010), was also used for this research.
This included the following:
The patients were ventilated under Bi-level
Positive Airway Pressure mode (BiPAP)
The ABG samples were taken no less than 30
minutes and no longer than 60 minutes before
ventilator settings were changed. ABG samples
were taken at least 30 minutes but no longer than
three hours after ventilator settings were changed
The mean blood pressure variance between pre-
ventilator-changes and post-ventilator-changes
were within +15%, and
The patient’s spontaneous breathing to total
breathing ratio between pre-ventilator-changes
and post-ventilator-changes were less than +15%
A total of 29 data sets from 21 patients were used to
validate SOPAVent v.4. The patients included 14
males and 7 females with a mean weight of 70.4 + 16
kg, a mean height of 170 ± 9.18cm, and a mean age
of 58 ± 13 years (Table 10). SOPAVent v.4 results
were compared with SOPAVent v.3 by Wang et.al
(2010). SOPAVent v.4 results are categorized across
two versions of SOPAVent:
i) SOPAVent v.4.1 with nPSO optimized Kd and
nPSO optimized VCO
2
ii) SOPAVent v.4.2 with revised Kd and nPSO
optimized VCO
2
Table 10: Patient Demography.
Age
Height
(cm)
Weight
(kg)
Male Female
58+13 170+9.18 70.4+16 14 7
3.1 SOPAVent Validation Result
The results for SOPAVent v.4 versus SOPAVent v.3
are shown in Table 11. The comparison of
performance between SOPAVent v.4 and SOPAVent
v.3 is shown in Table 12.
For initial ABG prediction, both SOPAVent v.4
and SOPAVent v.3 showed identical performance for
PaO
2
prediction with a correlation coefficient
between modelled and measurement maintained at 1.
For PaCO
2
prediction, SOPAVent v.4 has reduced the
mean absolute error (MAE) from 11.60 to 9.11
(21.46% improvement) and increased the correlation
significantly from 0.69 to 0.91. The majority of the
predictions were within the +10% margin of error.
For pH prediction, the MAE was reduced from 0.71
to 0.54 (23.94% improvement) and correlation
coefficient increased significantly from 0.67 to 0.88.
Most predictions were within the +10% margin of
error.
Evolutionary Type-2 Fuzzy Blood Gas Models for Artificially Ventilated Patients in ICU
117

Table 11: Initial and Post-Ventilator-Change ABG Prediction Results.
Initial ABG Prediction Post-Ventilato
r
-Chan
g
e ABG Prediction
Paramete
r
PaO
2
PaO
2
Version MSE MAE s.
d
RMSEMAEs.
d
R
v.3.0 1.14e-5 1.68e-2 3.30e-3 1.00 11.41 15.07 3.17 0.49
v.4.1 1.92e-05 2.35e-2 4.30e-3 1.00 11.44 15.18 3.14 0.50
v.4.2 1.92e-5 2.66e-2 4.20e-3 1.00 13.30 14.94 3.12 0.50
Paramete
r
PaCO
2
PaCO
2
Version MSE MAE s.
d
RMSEMAEs.
d
R
v.3.0 1.30 11.60 1.16 0.69 0.87 10.68 0.95 0.78
v.4.1 0.64 9.85 0.76 0.86 1.09 10.11 1.03 0.74
v.4.2 0.39 9.11 0.63 0.91 0.74 10.31 0.87 0.81
Paramete
r
p
H
p
H
Version MSE MAE s.
d
RMSEMAEs.
d
R
v.3.0 5.60e-3 0.71 7.50e-2 0.67 4.70e-3 0.69 6.80e-2 0.71
v.4.1 2.70e-3 0.57 5.28e-2 0.84 3.4e-3 0.60 5.95e-2 0.78
v.4.2 2.5e-3 0.54 4.82e-2 0.88 3.00e-3 0.59 5.15e-2 0.84
Table 12: Performance Comparison for SOPAVent v.3 and SOPAVent v.4.
ABG
Initial ABG Predictions Post Setting Change ABG Predictions
SOPAVent v.3 SOPAVent v.4 SOPAVent v.3 SOPAVent v.4
PaO
2
PaCO
2
pH
ICINCO 2017 - 14th International Conference on Informatics in Control, Automation and Robotics
118
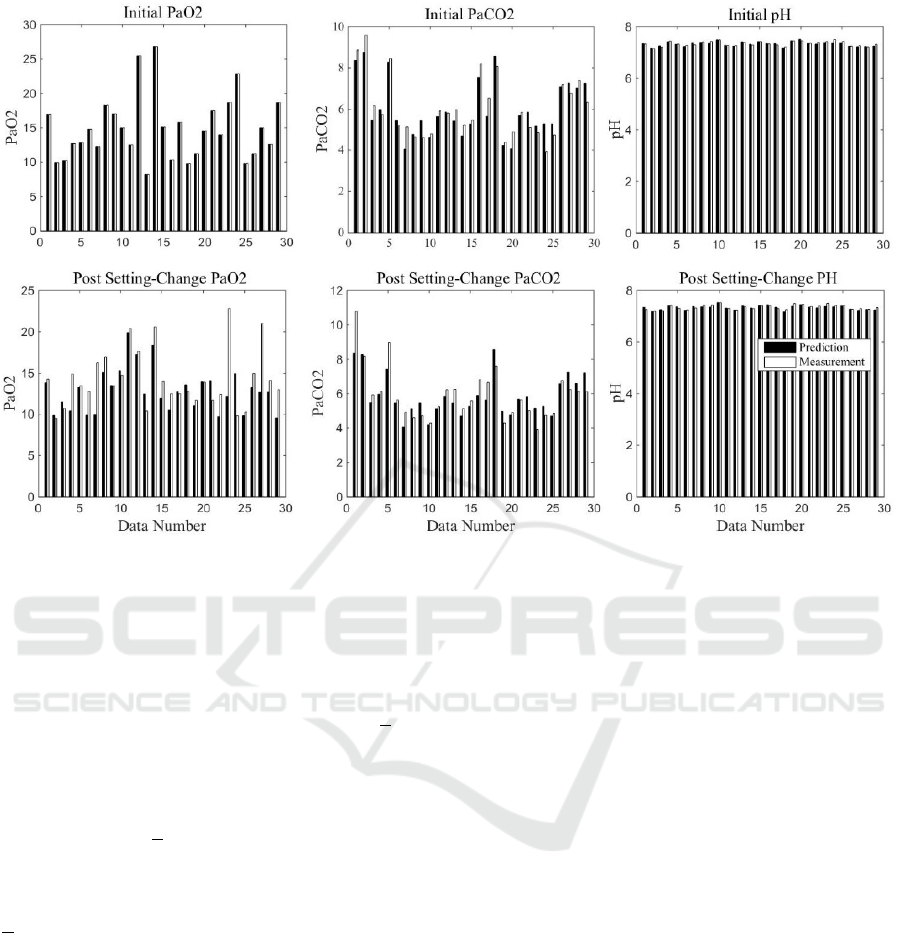
Figure 12: SOPAVent v.4 results with real ABG measuremen.
When ventilator settings were changed,
SOPAVent v.4 did not show any noticeable
improvement in the prediction of PaO
2
. The MAE
between modelled and measured maintained at 15 and
the correlation coefficient stayed at 0.5. A significant
amount of predictions were still outside the +10%
margin of error. For PaCO
2
prediction, SOPAVent
v.4 has marginally reduced the MAE from 10.68 to
10.31 (3.46% improvement) and increased the
correlation from 0.78 to 0.81. Most of the predictions
were within the +10% margin of error. For pH
prediction, the MAE was reduced from 0.69 to 0.59
(14.49% improvement) and correlation was increased
from 0.71 to 0.84. Most predictions are within the
+10% margin of error.
The results for SOPAVent v.4 against real ABG
measurements are also shown in Figure 12.
4 CONCLUSIONS
A new particle swarm optimization (nPSO) algorithm
was used to tune the type-2 fuzzy models of Kd and
VCO
2
in SOPAVent model. The nPSO tuned models
were shown to produce better prediction accuracy
when compared to the manually tuned models. The
new ‘momentum’ term in nPSO enables the algorithm
to avoid premature convergence and creates an adap-
tive search process for the particles.
The new modelling framework has smoothed the
output curve for the manually tuned VCO
2
model, and
partly reduced the anomalies which relate to
‘plateaus’ and ‘peaks’ in certain input range as seen
in the manually tuned Kd model. To fully mitigate
this irregularity, a secondary ‘revised’ Kd model was
also introduced.
On its own, the nPSO Kd model exceeded the
prediction accuracy of the revised Kd model. When
integrated with the nPSO tuned VCO
2
model in
SOPAVent, the revised Kd model provided a slightly
more stable platform. This has helped to further
improve the prediction accuracy of the ABG
components.
Both SOPAVent version 4.1 with the nPSO tuned
Kd model and SOPAVent version 4.2 with the revised
Kd model exceeded the prediction accuracy of
SOPAVent version 3 in several components of the
ABG. This can be seen in the ABG components of
initial PaCO
2
prediction, initial pH prediction and
pot-ventilator-change pH prediction.
Further improvements are needed though for post-
ventilator-change PaO
2
predictions and post-
ventilator-change PaCO
2
predictions, as both
approaches were not as effective in enhancing the
prediction quality. We believe that a careful
modelling of the existing cardiac output (CO)
structure will help to further improve ABG prediction
Evolutionary Type-2 Fuzzy Blood Gas Models for Artificially Ventilated Patients in ICU
119

accuracy for the post-ventilator-change PaO
2
and
post-ventilator-change PaCO
2
.
ACKNOWLEDGEMENTS
The author would like to thank Majlis Amanah
Rakyat (MARA) Malaysia for funding this research.
REFERENCES
Goode, K.M. (2001), Model based development of a fuzzy
logic advisor for artificially ventilated patients, PhD
thesis, the University of Sheffield.
Indera-Putera, S.H, Mahfouf, M., and Mills, G.H. (2016),
Blood-gas modelling for artificially ventilated patients
using interval type-2 fuzzy logic system, XIV
Mediterranean Conference on Medical and Biological
Engineering and Computing (MEDICON), Cyprus.
Kwok, H. F., Linkens, D. A., Mahfouf, M., and Mills, G. H.
(2004). SIVA: A hybrid knowledge-and-model-based
advisory system for intensive care ventilators, IEEE
Transactions on Information Technology in
Biomedicine 8(2): 161-172.
Mohammad-Samuri, S., Mahfouf, M., Denaϊ, M., Ross, J.J.
and Mills, G.H (2011), Absolute EIT coupled to a blood
gas physiological model for the assessment of lung
ventilation in critical care patients, Journal of Clinical
Monitoring and Computing, Vol. 25 (1), pp. 27-28.
Wang, A., Mahfouf, M., Mills, G.H., Panoutsos, G.,
Linkens, D.A., Goode, K., Kwok H.F., and Denaï, M.
(2010), Intelligent model-based advisory system for the
management of ventilated intensive care patients:
Hybrid blood gas patient model, Computer Methods
and Program in Engineering, Vol. 99 Issue 2, pp. 195-
207.
Wu, D. and Mendel, J.M. (2009), Enhanced Karnik-Mendel
algorithms, IEEE Transaction on Fuzzy Systems, vol.
17, no.4, pp. 923-934.
Wu, D., (2012), On the Fundamental Differences between
Interval Type-2 and type-1 Fuzzy Logic Controllers,
IEEE Transaction on Fuzzy Systems, vol. 20, no.5, pp.
832-848.
Zhang, Q. and Mahfouf, M. (2006), A new structure for
particle swarm optimization (nPSO) applicable to
single objective and multi-objective problems, 3rd
International IEEE Conference Intelligent Systems,
London, United Kingdom.
APPENDIX A
(a) O
2
transport equations in SOPAVent:
1
A.1
A.2
A.3
1
A.4
1000
1
A.5
1000
A.6
A.7
Where x is A (alveolar), a (arterial), t (tissue), v
(venous) and p (pulmonary)
Volume. (l)
Cardiac output (l/min)
X Fraction of blood shunted passed the lungs
O
2
consumption (ml/min)
Alveolar dead-space volume (ml)
Ventilator tidal volume (ml)
RR Respiratory rate (breath/min)
Alveolar O
2
content (ml/l)
O
2
concentration (ml/l).
O
2
diffusion constant (ml/kPa/l)
Mean airway pressure (kPa)
Inspired fraction of O
2
Pulmonary partial pressure of O
2
(kPa)
Inverse of the O
2
dissociation function
(b) CO
2
transport equations in SOPAVent:
1
A.8
A.9
A.10
1
A.11
1000
1
A.12
ICINCO 2017 - 14th International Conference on Informatics in Control, Automation and Robotics
120

1000
A.13
A.14
Carbon dioxide production (ml/min)
Alveolar CO
2
content (ml/l)
CO
2
concentration (ml/l).
CO
2
diffusion constant (ml/kPa/l)
Inspired fraction of CO
2
Pulmonary partial pressure of CO
2
(kPa)
Inverse of the CO
2
dissociation function
(c) O
2
dissociation function
..
.
A.15
Where,
Haemoglobin concentration
O
2
saturation
Haemoglobin O
2
combining capacity
O
2
p
lasma carrying capacity
(d) CO
2
dissociation function
22.2
.
1
A.16
Where,
Packed cell volume (haematocrit)
Evolutionary Type-2 Fuzzy Blood Gas Models for Artificially Ventilated Patients in ICU
121
