
Towards a Self-balancing Machine Velocity Production Line
for Energy Saving
E. Garcia
1
and N. Montes
2
1
Ford Spain, Poligono Industrial Ford S/N, CP 46440, Almussafes, Valencia, Spain
2
Department of Physics, Mathematics and Computing, University CEU Cardenal Herrera,
CP: 46115, Alfara del Patriarca, Valencia, Spain
Keywords:
Energy Saving, Predictive Control, Velocity Control, Robot Arm, Manufacturing Lines.
Abstract:
The present study analyzes how to re-balance a real world manufacturing line for energy saving by means
of machine velocity reduction. Without loss of generality, the paper is focused in Industrial Robot (IR) lines
where the velocity of each robot is properly tuned using a predictive control technique. It predicts the IR
idle time for the next cycle based on the model line knowledge, the mini-term sub cycle time measurements
and simulation techniques. The proposed predictive control technique is tested off-line, using a real world
welding line model located at Factory Ford, Almussafes (Valencia). Also an estimation of the stored energy
is computed by means of an experimental test developed in a real welding unit. A discussion on how to
implement it in a real line is done at the end of the paper.
1 INTRODUCTION
A production line is a set of sequential operations
established in a factory whereby materials are put
through a refining process to produce an end-product
that is suitable for onward consumption; or compo-
nents are assembled to make a finished article. Be-
cause of the high investment and running costs in-
volved, the design of such lines is of considerable im-
portance, (O.Battaa, 2013). There are a large num-
ber of crucial decisions to be made in flow line de-
sign as, product design, process selection, line lay-
out configuration, line balancing, machine selection,
available technology, etc. Usually, these problems are
considered one at a time because of their complexity,
(O.Battaa, 2013). The last and crucial step in the pro-
cess design is the line balancing, (O.Battaa, 2013).
Here tasks are assigned to the workstations and re-
sources that will be employed on the line. Due to the
relevance of this task, a large number of researchers
have been working on this topic, (O.Battaa, 2013).
Depending on industrial environments, there are solu-
tions to a number of product models, line layout, tasks
and their attributes, workstations and their attributes,
etc, see (O.Battaa, 2013).
Recently, the pressure to reduce energy consump-
tion in the industry is growing due to increasing costs
of electricity and resources. The motor vehicle in-
dustry alone in the U.S. spends about 3.6 billion Dol-
lars on energy annually, (C.Galitsky, 2008). There-
fore, the energy saving goal is a key point for the
industry and also for the governments as the Euro-
pean Union, (Comission, 2016). For that reason, in
the production line balancing problem, energy sav-
ing is a crucial goal recently. Primary research ef-
forts on manufacturing energy savings have focused
on developing individual energy efficient machines.
(G.Mouzon, 2008b), (G.Mouzon, 2008a), pointed out
that if instead of leaving the non-bottleneck machines
idle, they were turned off until needed, then 80%
savings on total energy consumed on idle, start up,
and shut down could be achieved. However, there
are significant amounts of energy required for ma-
chine startup. This suggests that energy saving ef-
forts focusing solely on updating individual machines
or processes may be missing a significant, and per-
haps a bigger, opportunity i.e., system-level changes
and coordinated control (Q.Chang, 2013). It is due
to production lines are a complex dynamic system
with interdependence among different machines and
unscheduled events like downtimes, breakdown and
other random disturbances, (Q.Chang, 2013). Most
current manufacturing execution systems (MES) have
no module or function to deal with energy man-
agement during operation, which means that a huge
amount of energy is wasted during the machine block-
568
Garcia, E. and Montes, N.
Towards a Self-balancing Machine Velocity Production Line for Energy Saving.
DOI: 10.5220/0006430405680575
In Proceedings of the 14th International Conference on Informatics in Control, Automation and Robotics (ICINCO 2017) - Volume 2, pages 568-575
ISBN: Not Available
Copyright © 2017 by SCITEPRESS – Science and Technology Publications, Lda. All rights reserved

age and starvation without production, making the en-
ergy efficiency really low. Leaving a non-bottleneck
machine idle due to lack of multiple operation states
setting seems to be a routine and regular operating
practice in the industry. In (Z.Sun, 2011) considers
that modern machines or motors systems have multi-
ple adjustable power states instead of traditional ON,
OFF states. The power state is maintained on the ON
level when it is processing parts; while the power hi-
bernation mode may be triggered when it is detected
to be starved or blocked. In (L.Li, 2013), The inter-
actions between the adopted energy control decisions
and system state evolutions are modelled by Markov
decision process (MDP).The decision is to adjust the
energy mode for each machine according to not only
current states but also possible evolutions of system
states in the future. In (Z.Zhou, 2013), a heuristic
method considering throughput bottleneck detection
for real time electricity demand response under the
production constraint is introduced.
1.1 Energy Saving in Industrial Robots
One of the areas in which a significant amount of en-
ergy can be saved in manufacturing process is in in-
dustrial robots (IR). For example, the energy needed
during the production of cars is approximately 8%,
(D.Meike, 2011b). Therefore, the primary goal of
the optimization is to minimize the energy consump-
tion of a robotic cell for a given production rate by
changing the robot speeds, positions, order the oper-
ations and applying the robot power saving modes,
(L.Bukata, 2016). However, energy consumption re-
duction for IR can be achieved at different stages of
a manufacturing systems’ developments: During pro-
duction planning, commissioning process, or at opti-
mization stages, see (P.Matthias, 2015). At the pro-
duction planning stage, engineers are more flexible
with optimizing the process and defining a strategy
for reducing energy consumption, for example, by op-
timizing IR operation schedule, (D.Meike, 2011b) or
by optimizing IR parameters, like the speed and accel-
eration of the robots, (D.Meike, 2011a), (A.Kovetski,
2008). At the commissioning stage, reducing energy
consumption can be conducted by eliminating wait-
ing and iddle time of IR but manufacturing produc-
tivity must be considered. At the optimization stage,
the engineers cannot change the hardware apparatus
or the production rate. Therefore, the energy reduc-
tion must be done by releasing the actuator brake
earlier and implementing optimal trajectories using
time-scaling methods, (D.Meike, 2014), (P.Matthias,
2015), (S.Riazi, 2016).
1.2 Real World Line Balancing
Problems
Although many solutions for reducing the energy con-
sumption of IR have been provided, majority of them
are focused in primary stages. Optimizing the mo-
tion planning of IR can reduce energy consumption
but less interesting for practical point of view and
only effective for an IR manufacturers, (P.Matthias,
2015). Optimizing the operating parameters is a rela-
tively new method but is only effective in the produc-
tion planning stage, while the productivity rate at the
manufacturing system is planned, (P.Matthias, 2015).
In the end, an expert team designs the line, based on
all of these parameters and defines the maximum pro-
duction rate, adjust the IR parameters, program the
trajectories, schedule the tasks, etc. However, dur-
ing the lifespan of the line, which could be decades,
the line suffers a lot of changes due to market de-
mand with new products or models manufactured in
the same line, new technologies like for instance a
new robot arm that can run more faster than when
the line was designed, deteriorating systems that af-
fect the throughput and also produce a dynamic bot-
tleneck behaviour, etc, see (E.Garcia, 2016).
Many of the Operational Research approaches as
well as energy saving strategies implicity assume that
the problem to be solved involves a new, yet-to-be
build assembly line or yet-to-be-build-factory. How-
ever, the vast majority of real-world line balancing
tasks involve existing lines, (E.Falkenauer, 2005). In
fact, the target line tipically needs to be re-balanced
rather than balanced.
1.3 Previous Works
In (E.Falkenauer, 2005) was defined that each work-
station have its own identity, meaning that the work-
stations in the real world are indeed not identical.
The same concept was deep analyzed in our previous
works where not only the workstations are not identi-
cal, but also the components that form each machine
are different and do not have the same behaviour in
each cycle time repetition.The literature classify the
data used in the production line analysis into long-
term and short-term. Long-term is mainly used for
process planning, while short-term focuses primar-
ily on process control. In (E.Garcia, 2016), short-
term was divided into two new terms, mini-terms and
micro-terms, see Figure 1.
A mini-term may be defined as a part of the ma-
chine, in a policy preventive maintenance or a break-
down, which could be replaced in an easy and faster
maneuver than other machine sub-division. A micro-
Towards a Self-balancing Machine Velocity Production Line for Energy Saving
569
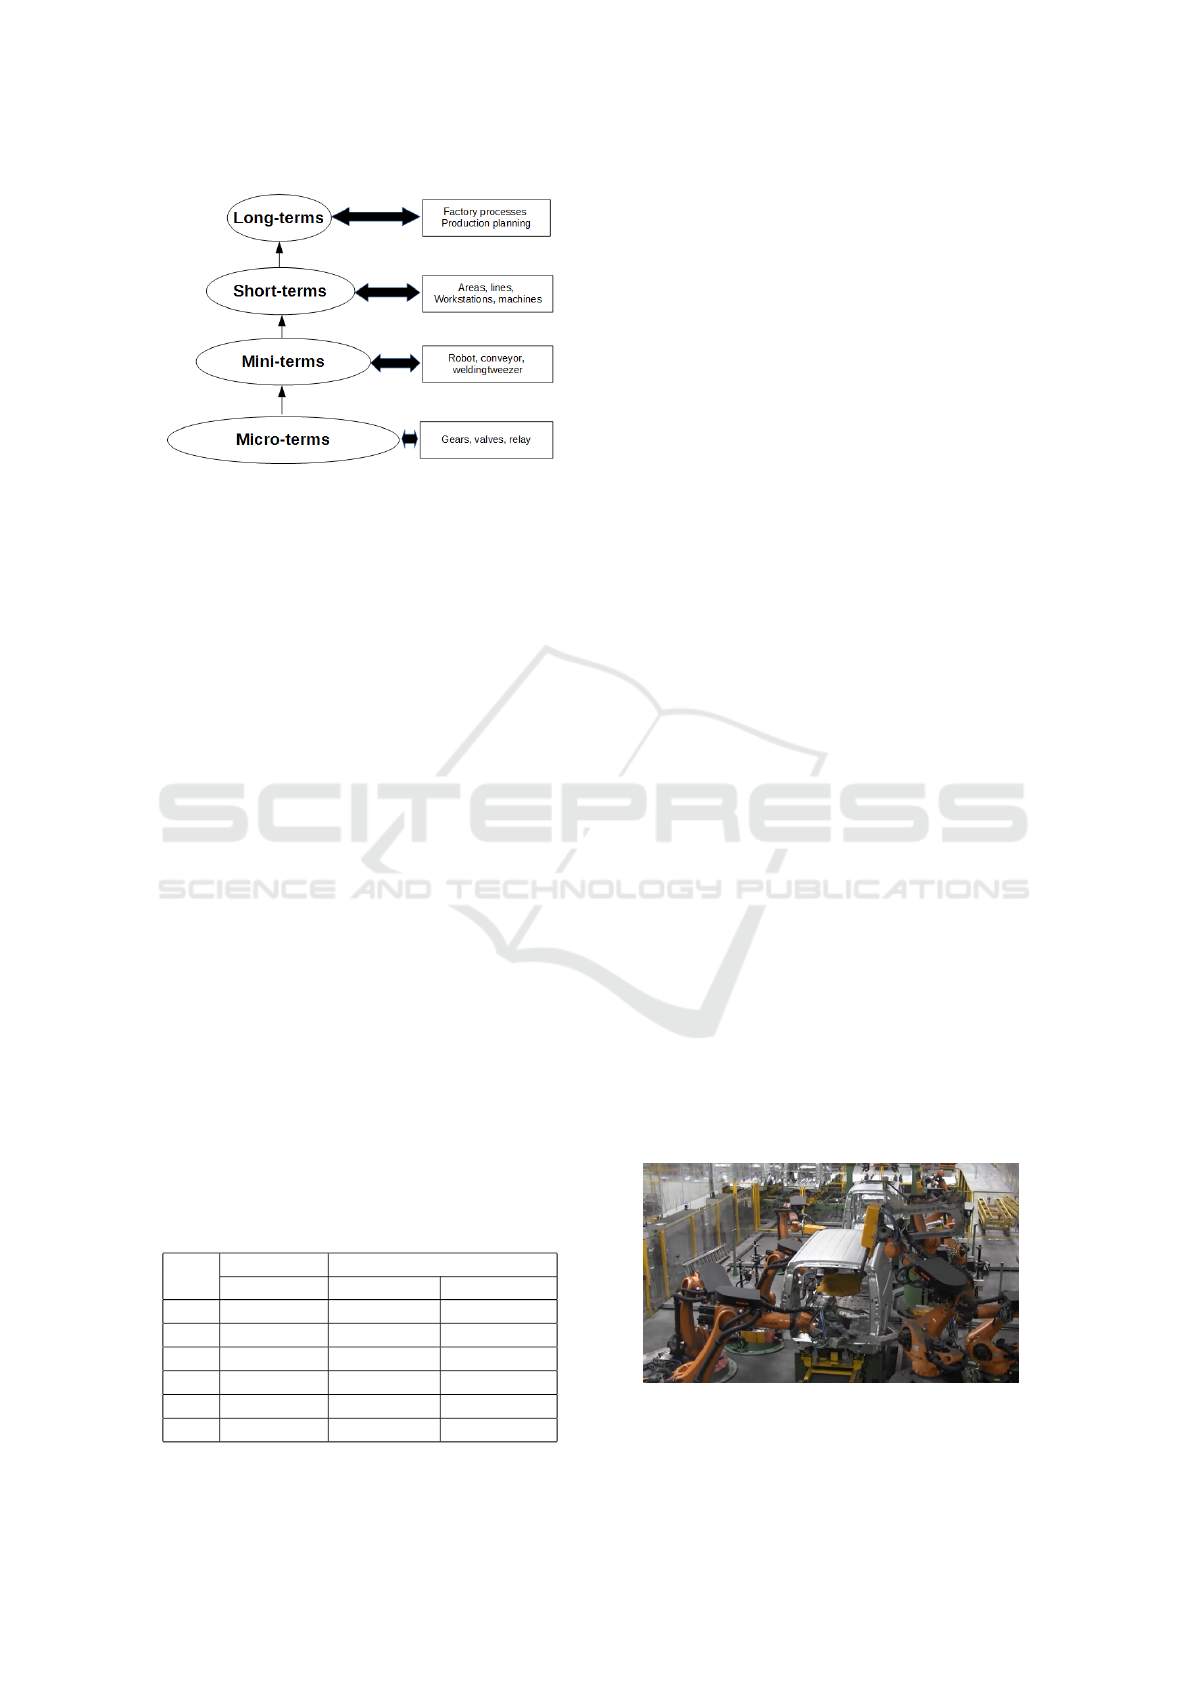
Figure 1: From micro-term to Long-term.
term is defined as each of the mini-term sub-division.
It could be divided to the level of depth that the user
requires. Therefore, the probabilistic cycle time of
each machine or station is a concatenation of the
probabilistic mini-terms and micro-terms times where
each could have a different probability distribution.
In (E.Garcia, 2016), (E.Garcia, 2017) was pro-
posed an experimental setup to measure the most
common mini-terms of a welding unit. In this case,
the welding unit is divided into three mini-terms, the
motion of the robot arm, the motion of the welding
clamp and the welding task, see Table 1. The tests de-
veloped in (E.Garcia, 2016), (E.Garcia, 2017), allow
us to measure the sub-cycle times for each mini-term
at the start (Table 1,test 0) and near to the end of the
lifetime of some particular machine component. The
deteriorated components were selected at the weld-
ing line at Ford Motor Factory located at Almussafes
(Valencia) with some particular pathologies which are
not detectable by the machine control systems or by
the maintenance workers. The pathologies are; the
stiffness of a proportional valve (Table 1,test 1), the
pneumatic cylinder wear, galling or communication
inside the stem (Table 1,test 2), the loss of the wire
insulation in a transformer (Table 1,test 3), the loss
of pressure in a pneumatic circuit (below the alarm
value) (Table 1,test4) and the loss of the robot speed
(Table 1,test5).
Test 0 demonstrates that the line components have
Table 1: mini-terms for a welding unit (µ,σ) with (Test 0)
and without deterioration (Test 1-5).
Test Robot arm Clamp
Motion Motion Welding
0 (1,0.11) (0.42,0.47) (1.44,0.84 )
1 (1,0.18) (0.43,0.51) (4.05,10.9)
2 (1,0.13) (1.41,3.42) (1.14,5.99)
3 (1,0.19) (0.46,0.54) (1.76,0.91)
4 (1,0.16) (1.56,3.74) (1.29,5.08)
5 (1.3,0.16) (0.41,0.46) (1.45,0.85)
its own identity and do not have the same behaviour
in each repetition. Moreover, the line components,
cylinders, transformers, etc, are deteriorated during
their lifetime. Therefore, the probabilities, mean and
variance changes, modifying the productivity rate and
defining a new alternative for predictive maintenance,
see (E.Garcia, 2016), (E.Garcia, 2018).
2 NUMERICAL CASE EXAMPLE
2.1 Welding Line Case
In order to test and illustrate our proposal, a real
welding line located at Ford Almussafes (Valencia)
is used, see Figure 2. In a real welding line like
this, there are welding workstations where, each one
has welding stations working in parallel and some-
times in serial. Each welding station makes some
welding points in the same cycle time. It is possi-
ble to find 1,2,4 or at least 6 welding station in the
same workstation, where each one makes up to 19
welding points. In our particular case, our welding
line has 8 workstations where workstation 1,5 and 6
have 4 welding units,workstations 2,4,7 and 8 have
6 welding stations and workstation 3 has 1 welding
unit, see Figure 3. The welding line was installed
in 1980. The staff group that designed the line de-
fined the maximum running capacity, ECR (engineer-
ing running capacity), 60 JPH (Jobs Per Hour). How-
ever, the plant engineers have another maximum run-
ning capacity, that is the ERR (engineering running
rate), in this case defined in 51 JPH. Nowadays, this
line welds 68 different models and variants. Different
car models with 3,5 doors with or without solar roof,
etc. Obviously, from 1980 to today, the line suffers a
lot of changes and updates, new models and variants
are appear and old models and variants disappeared,
most advanced robot arms and welding units are in-
troduced, etc. Therefore, the line is re-balanced, if it
is possible, when new update occurs.
Figure 2: Welding line at Ford Almussafes (Valencia).
ICINCO 2017 - 14th International Conference on Informatics in Control, Automation and Robotics
570
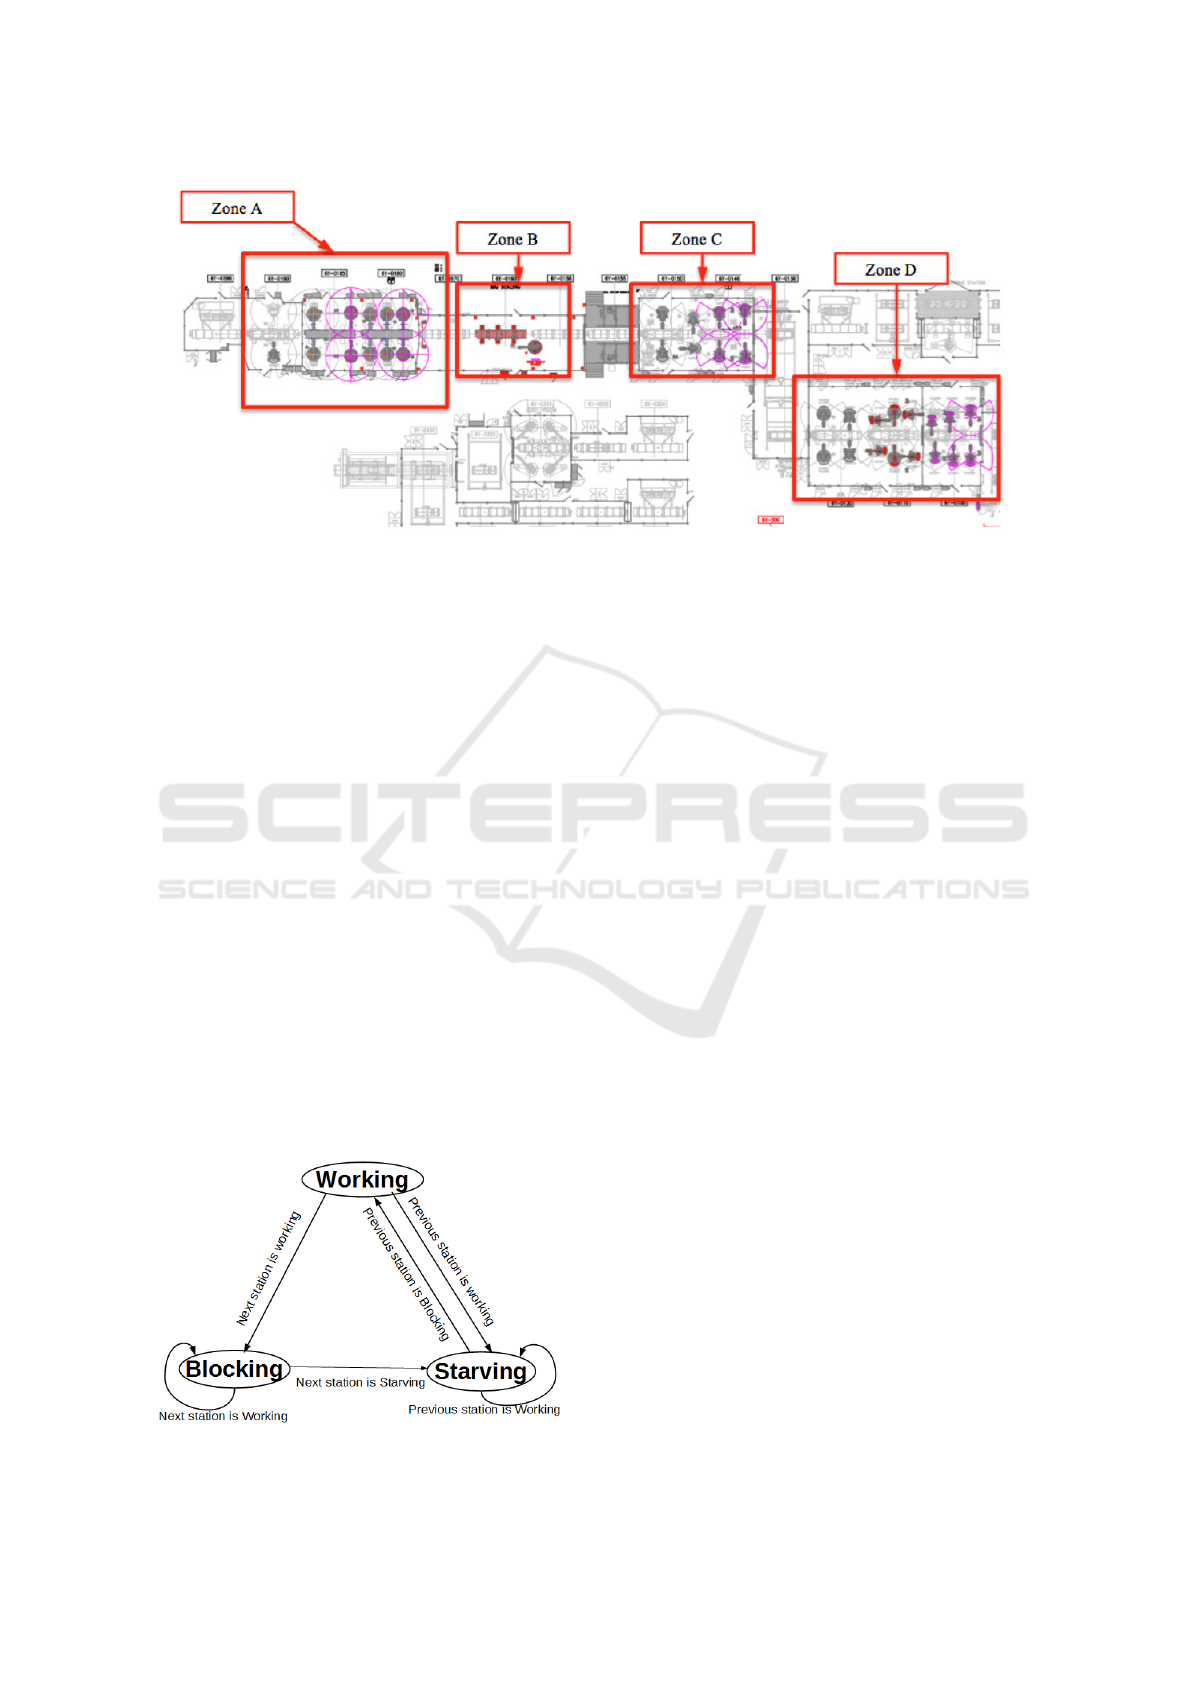
Figure 3: Welding line layout.
2.2 Welding Line Modelling
The welding line was modeled taking into account
the mini-terms subdivision. that is, the motion of the
robot arm (the time that the robot is in movement),
and the number of welding point for all the 68 differ-
ent models and variants, see (E.Garcia, 2016), Anex
4. Also in (E.Garcia, 2016), Anex 4, there is the off-
set, time that a particular robot is awaiting for another
robot in the same workstation and the transfer time,
the required time to move the car body to the next
workstation, (12 seconds). With this model and us-
ing a computer simulation explained below, the pro-
ductivity rate was re-computed in, (E.Garcia, 2016)
,(E.Garcia, 2017), taking into account the variability
and the production schedule.
2.3 Welding Line Simulation
The common way to simulate a production line is
to use a simplified machine state, see Figure 4, with
three possible states, Working, Starving and Blocking.
First of all, let us to define a serial production line
with three stations, a,b and c, that are chained in this
Figure 4: Simplified state machine.
order. If station b is in Working state and the work is
finished, it checks station c, if it is in Starving state,
the finished part of product is delivered to it and sta-
tion b is free to receive another job. If station c is
in Working state when station b finishes its work, sta-
tion b changes its state to Blocking, blocking itself
until station c is free. If station b is free to receive an-
other part, it checks the previous station. If station a
is in Working state, station b changes to Starving state
waiting until station a has a part to work on. If station
a is in Blocking state, station b receives the part so, the
state of station b changes to Working and the state of
station a changes to Starving. When simulation starts,
every station state is set to Starving, until the first sta-
tion is set to Working state. The simulation loop runs
at predefined step time (t). For each step time, the cy-
cle time of each workstation decreases until the cycle
time is zero, meaning that the work is finished and the
events are triggered.
In order to simulate the welding line, a chain state
machine simulator is developed, see Figure 6. The
loop is updated with an incremental time of 0.01 sec-
onds. When the cycle time is finished in a particu-
lar workstation, a new cycle time is computed for the
next part, taking into account the car model that will
be manufacture in the next cycle. It is important to
point out that there are different mini-terms and rep-
etitions of each one for each particular car model de-
veloped in a welding line, see figure 5.
In the simulated welding line, a job is always per-
formed in the first workstation, so that the blocking
state cannot be reached in the first station. In addition,
all the finished jobs in the last workstation are retired,
so that the Starving state cannot be reached in the last
workstation. The loop starts with all the stations in
the Blocking state.
The cycle time for each workstation is the max-
Towards a Self-balancing Machine Velocity Production Line for Energy Saving
571
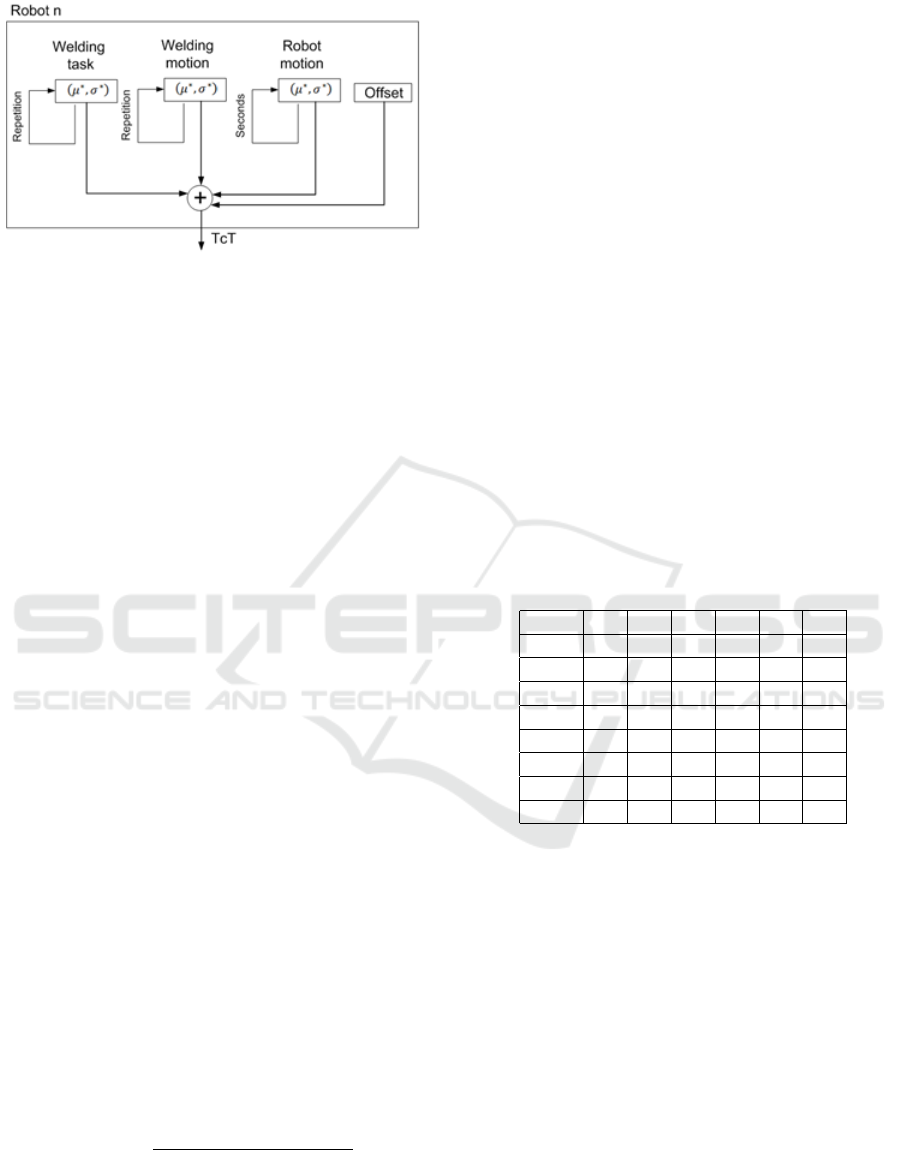
Figure 5: Cycle time computation for each welding unit.
imum cycle time of each welding station that works
in parallel, indicating the slower welding unit and the
bottleneck in a particular workstation.
3 PREDICTIVE CONTROLLING
TECHNIQUE FOR ENERGY
SAVING
In order to test the energy saving algorithm proposed
below, a model, or variant 12 for the (E.Garcia, 2016),
anex 4 is selected. The values of this model are shown
also in the Table 3 of the present paper. If a simulation
is run supposing that the welding line only produces
this model, and the mini-terms are without deteriora-
tion (Table 1,test 0) the production rate is (45.0,1.07),
mean and variance respectively. The simulation also
computes the starving and blocking times, that are
shown in figure 7. As can we see, workstation 4 is
the bottleneck workstation, mainly because, blocking
and starving time are produced at the previous and
later workstations respectively.
Based on blocking and starving times, let us to
define idle time as;
Id
W
k
= Max(S
W
k
,B
W
k
) (1)
where Id
W
k
is the idle time for the workstation W that
manufactured the part in the k instant of time. S
W
k
, B
W
k
are the starving and blocking time the workstation W
that manufactured the part in the k instant of time.
The equation 2 shows how to estimate the minimum
velocity at which each robot could run without loss of
production rate, that is;
%v
W,R
k
=
mR
W,R
Zoh
mR
W,R
Zoh
+ O f f
W,R
+ Id
W
Zoh
(2)
where %v
W,R
k
is the percentage velocity of the
robot R in the workstation W that can be applied for
the part manufactured at the time instant k, O f f
W,R
is
the offset for the robot R at workstation W . mR
W,R
Zoh
is
an estimation of the mini-term robot R at workstation
W . This estimation is done by means of Zoh (Zero
order hold) technique using the next equation;
mR
W,R
Zoh
= mR
W,R
k−1
(3)
Id
W
Zoh
is an idle time estimation for the part that
will be manufactured at the time instant k. This es-
timation is done by means of a computer simulation
technique using the estimated mini-terms, that is;
mCm
W,R
Zoh
= mCm
W,R
k−1
,mCw
W,R
Zoh
= mCw
W,R
k−1
, (4)
where mCm
W,R
Zoh
and mCw
W,R
Zoh
are estimations of the
mini-term clamp for a robot R at workstation W . Also
the velocity reduction applied for the previous part,
k − 1, is taken into account. An schema of the pro-
posed strategy is shown in figure 8.
Table 2 shows the velocity percentages for each
robot at each workstation. With these velocities, the
line is re-balanced and the starving and blocking time
are nearly to zero, see figure 9, maintaining the pro-
duction rate,(45.0,1.07).
Table 2: Velocity percentages for each robot.
W /R 1 2 3 4 5 6
1 52 52 55 56
2 78 79 71 73 85 66
3 23
4 0 0 0 0 0 0
5 80 81 85 85
6 80 81 66 62
7 75 74 75 75 75 75
8 84 84 80 79 83 83
3.1 Welding Line Energy Saving
Estimation
In order to estimate the energy saved with this strat-
egy, the energy consumed for a particular welding
unit at different velocities was done. This experimen-
tal test isolates one welding unit, see Figure 10, where
a current clamp is located at the wire that supplies en-
ergy to the welding unit. The test uses one of the com-
mon trajectory planning programs used in the welding
line. Therefore, the energy consumed by the welding
at different velocities is obtained, see Figure 11.
With this curve, the estimated energy consumed if
all the welding units work at maximum velocity speed
is 7008 Kwh. Applying the velocity reduction, the
estimated energy consumed is 3007 Kwh.
ICINCO 2017 - 14th International Conference on Informatics in Control, Automation and Robotics
572
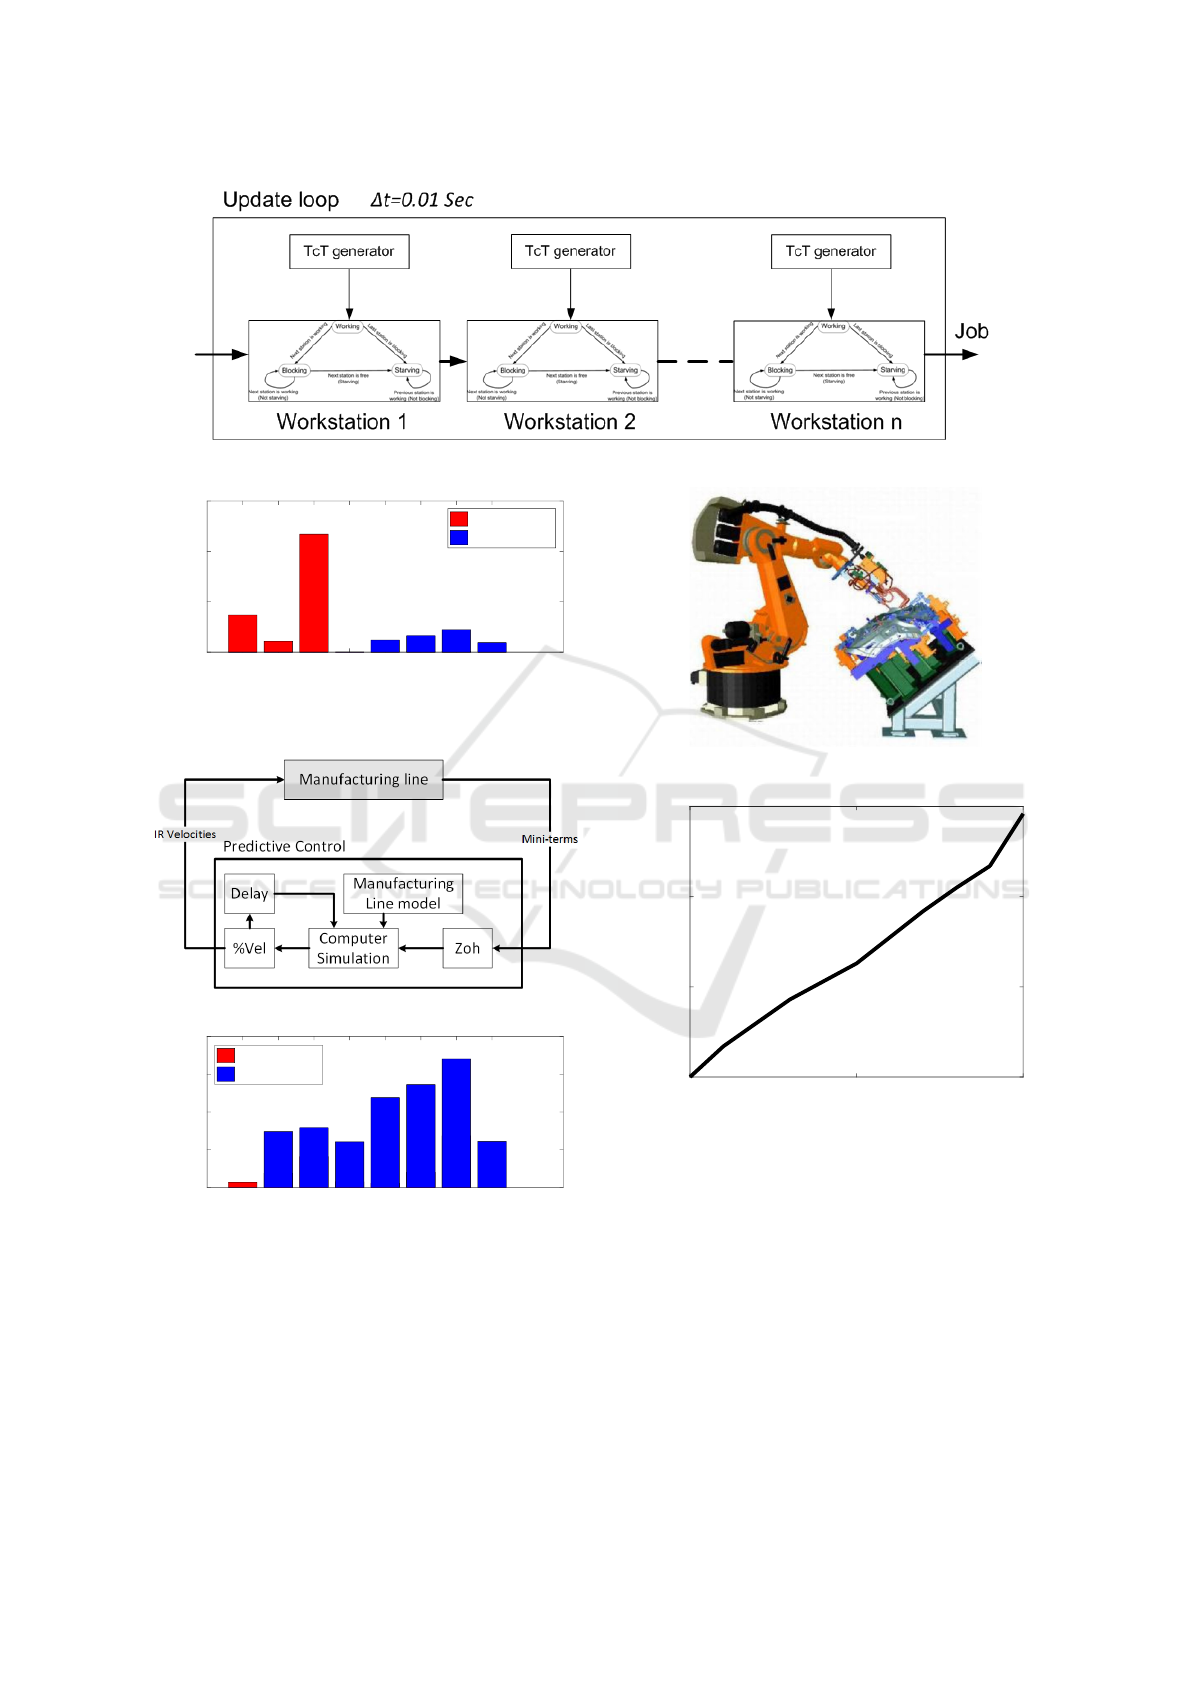
Figure 6: Welding line simulation.
1 2 3 4 5 6 7 8
WorkStations
0
20
40
60
Time (Sec)
Blocking time
Starving time
Figure 7: Starving and blocking time before velocity reduc-
tion.
Figure 8: Control loop schema.
1 2 3 4 5 6 7 8
WorkStations
0
0.5
1
1.5
2
Time (Sec)
Blocking time
Starving time
Figure 9: Starving and blocking time after velocity reduc-
tion.
4 DISCUSSION. TOWARDS A
REAL-TIME ENERGY SAVING
SYSTEM FOR INDUSTRY 4.0
The present paper treats to define how to develop a
real-time control strategy to re-balance manufactur-
Figure 10: Isolated welding unit.
0 50 100
Velocity (%)
0
50
100
150
Energy (Kwh)
Figure 11: Velocity percentage VS energy in a real welding
unit.
ing lines by means of IR velocity reduction. The first
affair to discuss is the parameter used to re-balance.
As can be explained in the introduction, the vast ma-
jority of the techniques proposed are only valid for
a new line, not an existing one. Changing machine
parameters in real-time could be a solution and, the
velocity and acceleration could be the better one. It is
due to the kinetic energy is the energy used in manu-
facturing plants because the parts are moved parallel
to the floor. In particular for automotive industry,
Towards a Self-balancing Machine Velocity Production Line for Energy Saving
573
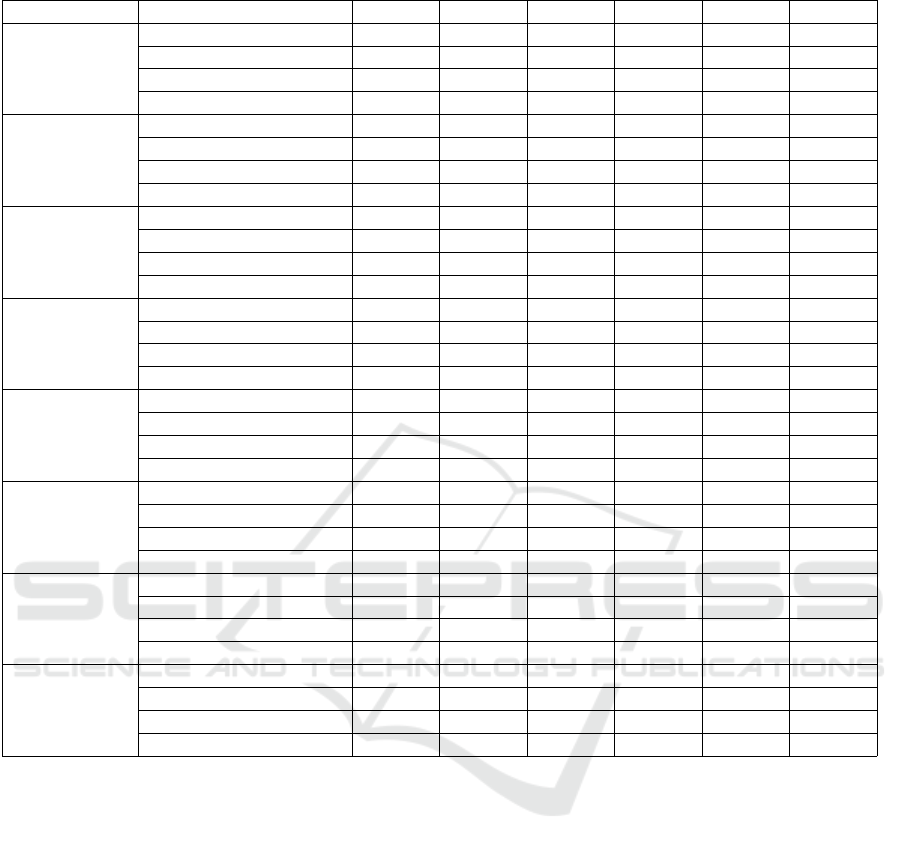
Table 3: mini-terms for a model 12.
Robot 1 Robot 2 Robot 3 Robot 4 Robot 5 Robot 6
Workstation 1 Robot motion (Sec) 14 13.26 20.84 16.52 13.72
Welding motion (Units) 9 9 6 6 18 18
Welding task (Units) 9 9 6 6 18 18
Offset(Sec) 0 11 11 0 0 0
Workstation 2 Robot motion (Sec) 24.76 21.26 — — 9.52 11.52
Welding motion (Units) 9 9 — — 18 18
Welding task (Units) 9 9 — — 18 18
Offset(Sec) 0 4 — — 0 0
Workstation 3 Robot motion (Sec) — — 19.56 — —
Welding motion (Units) — — 9 — — —
Welding task (Units) — — 9 — — —
Offset(Sec) — — 0 — — —
Workstation 4 Robot motion (Sec) 13.96 16.54 16.54 17.4 — —
Welding motion (Units) 14 11 11 10 — —
Welding task (Units) 14 11 11 10 — —
Offset(Sec) 0 0 0 6 — —
Workstation 5 Robot motion (Sec) 16.26 15.12 20.68 21.4 — —
Welding motion (Units) 9 8 12 10 — —
Welding task (Units) 9 8 12 10 — —
Offset(Sec) 0 2 0 0 — —
Workstation 6 Robot motion (Sec) 20.26 11.02 14.12 11.34 — —
Welding motion (Units) 9 18 8 6 — —
Welding task (Units) 9 18 8 6 — —
Offset(Sec) 0 0 0 0 — —
Workstation 7 Robot motion (Sec) 11.66 10.10 12.38 8.52 7.52 19.26
Welding motion (Units) 19 15 17 18 18 9
Welding task (Units) 19 15 17 18 18 9
Offset(Sec) 0 0 0 0 0 0
Workstation 8 Robot motion (Sec) 12.24 13.10 12.38 14.10 13.96 15.68
Welding motion (Units) 16 15 17 15 14 12
Welding task (Units) 16 15 17 15 14 12
Offset(Sec) 0 0 0 0 0 0
huge masses as body car are moved, acting as an scal-
ing factor. In addition to that, all the Industrial robots
manufactures provides a velocity control parameter
for a predefined program and can be controlled using
an external input, making easily and cheap the control
system. The second affair is if the IR velocity reduc-
tion is the best choice for energy saving. For instance,
in the welding line analyzed here, it is not clear if is
better to reduce IR velocities or reduce the velocity
conveyor. The first one moves welding units at high
speed, low weight, but the second one moves the body
car, high weight.
The third affair is how to compute the velocity
reduction. The solution proposed in the present pa-
per is only tested for an isolated manufacturing line,
welding line, that produce a single model. Real world
shows that the line produce 68 different models with
a predefined production schedule.
To end up, A Real-time energy saving system that
re-balance the velocity or acceleration needs Indus-
try 4.0. Real world lines have their own entity, even
each mini-term. Real-time monitorization, not only
for the mini-terms but also breakdowns and other real
world facts must be taken into account to re-balance
the velocity successfully without reduce the produc-
tion rate.
5 CONCLUSIONS AND FUTURE
WORKS
The present study shows, for the first time, a control
technique to re-balance a manufacturing line for en-
ergy saving. The re-balance is done by means of In-
dustrial Robots velocity reduction. A predictive con-
trol technique is used to estimate it by means of Zero
order hold (Zoh) technique for the real-time mini-term
ICINCO 2017 - 14th International Conference on Informatics in Control, Automation and Robotics
574

measurements. A computer simulation give us an es-
timation of the idle time for the part that will be pro-
duce in the next cycle time.
Future works are focused in three main branches
that we are working in parallel. The first one is to
deeply analyze all the systems that acts in a manu-
facturing automotive industry to determine which is
the better choice to reduce the velocity, based on the
energy saving point of view. The second one is to
improve the technique proposed here for multi-model
lines. In that case, the predictive control must take
into account the production schedule for the velocity
estimation reduction. The last one is to implement a
real setup to test on-line the schema proposed in Fig-
ure 8. In that sense, a real line that produce a single
model could be used to test the efficiency of the tech-
nique proposed in the present paper.
ACKNOWLEDGEMENTS
Authors wish to thank Ford Espa
˜
na S.A and in par-
ticular Almussafes Factory for their support in the
present research.
REFERENCES
A.Kovetski (2008). Velocity balancing in flexible manu-
facturing systems. In Proceedings of the 9th Interna-
tional Workshop on Discrete Events Systems. IEEE.
C.Galitsky (2008). Energy efficiency improvement and cost
saving opportunities for the vehicle assembly industry.
In ErnestOrlando Lawrence Berkeley National Labo-
ratory Report, Berkeley,. CA, LBNL-50939-Revision.
Comission, E. (2016). Energy efficiency. avail-
able: https://ec.europa.eu/energy/en/topics/energy-
efficiency. In European commision. ELSEVIER.
D.Meike (2011a). Analysis of the energy efficient us-
age methods of medium and high payload industrial
robots in the automotive industry. In 10th Int. Symp.
Typical problems in the Field of Electrical and Power
Engineering. IEEE.
D.Meike (2011b). Energy efficient use of robotics in the
automobile industry. In International Conference on
Advanced Robotics (ICAR). ICAR.
D.Meike (2014). Energy efficient use of multirobot produc-
tion lines in the automotive industry: detailed system
modelling and optimization. In Transactions on Au-
tomation Science and Engineering. IEEE.
E.Falkenauer (2005). Line balancing in the real world. In
International Conference on Product Lifecycle Man-
agement. Interscience Enterprises Ltd.
E.Garcia (2016). Analisis de los sub-tiempos de ciclo tec-
nico para la mejora del rendimiento de las lineas de
fabricacion. http://hdl.handle.net/10637/8352, Valen-
cia, 2nd edition.
E.Garcia (2017). A novel predictive maintenance policy
based on the sub-cycle time deterioration effect.(under
review). In Transactions on Automation Science and
Engineering. IEEE.
E.Garcia (2018). Re-computation of the manufacturing pro-
ductivity rate based on real world parameters. a weld-
ing line case. (under review). In Transactions on In-
dustrial Informatics. IEEE.
G.Mouzon (2008a). A framework to minimize total energy
consumption and total tardiness on a single machine.
In International Journal of Sustainable Energy. Taylor
and Francis.
G.Mouzon (2008b). Operational methods for minimization
of energy consumption of manufacturing equipment.
In International Journal of Production Research. Tay-
lor and Francis.
L.Bukata (2016). Energy optimization of robotic cells. In
Transactions on Industrial Informatics. IEEE.
L.Li (2013). Dynamic energy control for energy efficiency
improvement of sustainable manufacturing systems
using markov decision process. In IEEE Transactions
on systems, Man, and Cybernetics systems. IEEE.
O.Battaa (2013). A taxonomy of line balancing problems
and their solution approaches. In International Jour-
nal of Production Economics. ELSEVIER.
P.Matthias (2015). Reducing energy consumption of in-
dustrial robots in manufacturing systems. In Inter-
national Journal of Advanced manufacturing Technol-
ogy. Springer.
Q.Chang (2013). Energy saving opportunity analysis of au-
tomotive serial production systems. In ieee Transac-
tions on automation science and engineering. IEEE.
S.Riazi (2016). Energy and peak-power optimization of ex-
isting time-optimal robot trajectories. In International
conference on automation Science and Engineering.
IEEE.
Z.Sun (2011). Energy consumption reduction for sus-
tainable manufacturing systems considering machines
with multiple-power states. In Proceedings of the
ASME 2011 Int. Manufacturing Science and Engi-
neering Conference. ASME.
Z.Zhou (2013). Real time electricity demand response
for sustainable manufacturing systems considering
throughput bottleneck detection. In International
Conference on Automation Science. IEEE.
Towards a Self-balancing Machine Velocity Production Line for Energy Saving
575
