
The Efficient Randomness Testing using Boolean Functions
Marek S
´
ys, Du
ˇ
san Klinec and Petr
ˇ
Svenda
Masaryk University, Botanicka 68a, Brno, Czech Republic
Keywords:
Statistical Randomness Testing, Hypothesis Testing, Boolean Function.
Abstract:
The wide range of security applications requires data either truly random or indistinguishable from random.
The statistical tests included in batteries such as NIST STS or Dieharder are frequently used to assess the
randomness property. We designed a principally simple, yet powerful, statistical randomness test working on
bit level. It is based on a search for boolean function(s) indicating a bias when applied to the tested stream not
expected for truly random data. The deviances are detected in seconds rather than tens of minutes required
by the common batteries. Importantly, the boolean function indicating the bias directly describes the pattern
responsible for this bias. This allows to construct the bit predictor or to fix the cause of bias in the function
design. The present bias is typically detected in at least an order of magnitude less data than required by
NIST STS or Dieharder. The tests included in these batteries are either too simple to spot the common biases
(like the Monobit test) or overly complex (like the Fourier Transform test) requiring an extensive amount of
data. The proposed approach called BoolTest fills this gap. The performance was verified on more than 20
real world cryptographic functions – block and stream ciphers, hash functions and pseudorandom generators.
Among others, the previously unknown bias in the output of C rand() and Java Random generators was found.
1 INTRODUCTION
A newly designed cryptographic primitive (block ci-
pher, stream cipher, hash function, pseudo-random
generators etc.) is subjected to a cryptanalysis look-
ing for flaws or information leakage in the primitive
design. Standard cryptanalysis techniques like lin-
ear, differential and algebraic cryptanalysis are used
to find correlations between input, output and key
bits (if used). The existence of correlated bits in-
dicates a weakness of the function. Although these
techniques can be partially automated, the aid of the
skilled cryptanalyst is still needed.
Fully automated but weaker statistical test suites
(e.g., NIST STS, Dieharder, TestU01) are often
used before cryptanalysis. Commonly, well-designed
crypto-primitives should produce output with the
same characteristics as random data. Test suites ex-
amine the correlation of function output bits through
randomness analysis of data it produces. Each test
suite (often called battery) usually consists of tens of
empirical tests of randomness. Each test looks for a
predefined pattern of bits (or block of bits) in data and
thus it examines randomness from its specific point of
view.
Although there is an unlimited number of tests
in principle, batteries opt for implementation of only
several selected ones for the practical reasons. Each
test computes a histogram of a specific feature of bits
(or block of bits). The histogram is statistically com-
pared with the expected histogram (for random data).
The result (p-value) of the test is probabilistic mea-
sure how well both histograms match. Data are con-
sidered to be non-random if histograms differ signif-
icantly. The randomness in such a context is a prob-
abilistic property and we can commit two types of
errors – Type I (truly random data are rejected) and
Type II (non-random data are not rejected).
Batteries implement many tests of various com-
plexity – from a very simple Monobit computing
statistic of bits (frequency of ones and zeros) to the
very complex statistic of large blocks (computation
of linear profile). The complexity of tests usually de-
termines the amount of data needed to compute his-
tograms for comparison. In order to decrease the Type
I and II errors, sufficiently many data sequences are
required in practice. The complex and usually slow
tests require up to GB’s of data which can be hard to
generate in some cases, while several MB’s are suffi-
Implementation and paper supplementary material can be
found at https://crocs.fi.muni.cz/papers/secrypt2017.
92
Sýs, M., Klinec, D. and Švenda, P.
The Efficient Randomness Testing using Boolean Functions.
DOI: 10.5220/0006425100920103
In Proceedings of the 14th International Joint Conference on e-Business and Telecommunications (ICETE 2017) - Volume 4: SECRYPT, pages 92-103
ISBN: 978-989-758-259-2
Copyright © 2017 by SCITEPRESS – Science and Technology Publications, Lda. All rights reserved

cient for very simple tests.
We can identify following generic limitations of
batteries with respect to the analysis of cryptographic
functions:
1. An Insufficient Strength to Detect Bias in Com-
plete Function. – The tests included in a battery
are usually too weak to detect biases in an out-
put of a modern cryptographic function with a full
number of rounds and other security parameters.
2. An Insufficient Sensitivity to Detect Bias if
Small Amount of Data is Provided. – The tests
might be too weak to detect biases when an only
limited amount of data available is for the testing.
The tests usually require from 10MB up to sev-
eral GBs of data which may not be available or
efficient to collect in particular test scenario.
3. The Difficulty of Results Interpretation. –
The interpretation of test results is often only
general in the form “something is wrong with
data/function”. Only few tests are able to identify
concrete dependent bits and provide this crucial
information to cryptanalyst.
Our goal is to resolve the last two aforemen-
tioned problems and to construct the set of statistical
tests that will be stronger in detecting the bias when
given a limited amount of data yet directly identify-
ing the biased output bits. In fact, we are looking for
the strongest distinguisher (of cryptographic function)
from randomness possible within the given amount
of data and complexity of a distinguishing function.
A distinguisher is iteratively constructed in the form
of simple function starting from the simplest possible
and proceeding towards the more and more complex
boolean functions. Surprisingly, such a test is miss-
ing from all three commonly used test suites. Our
approach is a generalization of the simple Monobit
test and was practically tested on the wide range of
cryptographic functions of various types – block and
stream ciphers, hash functions and pseudo-random
number generators (PRNGs). We have found prac-
tical strong distinguishers which can be also used as
the bit predictors (although usually weak) for the cor-
responding functions.
In short, we make the following contributions:
• Simple, Yet Strong Test. We designed the prin-
cipally simple, yet surprisingly strong test called
BoolTest based on the boolean functions. The
output of cryptographic functions like AES or
SHA-3 (with over 20 tested) with reduced num-
ber of rounds still distinguishable are comparable
to commonly used statistical batteries.
• Interpretable test for small data. We have
shown that BoolTest not only requires signifi-
cantly fewer data and runs faster (seconds) but
also allows for the direct interpretation of a dis-
tinguisher found – which particular bits in tested
function output are biased together and how.
• Practical Distinguisher for C/Java Rand.
Among others, we found previously unknown
biases in the output of C rand() and Java Random
pseudo-random generators forming surprising
strong practical distinguishers regardless of the
initial seed used. A deeper analysis of these
distinguishers is provided.
• Open-source implementation: We release the
code of BoolTest (S
´
ys and Klinec, 2017) as an
open-source to facilitate further research in this
area and complement the standard test batteries.
The paper is organized as follows: in Section 2,
we describe a commonly used tests of randomness to-
gether with related work and motivation for more ef-
ficient tests. The Section 3 provides background and
detailed description of our strategy for distinguisher
construction based on boolean functions with rele-
vant implementation details which significantly speed
up the computations. The comparison of results with
common statistical batteries on more than 20 func-
tions are provided in Section 4 together with the de-
tailed discussion of practical distinguishers found for
the Java and C pseudo-random generators. The Sec-
tion 5 is devoted to the statistical interpretation of re-
sults, followed by conclusions given in Section 6.
2 RELATED WORK
NIST STS (Rukhin, 2010), Dieharder (Brown et al.,
2013) (a extended version of the Diehard) and
TestU01 (L’Ecuyer and Simard, 2007) are the most
commonly used batteries for statistical randomness
testing. The NIST STS is the basic battery required
by NIST to test RNGs of cryptographic devices by the
FIPS 140-2 certification process (NIST, 2001) with
four of NIST STS tests required as power-up tests
executed on-device. The Dieharder battery is an ex-
tension of original Diehard battery (Marsaglia, 1995)
with some (but not all) NIST STS tests also included.
The Dieharder is generally more powerful than NIST
STS with the ability to detect smaller biases but also
requires more input data.
TestU01 can be viewed as a current state of the
art of randomness testing. TestU01 is a library that
implements more than 100 different tests of random-
ness. These tests are grouped into 6 sub-batteries
called small Crush, Crush, Big Crush, Rabbit, Al-
phabit, BlockAlphabit. The first three sub-batteries
The Efficient Randomness Testing using Boolean Functions
93

are proposed to test floating point random numbers
from the interval [0,1]. Small Crush (10 tests), slower
Crush (96 tests) and very slow but powerful Big Crush
(all 106 tests). The amount of data used for analysis
increases with the number of tests and their complex-
ity. The small Crush/Crush/Big Crush need at least
206MB/2.6 GB/51.3GB data to run all tests of the bat-
tery. Other three batteries are proposed for testing the
binary sequences specifically. The Rabbit (26 tests),
Alphabit and BlockAlphabit (9 tests) batteries are not
limited in fact (Rabbit is restricted to 500 bits) in the
size of data they need for the analysis.
Batteries analyze data with an assumption that
data were generated by a black box function. It is
clear that more information we have about the gen-
erator better randomness analysis we can perform.
There are three basic approaches (linear, differential
and algebraic cryptanalysis) for randomness analysis
of data produced by a primitive which are based on
its internal structure. Nice tutorial on linear and dif-
ferential cryptanalysis can be found in (Heys, 2002).
Various methods of algebraic cryptanalysis are de-
scribed in the book (Bard, 2009). There are several
automated tools that implement aforementioned ap-
proaches. These tools look for dependency between
inputs and outputs of the primitive (and key, IV bits).
List of current such cryptanalytical methods and tools
implemented in recent years can be found at (Mouha,
2010).
In (Filiol, 2002) a new and strong method of statis-
tical testing of hash functions and symmetric ciphers
was proposed. In this approach each output bit is de-
scribed as a boolean function in the algebraic normal
form (ANF). The test statistic is based on a number
of monomials in ANF. Since number of monomials is
exponential in number of variables, the randomness
is evaluated based on a number of monomials of de-
gree exactly d which has χ
2
distribution for random
boolean functions. Another automated cryptanalytic
tool (Englund et al., 2007) is based on the strong d-
monomial test. In (Englund et al., 2007) monomial
test was generalized to perform chosen IV statisti-
cal attacks on stream ciphers. In (Stankovski, 2010),
a greedy method was proposed to find distinguish-
ers from randomness for stream and block ciphers.
The method is based on maximum degree monomial
test similar to d-monomial test. Previous methods are
based on ANF of analyzed function which is statisti-
cally compared with ANF of random boolean func-
tion expected for random data. This is completely
different to our approach where boolean function it-
self defines the statistic of a test of randomness.
The automated testing tool for cryptographic
primitives named Cryptostat (Kaminsky and Sorrell,
2014) is focused on testing block ciphers and message
authentication codes. Cryptostat consists of several
tests each computing the probability that block of bits
of the ciphertext equals to bits taken from plaintext
and key. Bits are selected either randomly or block
of consecutive bits are taken. The tests of CryptoStat
are reducible to Bernoulli trials and they are evaluated
using Bayesian conditional probability.
Hernandez and Isasi proposed an automated con-
struction of distinguisher for TEA block cipher
(Hern
´
andez and Isasi, 2004). The distinguisher in the
form of input bitmask of the 192-bit block is searched
for. As the search space of all possible bitmasks is too
large, a heuristic based on genetic algorithm was used
to construct a distinguisher for TEA limited up to 4
rounds. In the (Garrett et al., 2007), authors optimized
the Hernandez’s approach with quantum-inspired ge-
netic algorithm and found distinguisher for TEA lim-
ited to 5 rounds.
The similar but more general approach is used in
EACirc framework (EACirc, 2017) which constructs
distinguisher (test of randomness) for crypto primi-
tive without knowledge about primitive design (black-
box). In the EACirc test of randomness is constructed
for the predefined representation as circuit-like soft-
ware over the set AND, XOR, NOR, NOT of boolean
operations. The ciphers with a limited number of
rounds were tested with results comparable to NIST
STS battery. Although the Dieharder battery still pro-
vides overall better randomness analysis EACirc was
able to detect some non-randomness for Hermes and
Fubuki (S
´
ys et al., 2014) where both batteries failed
to detect any deviances.
2.1 Motivation for Better Tests
Tests in batteries can be roughly divided into three
main categories w.r.t. their complexity. 1) The very
simple tests compute statistic of bits (e.g., histogram
of ones and zeros) within an entire tested sequence or
within smaller parts of the whole sequence. 2) The
slightly more complex and usually slower tests com-
pute statistic of a small block of bits (e.g., an entropy
of 8-bit blocks) within a sequence. 3) The compli-
cated and slow tests compute a complex statistic (e.g.,
the histogram of rank for matrices, linear complexity)
within the large parts of the sequence.
How well the common batteries perform in the
analysis of crypto primitives? Let’s take the 100MB
data produced by truly random number generator
(which should pass all tests), divide it into 128 bits
blocks and introduce minor modification to original
random stream – the last bit (b
127
) of every block is
changed so that xor with the very first bit (b
0
) of that
SECRYPT 2017 - 14th International Conference on Security and Cryptography
94
block gives always 0 as the result (b
0
⊕b
127
= 0) in-
stead of in only half of the cases as expected. Even
such a strong bias is detected only by a handful of
tests, most significantly by the block frequency test. If
the resulting 0 is produced 1% more frequently than
1 (instead of always as previously), only one test of
the Crush battery detects the bias. And for 0.1% none
of the standard tests (batteries NIST STS, Dieharder,
Crush) detect this – still significant – bias. The prob-
lem lays in a structure of patterns tests of batteries
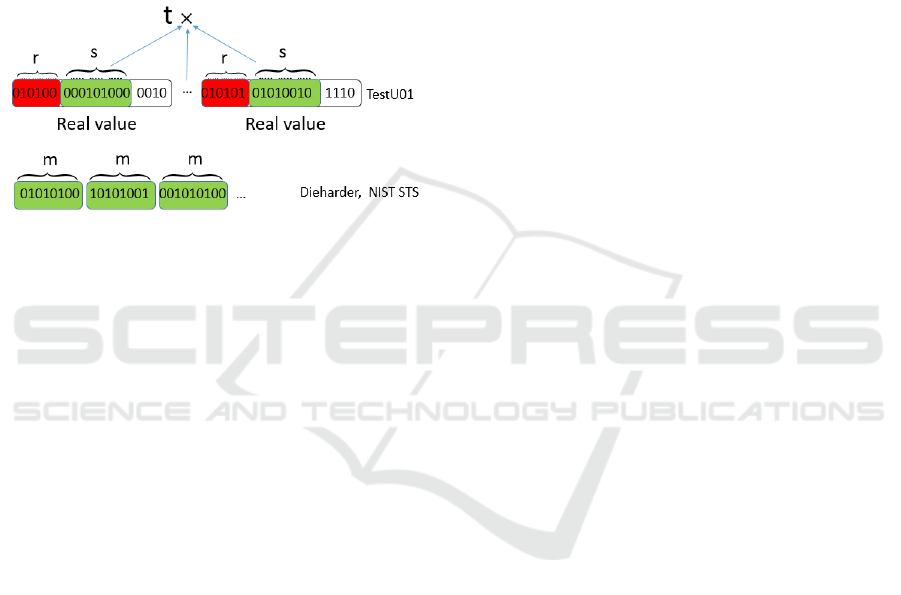
look in data. The Figure 1 shows the patterns of bits
as analysed by standard batteries.
Figure 1: The patterns analyzed by the TestU01, NIST STS
and Dieharder battery.
Dieharder and NIST STS batteries analyse ran-
domness according to consecutive m bits for small m
(typically m < 20). The tests included in TestU01 take
a different approach as data are transformed into se-
ries of real values with first r bits (of every real value)
discarded and only next s bits used for the analysis.
TestU01 analyses data usually as point in k dimen-
sions and thus t consecutive blocks of s bits represent
point in t dimensions. Values of r, s are typically in
range [0, 32] and t is usually small value < 10.
Very simple and bit oriented tests like Monobit
test are usually also the fastest. Besides the speed,
the additional advantage of simple tests is usually the
small amount of data necessary to compute correct re-
sults (statistic distribution is approximated well). The
more complex tests need significantly more data for
the sufficient approximation and thus also for detec-
tion of bias (if present). Another drawback of stan-
dard tests is a lack of possibility to retrospective iden-
tify the exact biased or correlated bits even when a
test is able to detect some bias. The observed statis-
tic computed by a test is given by frequencies (his-
togram) of some feature. For more than two bins we
are usually unable to identify which bin has unex-
pectedly high or low value (w.r.t. reference values).
Hence we cannot identify the concrete input bits re-
sponsible for the production of the extreme value of
the observed statistic. On the other hand, if histogram
contains only two bins, the value in one bin automat-
ically determines the value of the second bin.
According to the previous reasoning, the his-
togram (of frequencies) should preferably consist of
two bins. To identify the biased or correlated bits, the
searched relation should be bit-oriented as well. One
statistical test of randomness can be used to exam-
ine only one relation of specific bits (within a block).
In order to find correlated bits, we need to repeat
the process many times with many different relations
and bits selected. The time required to evaluate the
tests should be reasonably small and therefore the in-
spected relation represented as a simple boolean func-
tion is a natural choice. A relation analysed expressed
as a simple boolean function is fast to compute as only
bitwise operations are used to compute the required
histogram. Moreover, the exact (and not only approx-
imated) reference distribution expected for the truly
random data can be computed analytically. Finally,
one can easily order two candidates (boolean func-
tions) based on their complexity (degree and number
of components) and find the simplest function which
exhibits unexpected bias thus providing a more sen-
sible guide for cryptanalyst. The following Section
provides more details for the constructions of such
distinguishers.
3 THE RANDOMNESS
DISTINGUISHER BASED ON
THE BOOLEAN FUNCTIONS
Our approach is inspired by the Monobit test which
examines the proportion of ones and zeros within the
provided sequence. The frequencies of ones and zeros
computed in Monobit represent results of a boolean
function f (x
1
) = x
1
when applied to all bits of the
sequence. This can be generalized to an arbitrary
boolean function f (x
1
, x
2
, ··· , x
m
) of m variables ap-
plied to non-overlapping blocks of m bits.
In our approach, we construct set of boolean func-
tions (potentially distinguishers) defining different
tests of randomness. All tests (functions) are applied
the same way (see Section 3.2) to given sequence re-
sulting in a set of test statistics. The results of our
approach are the maximal observed test statistic and
the corresponding boolean function.
The maximal observed test statistic and the
boolean function can be used to evaluate the random-
ness of analysed sequence or a new sequence:
• Maximal observed test statistic can be directly
used to assess the randomness of analyzed se-
quence. The interpretation of maximal test statis-
tic is based on the distribution of maximal test
statistic obtained for reference random data (see
The Efficient Randomness Testing using Boolean Functions
95
Section 5).
• Found boolean function can be also used to assess
the randomness of a new sequence from the same
source as described in Section 3.2.
The distinguisher (boolean function) is con-
structed iteratively from simpler and weaker distin-
guishers (simpler boolean functions). Besides the fact
that simpler distinguishers are found first, this allows
also to speed up the entire process since many inter-
mediate computational results (for simpler functions)
can be reused.
3.1 Test of Randomness
The majority of empirical randomness tests are based
on the statistical hypothesis testing. Tests are for-
mulated to evaluate the null hypothesis – “data be-
ing tested are random”. Each test computes a specific
statistic of bits or block of bits which is a function
of tested data. Firstly, a histogram of patterns for the
given dataset is computed by the test. Then the his-
togram is transformed into a single value – observed
test statistic which represents randomness quality of a
sequence according to an analysed feature. The dis-
tribution (null distribution) of the test statistic under
the null hypothesis (data are random) is used to eval-
uate the test. Exact null distribution of a test statistic
is usually complex function hence its close approx-
imation is used instead. The most of the tests have
χ
2
or normal distribution as their null distribution. A
test checks where the observed test statistic appears
within the null distribution. The hypothesis is re-
jected if value happens to be in extreme parts of the
null distribution (tail). In such a case, the tested data
are considered to be non-random. An observed test
statistic is usually transformed to a p-value (using the
null distribution). The p-value represents the proba-
bility that a perfect random number generator would
have produced a sequence “less random” (more ex-
treme according to analysed feature) than the tested
sequence (Rukhin, 2010). P-value is compared with
the significance level α typically set to smaller val-
ues 0.01, 0.005 or 0.001 for the randomness testing.
If the p-value is smaller/bigger than α hypothesis is
rejected/accepted and data are considered to be non-
random/random. The following example illustrates
how p-value is computed for Monobit test.
Example 1. The Monobit test examines whether num-
ber of ones (#1) and zeros (#0) in a sequence of n
bits are close to each other as would be expected
for random data. The test statistic is computed as
s
obs
=
|#0−#1|
√
n
. The reference distribution of the test
statistic is half normal as stated in (Rukhin, 2010) but
this is just approximation. The p-value is computed in
Monobit test as:
p-value = er f c
s
obs
√
2
= er f c
|#0 −#1|
√
2n
using the well-known complementary error function
(er f c)(Press et al., 2007). Same p-value can be com-
puted for statistic s
obs
= #1. The exact distribution of
#1 is binomial distribution B(n, 0.5) for a sequence
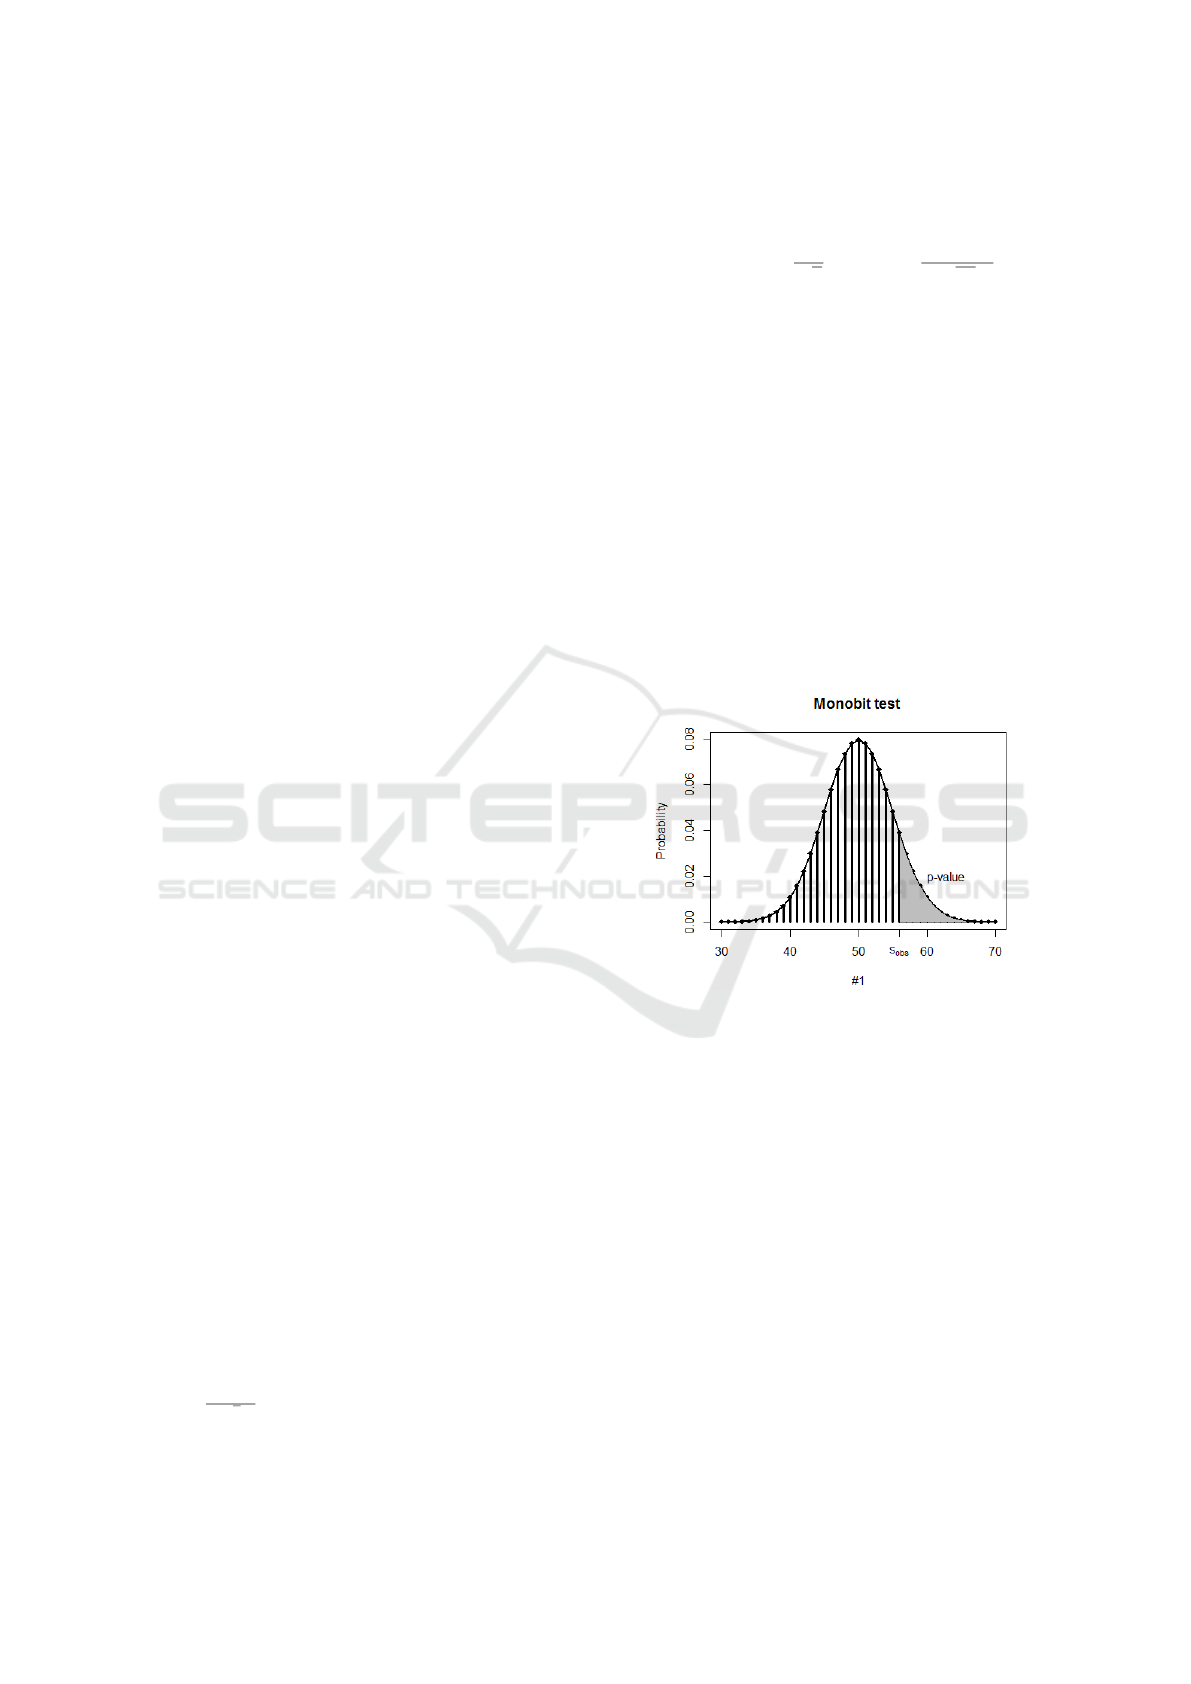
of n bits. Figure 2 illustrates the exact reference bi-
nomial distribution for s
obs
= #1 and sequences of
n = 100 random bits (bins). The figure also shows
that the discrete binomial distribution can be approx-
imated well by the continuous normal distribution for
sufficiently large n (documentation of NIST STS rec-
ommends n ≥ 100). The p-value represents the prob-
ability that RNG would generate data with more ex-
treme test statistic than s
obs
. A p-value can be com-
puted as an area below the normal distribution in the
tail bounded by the observed test statistic s
obs
. Fig-
ure 2 illustrates the value of p-value for n = 100 and
s
obs
= 56.
Figure 2: Discrete binomial distribution B(100, 0.5)
and its approximation by continuous normal distribution
N (50, 25). Area in the right tail represents p-value for
the test statistic defined by s
obs
= #1 for a sequence with
n = 100 bits.
3.2 Distinguisher Evaluation
In order to evaluate the strength of the distinguisher
(test), we use common principles from randomness
testing. We adapt and generalize the Monobit test.
The distinguisher (boolean function) defines the test
of randomness and the computed test statistic is used
directly as the measure of the strength of distin-
guishers. A bigger value of observed statistic means
stronger distinguisher and conversely. To generalize
the Monobit test, let us characterize steps of a test of
randomness.
An empirical test of randomness consists (in gen-
eral) of the following steps:
SECRYPT 2017 - 14th International Conference on Security and Cryptography
96
1. Compute the histogram H of some features
(within data).
2. Compute (transform the histogram to) the ob-
served test statistic s
obs
.
3. Compute the null distribution (exact or its close
approximation) D(x) of the test statistic under the
null hypothesis (random data).
4. Compute the p-value from s
obs
using the distribu-
tion D(x).
In our approach, the histogram of results of the
boolean function f (x
1
, ··· , x
m
) of m variables ap-
plied to non-overlapping m-bit blocks of the sequence
is computed. Our test statistic is Z-score (Sheskin,
2003) defined as:
Z-score =
#1 − pn
p
p(1 − p)n
, (1)
which normalize a binomial distribution B(n, p). Bi-
nomially distributed variable #1 is normalized to Z-
score which is distributed normally. P-value can be
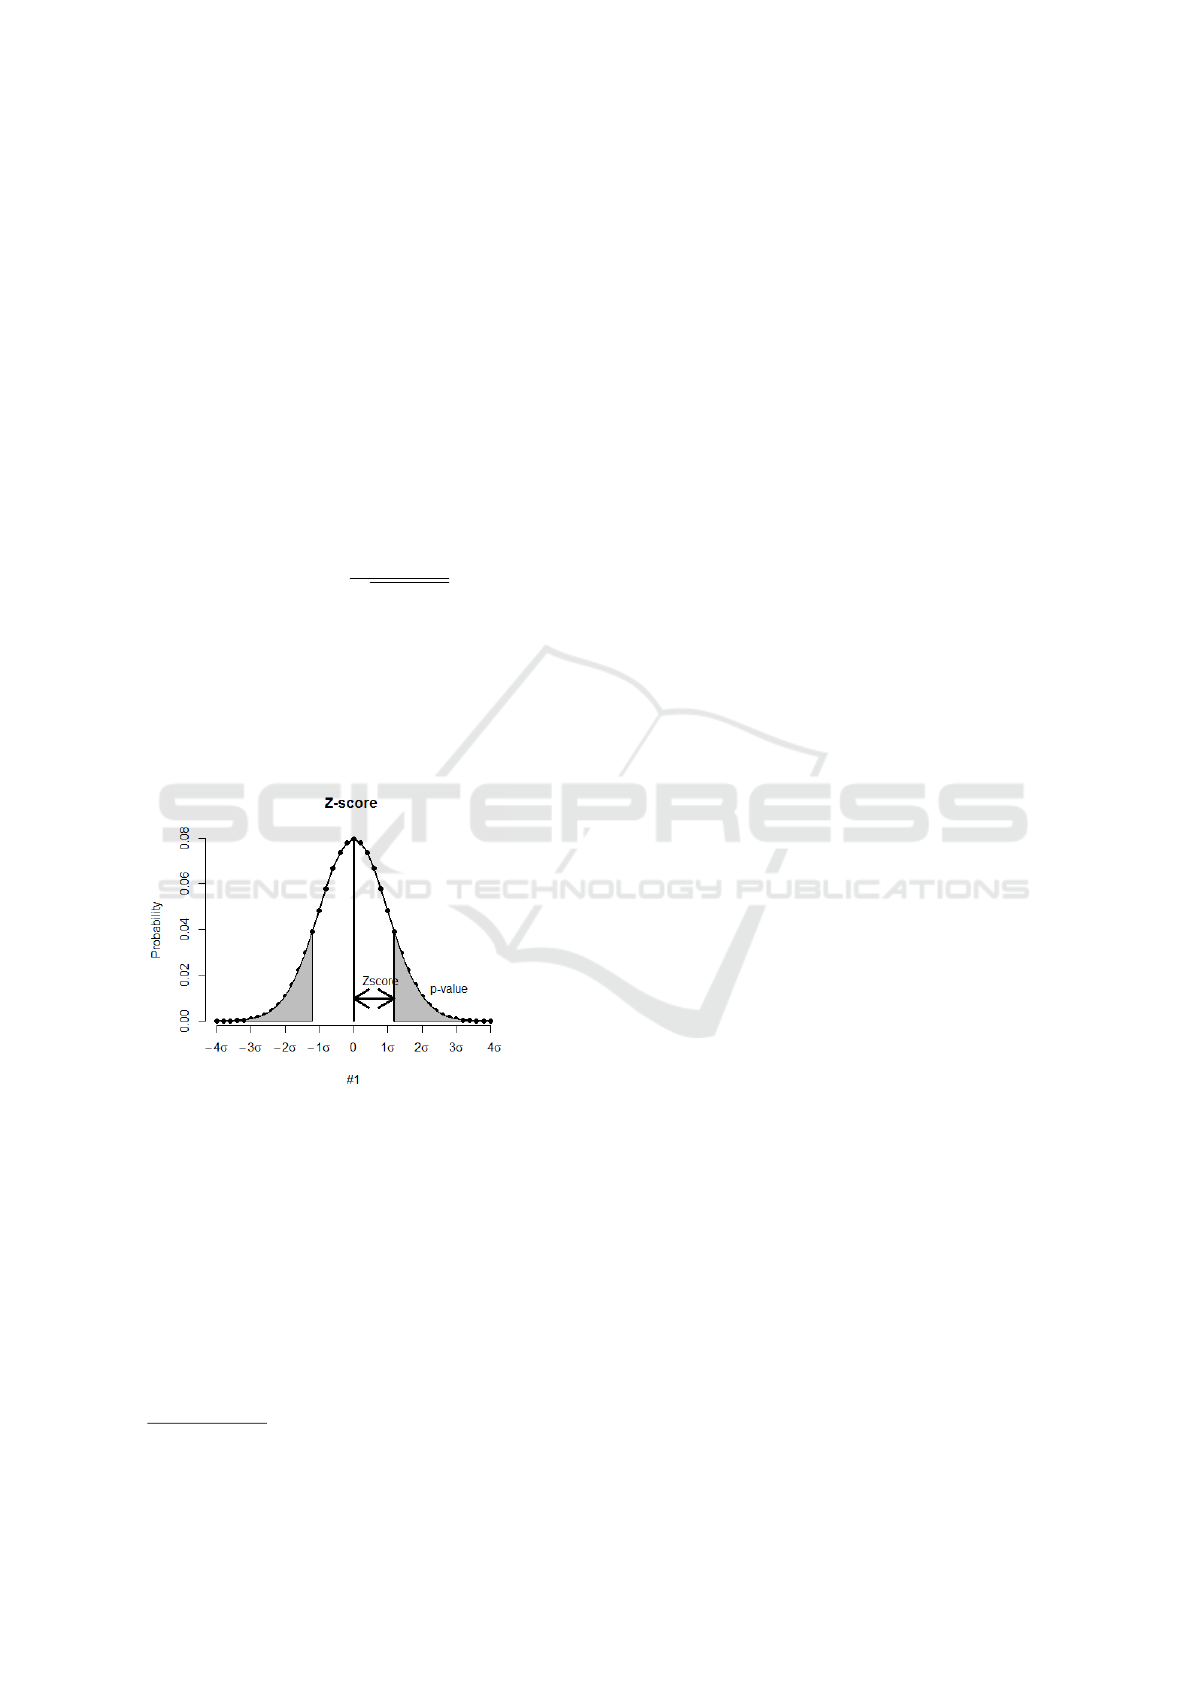
directly computed from the Z-score. Figure 3 illus-
trates the relation of a Z-score (standardly expressed
in the units of standard deviation x.σ) and the corre-
sponding p-value (area of two tails).
Figure 3: The relation of Z-score and p-value. Z-score is
expressed in the units of the standard deviation.
The symbol p denotes the probability that the re-
sult of boolean function f is equal to 1 for random in-
put. Symbol n denotes the number of non-overlapping
blocks (of m bits) in the analysed sequence (not the
number of bits). Similarly, as in the Monobit test, our
histogram consists of two frequencies #1 and #0 but
only #1 is computed (#0 = n −#1) and is used for the
evaluation. The only difference is that the expected
probability p is not p = 0.5. In general, p is arbitrary
value from the interval [0,1] which depends on the
given boolean function f . The Z-score and relevant
In most cases distribution D(x) is given.
statistical theory is discussed in Section 5 in more de-
tails.
Figure 4 illustrates our approach with the boolean
function f (x
1
, ··· , x
m
) = x
2
+x
89
+x
94
. Firstly, data to
be analyzed are divided to multiple non-overlapping
blocks. Then the number of results equal to one (#1)
is computed (blocks serve as the inputs for the func-
tion f ). The final result – Z-score is computed as
the statistical distance between observed and expected
number of ones (#1).
To perform the test, we have to compute only
#1 and the expected probability p (as the p changes
with the function f ). The algorithm for the compu-
tation of p is described in Section 3.5. We may omit
the computation of the p-value since the strength of
distinguishers can be compared directly using their
Z-scores. The bigger Z-score is the stronger distin-
guisher is obtained and vice versa.
3.3 Distinguisher Construction
Our approach assumes that stronger and more com-
plex distinguishers can be obtained as a combination
of the weaker and simpler ones. This assumption is
natural in a sense that if this would not be true we
have to find more complex distinguishers by brute
force anyway. As we start with a test of the sim-
pler candidate distinguishers first, we naturally ob-
tain the simplest possible yet strong enough distin-
guisher. The potentially stronger, but more complex
distinguishers are evaluated later. We work with the
boolean functions of m variables for some fixed m.
The construction is iterative. We first start with the
simplest boolean functions f (x
1
, ··· , x
m
) = x
i
for i ∈
{1, 2, ··· , m} and construct more and more complex
(more monomials, higher degree) functions. Since we
want to find the weakness (biased bits) in the out-
put of a tested cryptographic function, the number
of variables m of a boolean function should corre-
spond with the size of function’s output. Therefore,
the value of m is set to m = 128 or to its small mul-
tiple 256, 384, 512 to match frequent block sizes used
in common cryptographic functions. For such small
values of m, we can check all such simple boolean
functions by brute force. The construction is divided
into two phases:
1. Firstly, the set S of k strongest and simple distin-
guishers is found: We search through the set of
monomials (x
i
, x
i
.x
j
, x
i
.x
j
.x
k
) of small degree ≤
deg since a total number of functions raise expo-
nentially with the degree. We assess the strength
of all monomials and set S of strongest (biggest Z-
score) t distinguishers (|S| = t) is sent to the next
phase.
The Efficient Randomness Testing using Boolean Functions
97
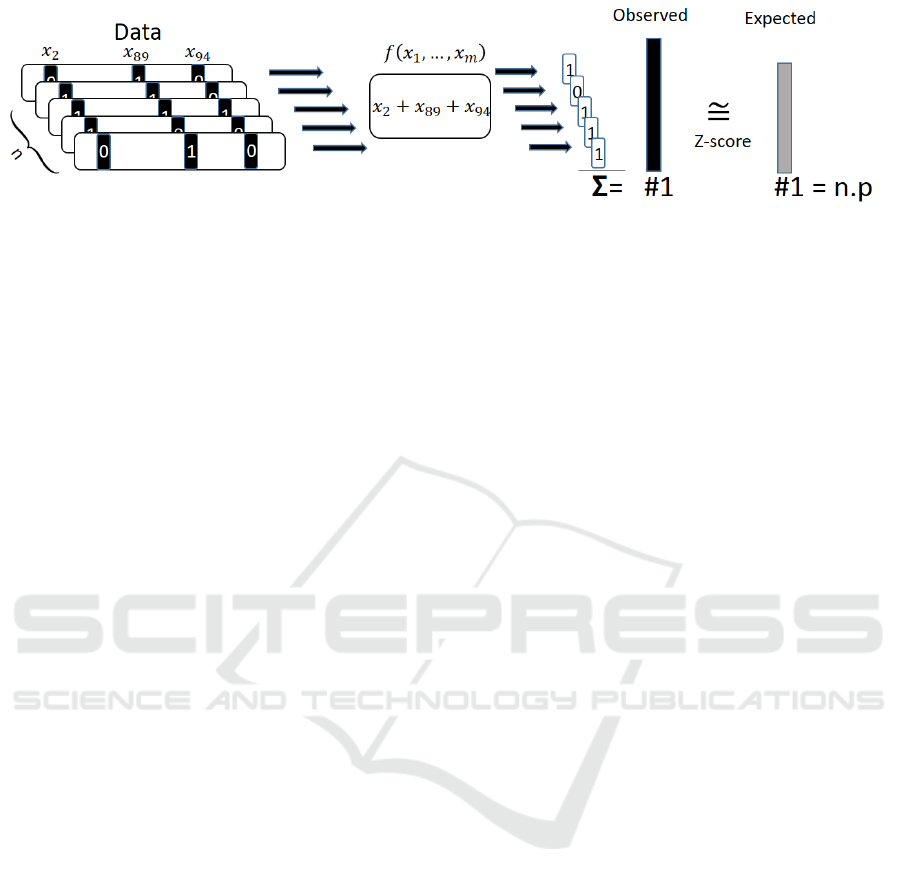
Figure 4: Our approach and the computation of Z-score using boolean function f (x
1
, ···, x
m
) = x
2
+ x
89
+ x
94
. Z-score is
computed as the statistical distance of observed #1 for tested data and #1 = p.n expected for truly random data.
2. In the second phase, we construct more com-
plex distinguishers: The simple distinguishers (el-
ements of S from the first step) are combined us-
ing the addition (XOR) operator. We construct all
possible functions in the form of f (x
1
, ··· , x
m
) =
b
1
+ b
2
+ ···+ b
k
such that b
i
∈ S and k is fixed.
The advantage of the described process is that the
simple boolean functions are tested first and if the suf-
ficiently strong distinguisher (large Z-score) is found
the process can be terminated at any point. Moreover,
construction of complex boolean function from sim-
pler allows reusing the intermediate results (distribu-
tion of ones and zeroes) computed in the earlier stages
to significantly improve the entire performance.
3.4 Implementation Details
A result of the boolean function f (x
1
, ··· , x
m
) can
be computed efficiently using fast bitwise operators
AND and XOR. Moreover, these operators allow us
to compute 32, 64 or 128 results at once (based on the
CPU architecture and the instruction set). The prin-
ciple follows the way how the distinguisher is con-
structed. We firstly compute “basis” of results for the
simple boolean functions when applied to all input
blocks (of m-bits) of a given sequence. Then the basis
vectors are used to compute results for the arbitrary
complex boolean function applied to the same inputs.
• Firstly, a “basis” of results is constructed. For
each variable x
i
, i ∈ {1, ··· , m} we fill the basis
vector X
i
(bit vector) by results of boolean func-
tion f
i
(x
1
, ··· , x
m
) = x
i
when applied to all input
m-bit blocks of the tested data.
• The vector of all results X
f
of the function f can
be computed using our vector basis X
i
in the same
way as result of f is computed using x
i
. In fact, to
compute the vector of all results it suffices to per-
form same operations with vectors X
i
instead of
x
i
where AND and XOR are operators of boolean
vectors now. The basis vectors are packed into
words for more efficient computation.
The principle can be illustrated on the follow-
ing example. Let assume that we want to compute
64 results of the boolean function f (x
1
, x
2
, x
3
, x
4
) =
x
1
x
2
+ x
3
for 64 blocks B
i
each having 4-bits. We
firstly compute basis bit-vector X
i
that represents re-
sults (64 bits) of boolean function f
i
(x
1
, x
2
, x
3
, x
4
) = x
i
applied to all blocks B
i
. Vector of results X
f
for the
function f (applied to B
i
) can be computed as
X
f
= (X
1
AND X
2
) XOR X
3
for operators AND,XOR working with bit-vectors.
The vector of results X
f
can be computed using just
two bitwise operations working with 64-bits words.
The longer sequences should be divided into words of
64 bits.
In our approach, boolean functions of a small de-
gree and with the small number of monomials (t) are
constructed. Therefore vectors X
i
, X
i, j
= X
i
AND X
j
corresponding to functions x
i
, x
i
.x
j
are fully pre-
computed and used as the basis for result computa-
tion.
3.5 On the Computation of Expected p
Determining p, i.e., the probability of evaluating
polynomial f to 1 under the null hypothesis that tested
data are random, is equivalent to finding all variable
settings under which f evaluates to 1. This problem
is exponentially complex with the size of the f .
Let p
i
be the probability of x
i
evaluating to one,
P( f ) the probability of f evaluating to 1 under all pos-
sible settings. The basic cases are:
1. P(x
i
x
i+1
···x
i+k−1
) = p
i
p
i+1
···p
i+k−1
= 2
−k
2. P(x
i
+ x
j
) = p
i
(1 − p
j
) + (1 − p
i
)p
j
3. P(x
i
+ x
j
+ x
k
) = P((x
i
+ x
j
) + x
k
) using associa-
tivity and the rule 2.
Using these rules it is easy to determine P( f ) for
a general polynomial in algebraic normal form (ANF)
in linear time w.r.t. a number of variables (under the
assumption of disjoint terms). However, the evalua-
tion is more time-consuming if the terms are depen-
dent as the relations above do not hold. The solution
SECRYPT 2017 - 14th International Conference on Security and Cryptography
98

for the problem with dependent terms requires to eval-
uate a polynomial for all possible variable settings,
then count the number of cases where f (x) = 1 and
finally compute resulting P( f ). This time complex-
ity of the algorithm is exponential with respect to the
number of variables.
We use few tricks to reduce the computation time.
Let denote f = b
1
+ b
2
+ ···b
k
, where b
i
=
∏
deg
j=1
x
j
is a term of degree deg. If deg( f ) = 1 the rule 1 is
used. In case of dependent terms we fall-back to na
¨
ıve
algorithm – evaluate f in all settings.
As example, lets examine the polynomial f
1
=
x
1
x
2
x
3
+ x
1
x
5
x
6
+ x
7
x
8
x
9
. Using na
¨
ıve approach the
f
1
is evaluated 2
8
times. With the closer look it can
be evaluated as: P((b
1
+ b
2
) + b
3
), as b
3
is indepen-
dent of other terms so whole evaluation is done only
in 2
5
steps and one rule 2 application. To generalize
this trick we just need to compute dependency com-
ponents between terms b
i
.
The terms b
i
, b
j
are dependent if b
i
∩b
j
6=
/
0, i.e.,
they share at least one variable. The trick is to apply
the na
¨
ıve algorithm to all dependent components of
the polynomial, then merge the components using
rules 2, 3 as they are pairwise independent.
Component finding is implemented with Union-
Find algorithm with complexity O(α(n)) which
yields the resulting complexity O(n α(n)). To fur-
ther optimize the evaluation, we can convert the in-
put polynomial to a canonical form by renumbering
the variables and sorting the terms. E.g. x
60
x
120
x
48
→
x
1
x
2
x
3
. Then by caching previous computations (e.g.,
LRU), we can avoid some expensive computations
in a dependent component evaluation. Another op-
timization is to use pruning and recursive application
of the rules above when evaluating dependent com-
ponents. Consider b = x
1
x
2
x
3
+ x
1
x
5
x
6
. In branch
x
1
= 0 we directly have b = 0 thus all evaluation
sub-branches are pruned. In branch x
1
= 1 we have
b
0
= x
2
x
3
+ x
5
x
6
. By applying the algorithm recur-
sively, we see x
2
x
3
, x
5
x
6
are independent and no na
¨
ıve
algorithm is used, only rules 1, 2, 3.
We use polynomials and terms of a small degree
so we don’t use optimization with pruning and LRU
caching as evaluating terms by the na
¨
ıve algorithm is
faster with this sizes. The overall benefit is the fast de-
pendent component detection in practice, the vast ma-
jority of polynomials have independent terms which
yield very fast P(f ) computation, in O(n α(n)).
4 THE RESULTS
To demonstrate the practical usability of proposed
approach, we tested the approach on a variety of
cryptographic primitives – hash functions, block and
stream ciphers and (pseudo-) random number gener-
ators (PRNG). The results are compared with the ex-
isting automated approaches utilized by the random-
ness statistical test batteries NIST STS, Dieharder and
TestU01. The data used for analysis were generated
as keystream for stream ciphers or encrypted/hashed
incremental counter for block ciphers and hash func-
tion with random fixed key used.
4.1 Parameters of Boolean Functions
Our approach is parameterized by the parameters
deg, m, t and k. We search for the distinguisher with
m variables and of k monomials each with degree
of deg. The parameter t represents the number of
best monomials used to construct distinguisher in the
second phase (as described in Section 3.3). For in-
stance, parameters deg = 2, m = 4,t = 128, k = 3
means that we searched for 128 strongest distinguish-
ers (boolean functions) of the form f (x
1
, x
2
, x
3
, x
4
) =
x
i
.x
j
for different x
i
, x
j
∈ {x
1
, x
2
, x
3
, x
4
} in the first
phase. In second phase we combine every k-tuple
of them to find the strongest distinguisher of the
form f (x
1
, x
2
, x
3
, x
4
) = x
i
.x
j
+ x
k
.x
l
+ x
r
.x
s
among
the all possible combinations. We tested data pro-
duced by various crypto functions with various set-
tings. We used the combination deg, m,t, k where
deg ∈ {1, 2, 3}, m ∈ {128, 256, 384, 512}, t = 128, k ∈
{1, 2, 3}.
4.2 Common Cryptographic Functions
In order to compare our results with the standard
batteries, we tested the data also with NIST STS,
Dieharder and TestU01 test suites (Alphabit, Block-
Alphabit, Rabbit, small Crush). The Table 1 summa-
rizes the results and strength of tools according to a
number of rounds for which deviation from distribu-
tion expected for random data (null hypothesis) is de-
tected by the respective tool for 100MB of data. We
consider data fails a battery if it fails one of its tests
with the conservative significance level set to α = 1%.
The Table 1 shows the best results of our tool ob-
tained for two particular settings Bool1(deg = 2, k =
1, m = 384) and Bool2(deg = 2, k = 2, m = 512). In
15 out of 24 functions tested, BoolTest was able to de-
tect non-randomness in stream produced by the same
number of rounds in round-reduced cryptographic
functions when compared to NIST STS. The more
and fewer rounds were distinguished for Keccak,
MD6, TEA and DCH, Decim, Grain, JH, Salsa20,
TSC-4 functions respectively.
It should be noted that BoolTest was able to find
The Efficient Randomness Testing using Boolean Functions
99

Table 1: The number of rounds (of selected primitives and
PRNGs) in which non-randomness was detected for 100MB
data for NIST STS (NI), Dieharder (Di) and TestU01 (U01).
Our approach is presented for two well performing settings
Bool1(deg = 2, k = 1, m = 384) and Bool2(deg = 2, k =
2, m = 512). Character ’<’ means that more rounds were
distinguished by boolean function found with other param-
eters than two presented.
function NI Di U01 Bool1 Bool2
AES 3 3 3 3 3
ARIRANG 3 3 4 3 3
AURORA 2 2 4 2 2
BLAKE 1 1 1 1 1
Cheetah 4 4 6 4 4
CubeHash 0 0 1 0 0
DCH 2 2 2 1 1
Decim 6 6 6 5 5
Echo 1 1 1 1 1
Grain 3 2 2 2 2
Grostl 2 2 2 2 2
Hamsi 0 0 0 0 0
JH 7 6 9 6 6
Keccak 2 3 4 3 3
Lex 3 3 3 3 3
Lesamta 2 3 3 2 2
Luffa 7 7 7 7 7
MD6 8 8 9 9 8
SHA256 4 4 3 3 4
Simd 0 0 0 0 0
Salsa20 6 4 6 <4 <4
TEA 3 4 4 4 4
TSC-4 13 12 13 <13 <13
Twister 6 6 7 6 6
boolean functions with other parameters than Bool1
and Bool2 capable of detecting non-randomness of
TSC-4 reduced to 14 rounds and Salsa20 with 4
rounds, but performing same or worse on the remain-
ing configurations.
The second practically important property of any
test is the least amount of data necessary to spot the
bias if present. We tested and compared the per-
formance of BoolTest with statistical batteries using
10MB, 100MB, and 1GB of input data. The results
are summarized in the Table 2.
For test suites, the number of passed tests are
shown. The computed Z-scores are shown for the
BoolTest and two best settings according to given a
set of analysed functions. The results of BoolTest and
test suites which can be interpreted as detected non-
randomness (null hypothesis rejected) are highlighted
in gray. Based on the results, we can conclude that test
based on boolean functions usually requires an order
of magnitude fewer data to detect bias than common
batteries.
Table 2: Results of NIST STS (NI), Dieharder (Di),
TestU01 (U01) and our approach with two settings
Bool3(deg = 1, k = 2, m = 384, t = 128) and Bool4(deg =
1, k = 2, m = 512,t = 128) obtained for 10MB, 100MB and
1GB of data produced with primitives with limited number
of rounds.
size func NI Di U01 Bool3 Bool4
10MB
AES (3) ∀ 18 15 8.6 6.7
TEA (4) ∀ 20 ∀ 20.6 11.5
Keccak (3) ∀ ∀ 15 3.7 5.3
MD6 (9) ∀ ∀ ∀ 3.9 13.3
SHA256 (3) 0 0 6 88.7 242
100MB
AES (3) ∀ 16 15 8.9 15.0
TEA (4) 14 21 ∀ 73.6 5.2
Keccak (3) 14 22 15 3.8 9.2
MD6 (9) ∀ ∀ ∀ 3.7 26.4
SHA256 (3) 0 0 4 50.7 828
1GB
AES (3) 9 18 14 12.8 41.2
TEA (4) 13 24 ∀ 127 4.3
Keccak (3) ∀ 26 15 3.5 32.0
MD6 (9) 13 25 15 4.1 26.4
SHA256 (3) 0 1 3 78.0 3043
4.3 Pseudo-random Number
Generators
The proposed approach was tested on several com-
monlyused non-cryptographic pseudo-random num-
ber generators (PRNGs): Mersenne Twister 19937,
Multiply-with-Carry C++ generator, Ranlux24, T800,
TT800 from TestU01 and C stdlib rand() and Java
java.util.Random. The practical distinguishers were
found for the last two generators (as discussed below)
and no distinguisher was found for any tested parame-
ters and data sizes up to 1 GB for the remaining ones.
Using BoolTest, we were able to find universal dis-
tinguishers i.e., which work for large groups of PRNG
seeds, for C stdlib rand() and Java java.util.Random
( C rand, Java rand in short). We tested BoolTest on
1000 different bit streams generated by the C rand
respectively, each bit stream generated by using a dif-
ferent random seed from the interval [0, 2
32
−1].
Let define an input bit stream as τ
i
and the best
distinguisher and its corresponding Z-score value
for τ
i
returned by BoolTest as (ξ
i
, δ
i
). Figures
5 and 6 depict the set of the best distinguishers
ξ
i
∈ {f
1
, f
2
, f
3
, f
4
, f
5
, f
6
} and their Z-scores found by
BoolTest on input bit streams τ
1
, . . . , τ
1000
. In order
to emphasize the Z-score deviation polarity each dis-
tinguisher has the Z-score results are split into two
box plots, for positive and negative Z-scores values.
The number of occurrences of the distinguisher f
+
1
is
|f
+
1
| = |{i;ξ
i
= f
1
∧δ
i
≥ 0}|. E.g., the f
−
1
column
represents all the Z-score values δ
i
< 0 where ξ
i
= f
1
and the f
+
1
column represents δ
i
≥ 0 where ξ
i
= f
1
.
Note for the C rand the deviation is only positive
while for Java Random it is usually symmetric.
f
1
, f
2
, f
3
, f
4
, f
5
, f
6
are particular boolean functions.
SECRYPT 2017 - 14th International Conference on Security and Cryptography
100

●
●
●
●
●
●
●
f
1
+
f
2
+
18
20
22
18
19
20
21
22
distinguisher
Z−score
f
1
= x
71
x
319
+ x
295
x
379
f
2
= x
88
x
375
+ x
127
x
351
Figure 5: The best distinguishers, C rand(), 1000 x 1 MB
data samples, 384 bit block, random 32 bit seed, Ubuntu
16.04. The best distinguisher occurrences in 1000 tests:
|f
+
1
| = 520, |f
+
2
| = 480.
●
f
5
−
f
5
+
f
6
−
f
3
−
f
3
+
f
4
−
f
4
+
14.0
14.5
15.0
15.5
−16.0
−15.5
−15.0
−14.5
−14.50
−14.25
−14.00
−13.75
12.5
15.0
17.5
20.0
22.5
25.0
13.84
13.88
13.92
13.96
−22.5
−20.0
−17.5
−15.0
−12.5
−15.00
−14.75
−14.50
−14.25
distinguisher
Z−score
|f
−
3
| = 352, |f
+
3
| = 374, |f
−
4
| = 48, |f
+
4
| = 86
|f
−
5
| = 45, |f
+
5
| = 63, |f
−
6
| = 32, |f
+
6
| = 0
f
3
= x
38
x
326
+ x
39
x
327
+ x
326
x
486
f
4
= x
38
x
326
+ x
205
x
327
+ x
326
x
486
f
5
= x
38
x
326
+ x
326
x
486
+ x
327
x
359
f
6
= x
38
x
326
+ x
167
x
327
+ x
326
x
486
Figure 6: The best distinguishers, Java Random, 1000 x 1
MB data samples, 512 bit block, random 32 bit seed. Java
OpenJDK 1.8.0 121, Oracle Java 1.7.0 6, 1.8.0 65.
2
3
4
6
8
12
16
24
32
48
64
16k 32k 64k 128k 256k 512k 1024k 2048k 4096k 8192k
data size
z−score
Figure 7: The size of the input bit stream vs. |Z-score| us-
ing distinguishers {f
3
, f
4
, f
5
, f
6
} for Java Random, 1000
random seed samples per data size category. Dashed line
represents ref. Z-score value for the test.
The distinguishers from the Figure 6 were discov-
ered with the parameters (deg = 3, k = 3, m = 512).
In this setting the BoolTest examined input bit stream
of increasing sizes: {19200, . . . , x
j
, 2x
j
, . . . , 300 ·
1024
2
} bytes and found {f
3
, f
4
, f
5
, f
6
} distinguish-
ers after examining 37.5 MB bit stream. In the
previous iterations with smaller input bit stream
only weak distinguishers were found. When
using different settings (deg, m, k) ∈ {{1, 2, 3} ×
{128, 258, 384, 512}×{1, 2, 3}} we were able to find
only weaker distinguishers which required signifi-
cantly more data to achieve the same Z-score. In-
terestingly, {f
3
, f
4
, f
5
, f
6
} we discovered after exam-
ining 37.5 MB bit stream work very well also for
smaller data sizes, as depicted on figure 3.
It is evident there exists a good distinguisher of
a low degree exists for Java Rand but due to top-
heuristics the BoolTest was not able to find it with
other combinations rather than (deg = 3, k = 3, m =
512) and the particular size of the data. The utiliza-
tion of suitable optimization methods like genetic al-
gorithms could lead to stronger distinguishers also for
other tested functions.
Note that once the universal distinguisher for a
tested function is found, the application on data pro-
duced by this function is straightforward and requires
only small amount of data produced. The Table 3
compares the BoolTest performance for tested PRNGs
with standard test suites.
Table 3: Results of NIST STS (NI), Dieharder (Di), Test
U01 (U01) and BoolTest obtained for 1MB, 10MB and
100MB of data. ∀ means all tests passed, fraction means
number of tests passed from the total number. BoolTest col-
umn represents an average of |Z-score| values produced by
the best distinguishers {f
1
, f
2
, f
3
, f
4
, f
5
, f
6
} on 1000 ran-
domly seeded input bit streams.
size func NI Di U01 BoolTest
1MB
c - ∀ ∀ 19.67
java - ∀ ∀ 17.78
10MB
c ∀ ∀ ∀ 60.92
java ∀ ∀ ∀ 55.98
100MB
c ∀ 22/23 ∀ 191.37
java ∀ ∀ 15/16 176.62
5 THE STATISTICAL
INTERPRETATION
The result of BoolTest is the maximal Z-score com-
puted within a set of boolean functions. The inter-
pretation of Z-score for a single boolean function is
simple and straightforward. Z-score is normally dis-
tributed random variable and p-value can be com-
puted directly from it. However, the computation of
The Efficient Randomness Testing using Boolean Functions
101

p-value from the maximal Z-score (Z-SCORE) com-
puted by our tool is more complicated. In this Section,
we describe the Z-score, the p-value and the statistical
theory related to our approach. Afterward, we discuss
interpretations of the result of BoolTest based on ref-
erence results computed for random data.
5.1 P-value and Z-score
The p-value represents the probability that more ex-
treme results are obtained (for the true hypothesis)
than we observed (s
obs
). In our case, p-value rep-
resents the probability that a perfect random number
generator would produce less random sequences than
the sequence being tested. P-value is computed from
the observed test statistic s
obs
and the reference distri-
bution D or its close approximation. The null distribu-
tion of many tests is binomial distribution B(n, p). It
is approximated well (for n > 10p and n.(1− p) > 10
) by normal distribution N (µ, σ
2
) (Wackerly et al.,
2002). Normal distribution is symmetric around mean
µ and therefore p-value is computed as an area under
bell curve in both tails (see Figure 3). Sometimes Z-
score is computed instead of p-value since they are
related
p-value = er f c
Z-score
√
2
(Chevillard, 2012) and computation of Z-score is sim-
pler and faster. The Z-score represents the distance
from the mean µ in units of σ. The binomial dis-
tribution B(n, p) is approximated by N (µ, σ
2
), with
the parameters µ = np and σ
2
= np(1 − p) (Sheskin,
2003) i.e. Z-score of binomially (B(n, p)) distributed
#1 is computed as
Z-score =
#1 − pn
p
p(1 − p)n
=
#1 −µ
σ
.
Table 4: The mean (µ) of maximal Z-SCORE computed
by BoolTest for various settings k, deg ∈ {1, 2, 3}, m ∈
{128, 256, 384, 512} and t = 128.
deg 1 2 3
m \ k 1 2 3 1 2 3 1 2 3
128 2.84 3.89 4.73 3.97 5.26 6.57 4.74 5.76 7.61
256 3.01 4.23 5.16 3.92 5.66 7.11 4.78 6.12 8.29
384 3.14 4.42 5.32 3.92 5.82 7.44 4.79 6.22 8.58
512 3.24 4.56 5.52 3.98 6.02 7.68 4.83 6.30 8.81
5.2 Maximal Z-score
In order to interpret results (Z-SCORE) of our tool
we have to find their distribution for the null hypoth-
esis i.e. random data. The value of Z-SCORE is
determined by the boolean functions constructed in
two phases. Final Z-SCORE is computed as a max-
imal Z-score within a set of boolean functions con-
structed in the second phase according to used set-
ting deg, m, k, t. The theoretical assessment of the
null distribution of Z-SCORE (for our tool) is diffi-
cult task in general, since it should follow the pro-
cess of the construction of best distinguisher. The
problem can be illustrated on the simplest combi-
nation of parameters deg = 1 and k ∈ {1, 2, 3, ···}.
Distribution D of Z-SCORE for deg = k = 1 can be
obtained as distribution of maximum of t indepen-
dent normal variables. Function er f c(x) represents
the cumulative distribution function (cdf) of normal
variable N (0,0.5). For t independent variables with
the same cdf er f c(x), the cdf of their maximum (i.e.
Z-SCORE) is the function er f c(x)
t
which is deter-
mined only by t. Distribution D can be computed as
the derivation t.er f c(x)
t−1
.er f c
0
(x) with er f c
0
(x) to
be a probability density function of nomal variable
∼ N (0, 0.5). Due to exponent t it is clear that D has
smaller variance than N (0, 0.5) i.e. values are closer
to mean which is still hard to express. For deg = 1
and k = 2 the boolean functions are dependent since
some of them share monomials. This problem grows
with the increasing of deg, k,t. The simplest solution
is to find D using the simulation on random numbers.
We performed experiment to compute the mean and
the standard deviation to identify the reference distri-
bution of Z-SCORE for random data. We tested data
produced by AES with 10 rounds for selected set-
tings k, deg ∈ {1, 2, 3}, m ∈ {128, 256, 384, 512} and
t = 128. We firstly confirmed that value of Z-SCORE
does not depend on size of data analysed. Than we
tested all combination of parameters and computed
for each setting 100 maximal Z-scores. The value of
the mean for each setting is shown in the Table 4. We
also computed the standard deviation for all settings.
In all cases the standard deviation was smaller than
0.4. To interpret the result one can use mean µ (corre-
sponding to used parameters) from the table and “nor-
malize” the Z-SCORE. Our normalized Z-SCORE has
smaller standard deviation than 0.4 and therefore p-
value can be bounded as:
p-value ≤ er f c
Z-SCORE −µ
√
2
.
This means that real p-value is smaller than p-value
corresponding to Z-SCORE for normal distribution.
6 CONCLUSION
The paper introduces a new class of tests for statisti-
cal detection of non-randomness in an output of cryp-
tographic functions and random generators. The test
SECRYPT 2017 - 14th International Conference on Security and Cryptography
102

called BoolTest is based on boolean functions. Our
approach was evaluated on more than 20 real world
cryptographic functions with results comparable to
commonly used statistical batteries like NIST STS or
Dieharder. The test runs significantly faster than men-
tioned batteries and usually requires order of magni-
tude less data.
Additionally, the bias spotted is directly inter-
pretable as a relation between several fixed output
bits of the analyzed function. The BoolTest can be
used as a fast alternative to existing batteries and/or
to complement its results. The direct interpretability
of a boolean function based distinguisher adds benefit
for human cryptologist interested in the more detailed
analysis of weakness present in a inspected crypto-
graphic function.
The future work will address boolean functions of
higher degree and with more components. The brute-
force examination of boolean functions used in this
work can be practically performed only for the de-
gree up 3 and with no possibility to evaluate all com-
bination of two or more components. The adaptive
learning methods may be used for selection of viable
candidates for combination from the initial pool of all
possible simple functions.
ACKNOWLEDGEMENTS
We acknowledge the support of the Czech Science
Foundation, project GA16-08565S. The access to the
computing and storage resources of National Grid
Infrastructure MetaCentrum (LM2010005) is greatly
appreciated.
REFERENCES
Bard, G. V. (2009). Algebraic Cryptanalysis. Springer Pub-
lishing Company, ISBN 978-0-387-88756-2.
Brown, R. G., Eddelbuettel, D., and Bauer, D. (2013).
Dieharder: A random number test suite 3.31.1.
http://www.phy.duke.edu/ rgb/General/dieharder.php.
Chevillard, S. (2012). The functions Erf and Erfc computed
with arbitrary precision and explicit error bounds. In
Academic Press, Inc., Information and Computation,
volume 216, pages 72–95. Academic Press, Inc.
EACirc (2017). EACirc project.
https://github.com/CRoCS MUNI/EACirc.
Englund, H., Johansson, T., and S
¨
onmez Turan, M. (2007).
A framework for chosen IV statistical analysis of
stream ciphers. In INDOCRYPT 2007, pages 268–
281. Springer Berlin Heidelberg.
Filiol, E. (2002). A new statistical testing for symmetric ci-
phers and hash functions. In ICICS 2002, pages 342–
353. Springer Berlin Heidelberg.
Garrett, A., Hamilton, J., and Dozier, G. (2007). A com-
parison of genetic algorithm techniques for the crypt-
analysis of TEA. In International journal of intelli-
gent control and systems, volume 12, pages 325–330.
Springer.
Hern
´
andez, J. and Isasi, P. (2004). Finding efficient dis-
tinguishers for cryptographic mappings, with an ap-
plication to the block cipher TEA. In Computational
Intelligence, volume 20, pages 517–525. Blackwell.
Heys, H. M. (2002). A tutorial on linear and differential
cryptanalysis. In Cryptologia, volume 26, pages 189–
221, Bristol, PA, USA. Taylor & Francis, Inc.
Kaminsky, A. and Sorrell, J. (2014). Cryp-
tostat, a bayesian statistical testing
framework for block ciphers and macs.
http://www.cs.rit.edu/ ark/students/jls6190/report.pdf.
L’Ecuyer, P. and Simard, R. (2007). TestU01: A C library
for empirical testing of random number generators. In
ACM Trans. Math. Softw., volume 33, New York, NY,
USA. ACM.
Marsaglia, G. (1995). The Marsaglia random number
CDROM including the diehard battery of tests of ran-
domness. http://www.stat.fsu.edu/pub/diehard/.
Mouha, N. (2010). Ecrypt II: Tools for cryptography.
http://www.ecrypt.eu.org/tools/overview.
NIST (2001). FIPS 140-2 security requirements for crypto-
graphic modules. NIST.
Press, W. H., Teukolsky, S. A., Vetterling, W. T., and Flan-
nery, B. P. (2007). Numerical recipes 3rd edition:
The art of scientific computing. Cambridge Univer-
sity Press.
Rukhin, A. (2010). A statistical test suite for the valida-
tion of random number generators and pseudo ran-
dom number generators for cryptographic applica-
tions, version STS-2.1. NIST.
Sheskin, D. J. (2003). Handbook of parametric and non-
parametric statistical procedures. CRC Press, USA.
Stankovski, P. (2010). Greedy distinguishers and non-
randomness detectors. In INDOCRYPT 2010, LNCS
6498. Springer.
S
´
ys, M. and Klinec, D. (2017). Booltest
– tool for fast randomness testing.
http://crocs.fi.muni.cz/papers/secrypt2017.
S
´
ys, M.,
ˇ
Svenda, P., Ukrop, M., and Maty
´
a
ˇ
s, V. (2014).
Constructing empirical tests of randomness. In SE-
CRYPT 2014. ICETE.
Wackerly, D. D., III, W. M., and Scheaffer, R. L. (2002).
Mathematical statistics with applications. Duxbury
Advanced Series.
The Efficient Randomness Testing using Boolean Functions
103
