
On Smartphone-based Discrimination of Pathological Respiratory
Sounds with Similar Acoustic Properties using Machine Learning
Algorithms
Chinazunwa Uwaoma and Gunjan Mansingh
Department of Computing, The University of the West Indies, Kingston, Jamaica
Keywords: Smartphone, Machine Learning, Algorithms, Respiratory, Sound Analysis, Classification, Symptoms.
Abstract: This paper explores the capabilities of mobile phones to distinguish sound-related symptoms of respiratory
conditions using machine learning algorithms. The classification tool is modeled after some standard set of
temporal and spectral features used in vocal and lung sound analysis. These features are extracted from
recorded sounds and then fed into machine learning algorithms to train the mobile system. Random Forest,
Support Vector Machine (SVM), and k-Nearest Neighbour (kNN) classifiers were evaluated with an overall
accuracy of 86.7%, 75.8%, and 88.9% respectively. The appreciable performance of these classifiers on a
mobile phone shows smartphone as an alternate tool for recognition and discrimination of respiratory
symptoms in real-time scenarios.
1 INTRODUCTION
Respiratory sounds such as cough, sneeze, wheeze,
stridor, and throat clearing are observed as clinical
indicators containing valuable information about
common respiratory ailments. Conditions such as
Asthma, Vocal Cord Dysfunction (VCD), and
Rhinitis provoked by prolonged and vigorous
exercise, are often associated with these symptoms
which sometimes overlap; thus, making it difficult
for proper diagnosis and treatment of the underlying
ailment symptomized by the respiratory sounds.
Given the similarity of their acoustic properties, these
sounds at times, are conflated and misinterpreted in
medical assessment of patients with respiratory
conditions using conventional methods. Further, the
evaluation of these sounds is somewhat subjective to
physicians’ experience and interpretation, as well as
the performance of the medical device used for
monitoring and measurement (Aydore et al., 2009; El-
Alfi et al., 2013).
Several studies in recent times have proposed
different approaches for objective detection and
classification of respiratory sounds using
computerized systems. However, with improvement
on the storage and computational capabilities of
mobile devices, there is a gradual move from the use
of specialized medical devices and computer
systems to wearable devices for recording and
analysing respiratory sounds in real-time situations
(Larson et al., 2011; Oletic et al., 2014). Much
efforts have been focused on the analysis of
wheezing sounds given its clinical importance in the
evaluation of asthma, COPD and other pulmonary
disorders (Lin and Yen, 2014). Considerable
attention has also been given to physiological
mechanism and formation of other pathological
respiratory sounds such as stridor, cough, and
crackles (Pasterkamp et al., 1997; Larson et al.,
2011). At times these sounds appear together on the
same respiratory signal and their accurate detection
and classification remain subjects of interest to many
researchers (Ulukaya et al., 2015; Mazic et al., 2015;
Uwaoma and Mansingh, 2015).
Bronchial asthma wheezes and VCD stridor are
often confused in the preliminary diagnosis of
airways obstruction during physical exercise (Irwin
et al., 2013). Both sounds have been described as
continuous, high-pitched musical sounds. They also
exhibit periodicity in time domain given their
sinusoidal waveforms. However, stridor is said to be
louder and can be heard around the neck without the
aid of a stethoscope. Dominant frequencies are
between 100 - 1000Hz (Pasterkamp et al., 1997).
Wheeze on the other hand, originates from the
bronchia and it is mostly audible around the chest
422
Uwaoma, C. and Mansingh, G.
On Smartphone-based Discrimination of Pathological Respiratory Sounds with Similar Acoustic Properties using Machine Learning Algorithms.
DOI: 10.5220/0006404604220430
In Proceedings of the 14th International Conference on Informatics in Control, Automation and Robotics (ICINCO 2017) - Volume 1, pages 422-430
ISBN: 978-989-758-263-9
Copyright © 2017 by SCITEPRESS – Science and Technology Publications, Lda. All rights reserved
wall (Bohadana et al., 2014), with dominant
frequencies around 600Hz (Uwaoma and Mansingh,
2014). Other respiratory sounds heard in the events
of air passage obstruction or irritation include cough,
throat clearing, sneezing and sniffle. Unlike wheeze
and stridor, these categories of sounds are
percussive, transient, and have quasi-periodic wave
forms and short duration. Apart from audio
information of the symptoms, there are other factors
used in the differential diagnosis of exercised-
induced asthma and VCD such as the respiratory
phase of the sound occurrence
(Inspiratory/Expiratory/Biphasic), and the
reversibility of conditions (Pasterkamp et al., 1997;
Irwin et al., 2013; Bohadana et al., 2014). However,
these issues are not within the scope of this paper.
The study objective is to distinguish acoustic
properties of respiratory symptoms that correlate
with certain respiratory conditions induced by highly
intensive physical activity; using smartphone as a
platform for the analysis and classification of the
sounds. The approach focuses on time-domain and
frequency-domain analysis of these sounds. The
machine learning algorithms exploit the differences in
the energy content and variation, periodicity, spectral
texture and shape as well as localized spectral
changes in the signal frames. The extracted features
from the audio data analysis are fed into classifiers -
Random Forest, support vector machine (SVM), and
k-Nearest Neighbor (kNN). The classification
algorithms are performed on both individual domain
and combined domain feature sets. A leave-one-out
approach is used in the evaluation of the performance
of the classifiers for objective comparison of their
discriminatory abilities.
The next section of the paper describes the
methods used in audio data acquisition, pre-
processing and analysis techniques, and feature
extraction. Section 3 highlights the classification
algorithms and feature sets for the classifiers. In
section 4, the classification results and performance
evaluation are discussed. Section 5 is dedicated to
further discussions on our study approach as it relates
to existing work; while conclusion and application of
the results are provided in the last section.
2 METHODS
2.1 Sound Recordings and Datasets
The recordings used in this study are obtained from
different sources. The wheeze and stridor sounds are
collected under licensed agreement, from R.A.L.E
Lung repository (R.A.L.E Lung Sounds, n.d); with
each record pre-labelled by an expert physician. The
cough, throat clearing, and other sounds are
retrieved from another database – creative commons
licensed (FreeSounds n.d); while some of the sounds
are direct recordings from healthy individuals and
pathological subjects using the mobile phone
microphone. The dataset comprises of five categories
of sound including: wheeze, stridor, cough, throat
clearing, and a mixed collection of other sounds. By
visual inspection of the waveforms and audio
verification, all distinct segments of the audio
recordings containing the actual sounds are selected.
Given the varying length and sampling rate of the
recordings, the audios are down-sampled to 8000Hz
and segmented into equal length to ensure uniformity
and to lessen computational load on the mobile
device.
2.2 Signal Pre-processing and Analysis
The signal pre-processing steps include windowing
and digitization of each audio signal into frames of
equal length (128ms) with 87.5% overlap. The
signal frames are decomposed into spectral
components using the Discrete Short-Time Fourier
Transform (STFT) technique. Hamming window of
size N = 1024 was used to reduce spectral distortion
due to signal discontinuities at the edges of the
frames. The windowing and overlapping techniques
help to smoothen the spectral parameters that vary
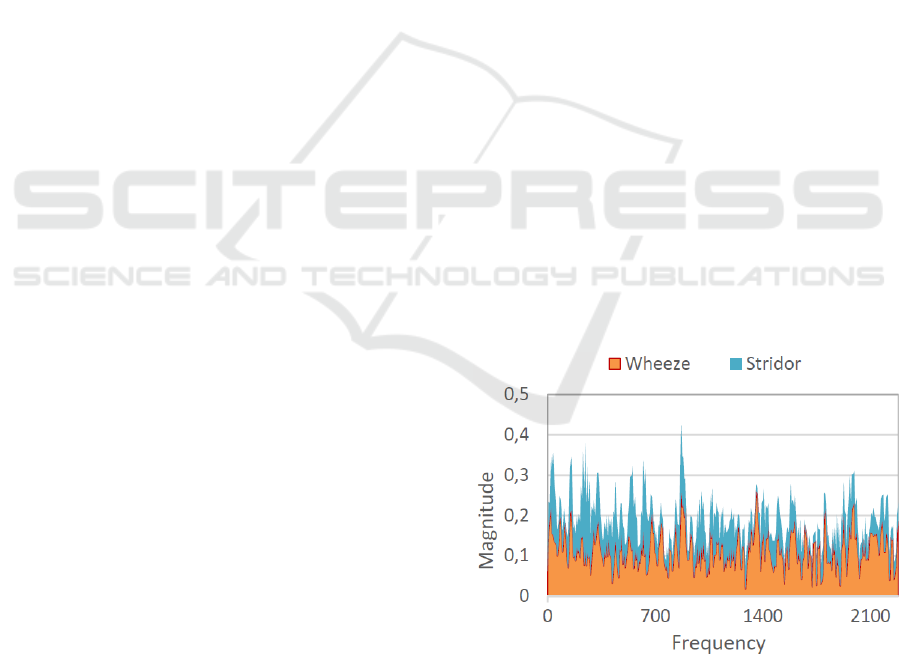
with time. Figure 1 shows the magnitude spectrum
of wheeze and stridor sounds.
Figure 1: Magnitude Spectrum of Wheeze and Stridor.
2.3 Feature Extraction
In preparing the feature sets for classification, we
employ two steps in the feature extraction. First, is
the frame-level extraction, where the resulting
On Smartphone-based Discrimination of Pathological Respiratory Sounds with Similar Acoustic Properties using Machine Learning
Algorithms
423
coefficients from signal windowing and spectral
analysis are used as parameters for calculating the
temporal and spectral features of the audio signals.
Time-domain features used include the RMS energy
and Zero Crossing Rate (ZCR) of each frame in the
audio record. The spectral features used in the
classification are described as follows:
2.3.1 Spectral Centroid (SC)
This feature measures the spectral shape of
individual frames and it is defined as the centre of
spectral energy (power spectrum). Higher values
indicate “brighter” or “sharper” textures with
significant high frequencies, while lower values
correspond to low brightness and much lower
frequencies. Given as the power spectrum of the
frame , and being the Nyquist frequency with
as the frequency bins; SC is calculated as:
∑
.
∑
(1)
2.3.2 Spectral Bandwidth (SB)
Also known as ‘instantaneous bandwidth’ (Lerch,
2012), SB technically describes the spread or
concentration of power spectrum around the SC. It is
a measure of ‘flatness’ of the spectral shape. Higher
values often indicate noisiness in the input signal
and hence, wider distribution of the spectral energy;
while low values show higher concentration of the
spectral energy at a fixed frequency region. SB is
calculated as follows:
∑
.
|
|
∑
(2)
2.3.3 Spectral Flux(SF)
Spectral Flux is an approximate measure of the
sensation ‘roughness’ of a signal frame (Lerch,
2012). It is used to determine the local variation or
distortion of the spectral shape and it is given by:
∑
1
(3)
The window-level features or texture features are
derived from the instantaneous features described
above. These features are basically statistical
functions of the frame-level features expressed in
terms of rate of change, extremes, averages, and
moments of grouped frames in the range of 2.5
seconds to 5 seconds of audio duration. Of particular
interest among the derived statistical properties used
in the audio discrimination is the Above -Mean
Ratio (AMR) (Sun et al., 2015). This metric is used
to differentiate high-energy frames from low-energy
frames in a signal window. It determines the ratio of
the high-energy frames by setting the parameter
alongside the mean RMS of the signal window as
threshold candidates; to separate different acoustic
events – continuous signal, discrete signals and
ambient noises. AMR is calculated as:
,
.
(4)
where is the signal window of the frames
(j = 1,
2... n), and
is the mean RMS of the frames in
the window. The indicator function is
evaluated to 1 if the argument is true and 0,
otherwise. Parameter α is empirically determined
and can be set within the values between 0.5 and 1
(Sun et al., 2015). Table 1 provides a full list of the
frame-level and window-level features used in the
classification.
Table 1: Classification Features.
Feature
Group
Descriptor Classification
Acronym
Frame Level
Energy Root Mean
Square
RMS
Periodicity Zero Crossing
Rate
ZCR
Spectral Shape Spectral
Centroi
d
SC
Spectral
Bandwidth
SB
Spectral Flux SF
Window Level
Extremes AMR of RMS
window
amrRMS
Relative Max
RMS [15]
rmrRMS
Averages Mean of RMS
window
meanRMS
Mean of SC
window
meanSC
Mean of SB
window
meanSB
Mean of SF
window
meanSF
Moments Variance of
RMS window
varRMS
Std. of ZCR
window
stdZCR
Mean Crossing
Irregularity [7]
mciZCR
Variance of SC
window
varSC
Variance of SB
window
varSB
ICINCO 2017 - 14th International Conference on Informatics in Control, Automation and Robotics
424

3 CLASSIFICATION
ALGORITHMS
In the experiment, three classifiers – Random Forest,
kNN, and SVM are used to investigate the
performance of the extracted input parameters in
differentiating the audio sound patterns. Each of the
classifiers represents a category of classification
algorithms often used in Machine Learning.
Whereas the SVM is a non-probabilistic binary
classifier that favours fewer classes, k-NN is an
instance-based algorithm that uses the similarity
measures of the audio features to find the best match
for a given new instance; while Random Forest is an
ensemble algorithm that leverages the desirable
potentials of ‘weaker’ models for better predictions.
We compare the discrimination abilities of the
classifiers using both individual domain feature set
and combined domain feature set. The classification
process involves the following steps:
3.1 Feature Selection
Best of the discriminatory audio features were
selected using two attribute selection algorithms
namely – Correlation Feature Selection (CFS) and
Principal Components Analysis (PCA). The original
feature set consists of 13 attributes as highlighted in
Table 1. However, the best first three features
selected by CFS were varRMS, stdZCR and varSB;
while the highest-ranking features according to PCA
were meanRMS, armRMS, meanSF, stdZCR and
varSF. This gives a total of 7 attributes in the
selected feature set. It is interesting to note that the
three features selected by CFS were good
representation of the audio properties we considered
earlier in the study. Whereas varRMS provides
information on the energy level of the audio signal,
stdZCR shows the periodicity, while varSB
represents the spread or flatness of the audio spectral
shape in terms of frequency localization.
3.2 Training and Testing
A smartphone-based classification model was built
for recognition and discriminating of respiratory
signals with related sound features. The experimen-
tal processes – STFT, Feature Extraction and
Classification were carried out on Android Studio
1.5.1 Integrated Development Environment (IDE).
With embedded Weka APIs, the classifier models
were programmatically trained on the mobile
devices running on Android 4.2.2 and 5.1.1, which
were also used to record some of the audios used to
evaluate the performance of the algorithms in real-
time. We opted to train the models directly on the
mobile devices rather than porting desktop-trained
models, due to serialization and compatibility issues
with android devices. Moreover, the response time
of building the model on the smartphone is faster
compared to the performance on the desktop. The
machine learning algorithms are trained by using the
statistical window-level features obtained from the
audio signal frames. Due to limited datasets, a
‘leave-one-out’ strategy for 10-fold cross validation
was used in the training and evaluation of the
performance of the classifiers and the selected
features. Statistical metrics used in the performance
evaluation were precision, recall and F-measure.
4 RESULTS
In this section, we discuss the results and
performance of the machine learning algorithms in
different scenarios. We also benchmark the real-time
performance of the mobile device in terms of CPU
and memory usage as well as execution/response
time of each of the modules in the entire process.
4.1 Performance of the Classifiers
In the evaluation of the classification process, we
presented different scenarios of the problem to the
classifiers, to understand the mechanisms of their
performances. First, we used two categories of
datasets – 2.5 seconds length and 5 seconds length
of the audio symptoms. The 2.5s length dataset has
a total of 163 records (Wheeze = 49, Stridor = 33,
Cough = 27, Clear-Throat = 26, Other = 28), while
the 5s dataset used in the classification consists of 99
instances in total. Though there were fewer instances
in the 5s datasets, the algorithms performed better on
this category than in 2.5s datasets as shown in Table
2. This implies that longer audio durations rather
than the number of instances provided the classifiers
with more information to learn about the audio
patterns.
Scaling the number of classes used in the
classification and adjustment of the algorithms’
parameters also had much impact on the
performance of the classifiers. From Table 2, we
observed that the SVM classifier performed much
better when we reduce the number of symptom
classes to two; and by increasing the complexity
parameter C, from 1.0 to 3.0, the classifier
performance improved by 4.6%. The kNN algorithm
On Smartphone-based Discrimination of Pathological Respiratory Sounds with Similar Acoustic Properties using Machine Learning
Algorithms
425
on the other hand, performed poorly with increased
number of classes but the performance improved
with higher number of features. For instance, setting
the parameter k to 1, gives an accuracy of 88.88 %
but drops to 53.98% when k is set to 5. In other
words, kNN does very well with fewer classes and
more features, as expected.
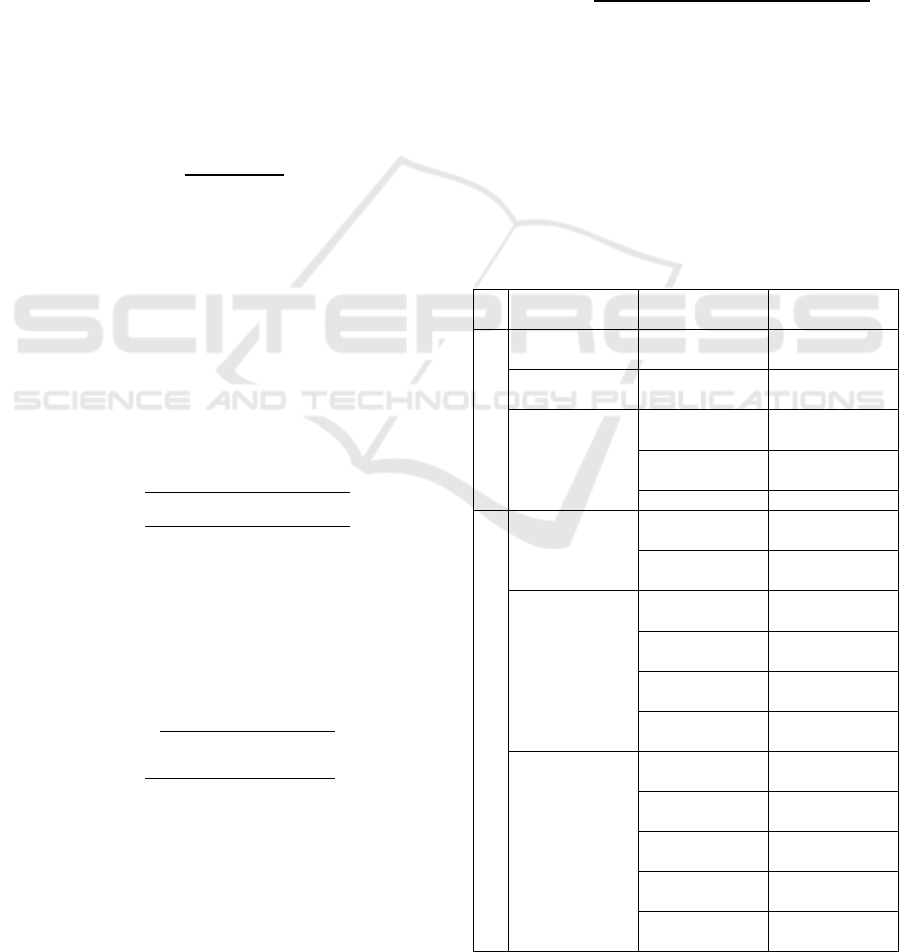
We examined two groups of classes whose
elements are often conflated given the high level of
their resemblance. These are: Wheeze vs. Stridor and
Cough vs. Clear Throat. The comparisons are shown
in Figure 2 and Figure 3 respectively. We noticed that
the classifiers generally found it difficult
differentiating between cough and throat clearing.
However, when presented with only time-domain
features, the discrimination became clearer as shown
in Figure 3. In benchmarking the overall performance,
we considered an ideal pathological case, where it is
assumed that the symptoms -cough, wheeze and
stridor are observed in an individual at the same.
According to medical experts, these respiratory
sounds are very common in exercise-induced VCD
and bronchoconstriction or bronchial asthma. Figure 2
indicates that though wheeze and stridor signals
relatively have uniform oscillation (periodicity),
stridor has a ‘flatter’ spectral shape given its wide
frequency range.
Table 2: Overall Performance of the Classifiers in
Different Scenarios.
Classifiers All Classes with all Features
5s Dataset 2.5s Dataset
Random Forest 86.86% 66.2%
SVM 75.75% 57.6%
k-NN 88.8% 65.0%
Wheeze & Stridor with all Features
Random Forest 87.5% 80.48%
SVM 80.35% 73.17%
k-NN 89.28% 86.6%
We can adduce from the results in Figure 4, that
kNN classifier has the overall best discriminating
ability among the three algorithms used in the study.
RF maintained its robustness by averaging the
predictions of other classifiers, while SVM was
weak in recognizing stridor sound. However, we
used the RF algorithm for the real-time
implementation of the classification tool.
Figure 2: Discriminating ability of time-frequency domain
features – stdZCR and varSB on wheeze and stridor.
Figure 3: Discrimination of cough from throat clearing by
time-domain features – stdZCR and varRMS.
Figure 4: Performance measures for all classifiers – RF,
SVM, and kNN on wheeze vs. stridor discrimination.
As we were unable to get real-time access to
clinical respiratory sound symptoms such as
0
0,02
0,04
0,06
0,08
0,1
0 0,05 0,1 0,15
stdZCR
varSB
Wheeze Stridor
0
0,05
0,1
0,15
0,2
0 0,05 0,1 0,15
stdZCR
varRMS
Cough
Clear
throat
0
0.1
0.2
0.3
0.4
0.5
0.6
0.7
0.8
0.9
1
0
0.1
0.2
0.3
0.4
0.5
0.6
0.7
0.8
0.9
1
Precision Recall F‐Measure
ICINCO 2017 - 14th International Conference on Informatics in Control, Automation and Robotics
426
wheezes and stridor at the time of writing this paper;
we performed a pilot test on the discriminatory
ability of the classification tool in real-time, using
records of common sound symptoms – cough and
clear throat volunteered by healthy individuals and
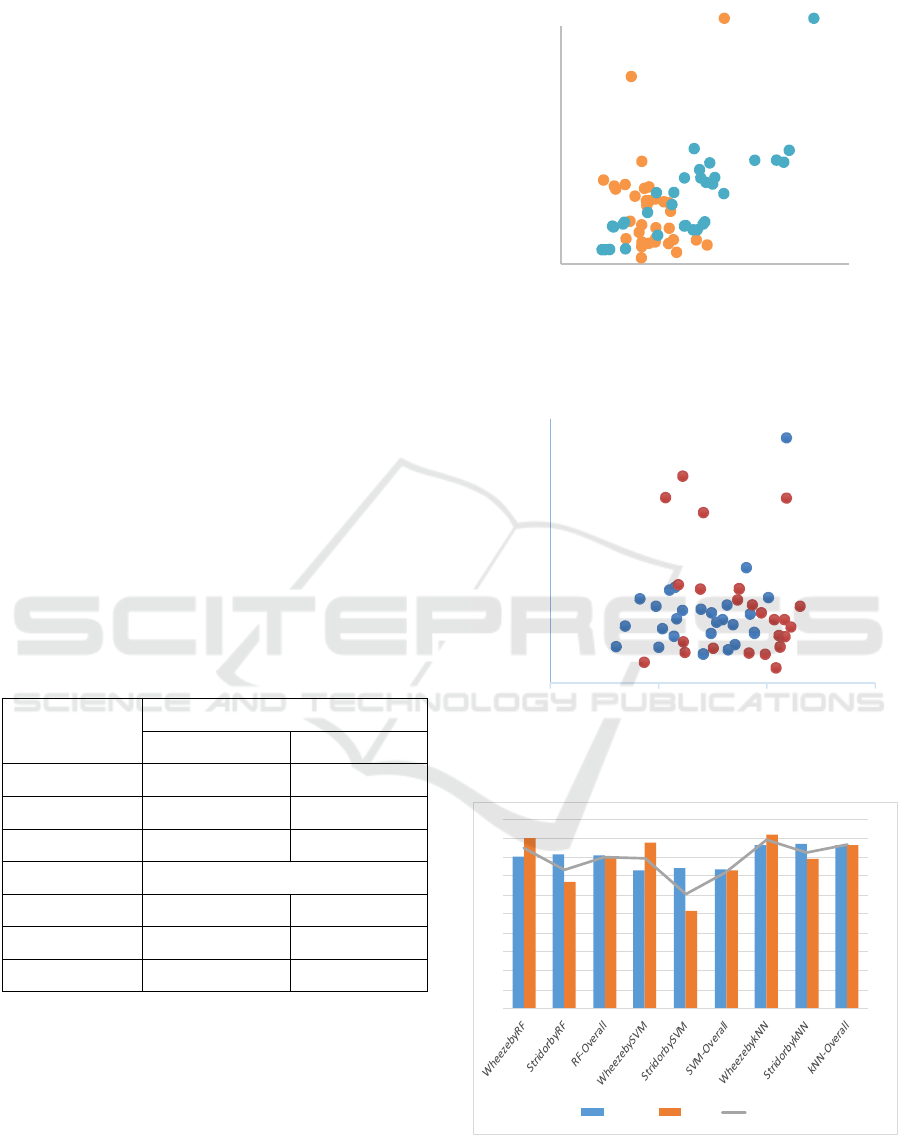
those with pathological conditions. Figure 5 shows
correct detection of different cough sounds on two
android phones (Huawei p6 Ascend and Samsung
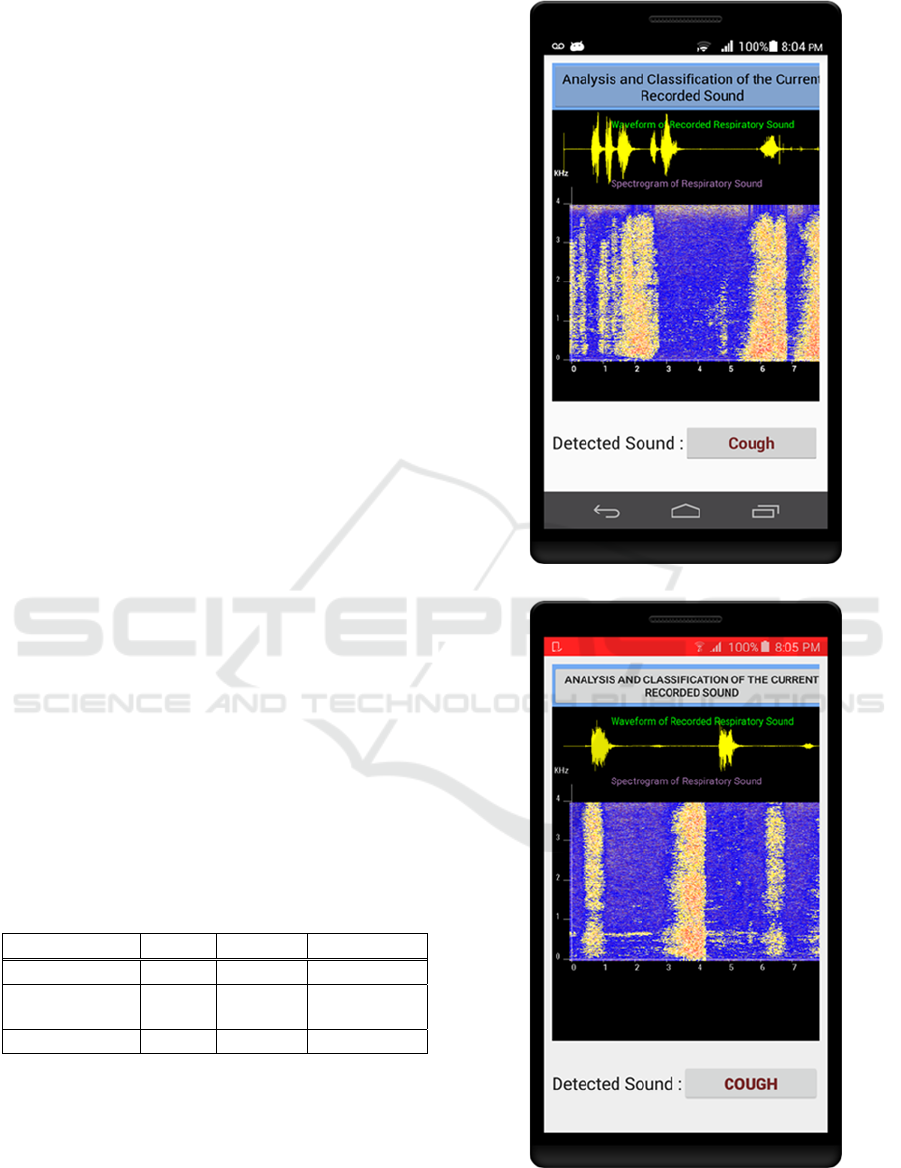
Galaxy J3). The tool was also able to predict
correctly an offline recorded wheeze sound that was
not used in the training of the classifiers, as shown in
Figure 6. Figure 7 also shows a correctly detected
stridor sound. By mere visualization, we can observe
that the waveforms and the spectrograms of these
sounds are different from each other. This may as
well serve as a clue to physicians in the differential
diagnosis of the underlying respiratory illnesses.
4.2 Device Performance on Resource
Usage
We evaluate the smartphone performance on the
utilization of the system resources when executing
the major modules in real-time. The modules include
audio pre-processing (framing and FFT), feature
extraction, and the classification. Table 3 shows the
measurements on the consumption of the device
resources during the application run-time. The
execution time in milliseconds (ms) is profiled in the
android code. As expected, the response time for the
pre-processing module was a bit long due to FFT
metrics which are numerically intensive on the
resources.
In measuring the power consumption by the
application, we used an installed app known as
Power Tutor which estimated the average power as
315mW (mill Watts) for one-minute processing.
Table 3: Benchmarks on Device Resource
Usage by Major Operations.
Module CPU Memory Exec. Time
Pre-processing 27% 2.2MB 1404 ms
Feature
Extraction
25% 8MB 556 ms
Classification 0.02% 2MB 722 ms
(a) Cough Detection on Huawei Ascend.
(b) Cough Detection on Galaxy J3.
Figure 5: (a) and (b): Detected cough sounds in real-time.
On Smartphone-based Discrimination of Pathological Respiratory Sounds with Similar Acoustic Properties using Machine Learning
Algorithms
427
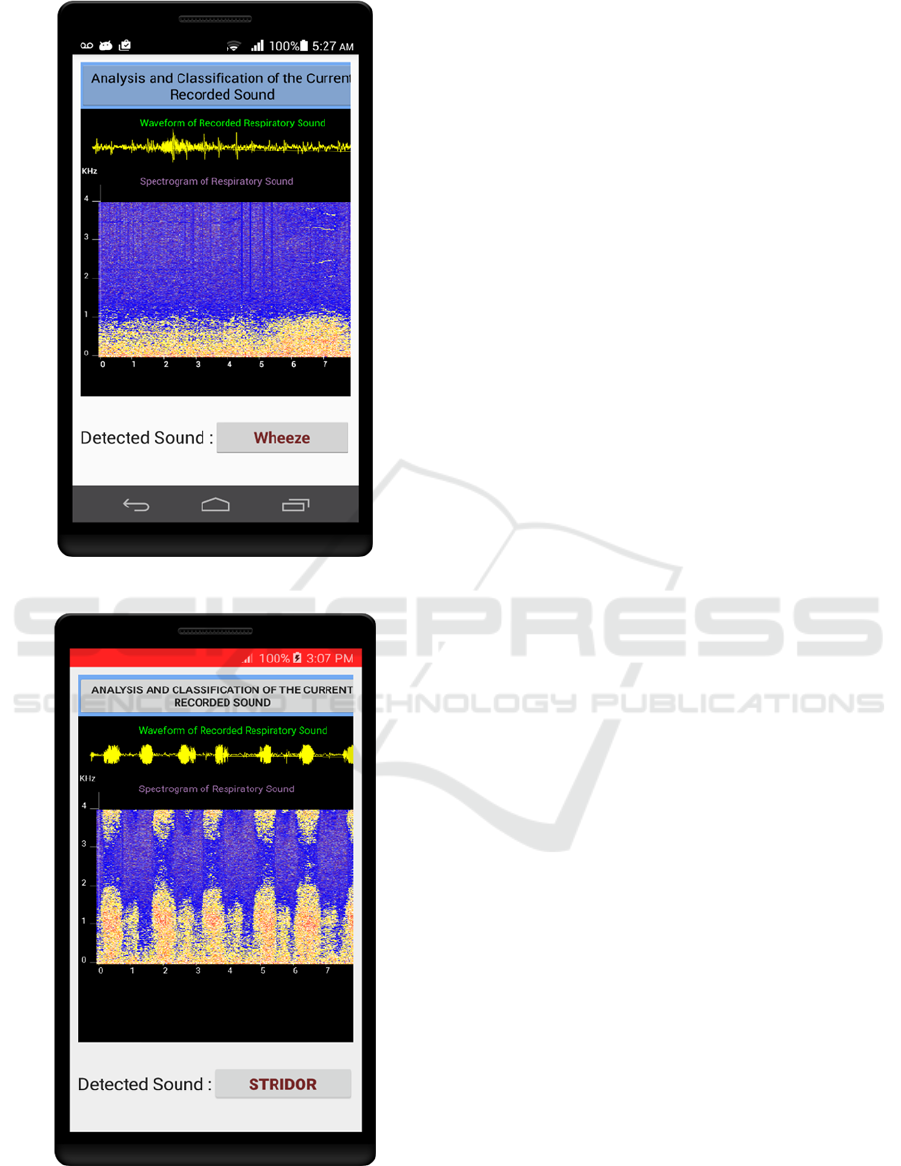
Figure 6: Detected wheeze sound recorded offline.
Figure 7: Detected stridor sound recorded offline.
5 DISCUSSIONS
In this section, we relate our study to existent work,
and compare different designs and techniques used
in selected studies to our own approach. Recent
studies have focused on audio-based systems for
continuous monitoring and detection of vital signs
relating to management and control of long-term
respiratory conditions. Aydore et al. (2009) in their
work performed a detailed experiment on the
classification of wheeze and non-wheeze episodes in
a respiratory sound, using linear analysis. Though
the approach they adopted yielded an impressive
success rate of 93.5% in the testing; the study was
not specific about the non-wheeze category of
sounds such as rhonchi and stridor which mimic
wheeze, and are reportedly misdiagnosed as wheeze
in clinical practice. The work however, was
extended by Ulukaya et al. (2015) on the
discrimination of monophonic and polyphonic
wheezes using time-frequency analysis based on two
features – mean crossing irregularity (MCI) in the
time domain, and percentile frequency ratios in the
frequency domain. The authors considered MCI as
the best discriminating feature with a performance
accuracy of 75.78% when combined with image
processing. We implemented MCI in our feature sets
and discovered that it has strong correlation with
stdZCR window-level feature. The stdZCR is one of
the prominent features we used in our classification
task and it is less computationally intensive than
MCI.
There are on-going research efforts towards the
design of monitoring and detection systems for
respiratory conditions based on mobile platforms.
The overall aim of these studies is to increase the
awareness and compliance by individuals in
managing their conditions, and to improve the
efficacy of treatment procedures and therapies by
health professionals. In the study (Larson et al.,
2011), mobile phone was used as a sensing platform
to track cough frequency in individuals and across
geographical locations. The embedded microphone
in the mobile phone serves as audio sensor to record
cough events, with the phone placed in the shirt or
pant pockets or strapped on the neck of the user.
According to the authors, results obtained from the
study could be channelled to further diagnosis and
treatment of diseases such as pneumonia, COPD,
asthma, and cystic fibrosis. Automated Device for
asthma Monitoring (ADAM) was developed by
Sterling et al. (2014) to monitor asthma symptoms in
teenagers. The system design involves the use of
lapel microphone attached to the mobile and worn
ICINCO 2017 - 14th International Conference on Informatics in Control, Automation and Robotics
428

by the user to capture audio signals. It uses Mel-
frequency cepstral coefficients (MFCC) and multiple
Hidden Markov Model (HMM) for feature
extraction and classification, to detect the ‘presence’
or ‘absence’ of cough in the recorded sounds. The
sensitivity of the detection algorithm is 85.7%.
BodyBeat, proposed by Rahman et al. (2014), is
another mobile sensing system for recognition of
non-speech body sounds. Like ADAM, it uses a
custom-made microphone attached to an embedded
unit (Micro controller) for audio capturing and pre-
processing. The embedded unit connects to the
mobile phone through Bluetooth for feature
extraction and classification of the audio windows.
Sun et al. (2015) in their study, proposed
SymDetector, a mobile application for detection of
acoustic respiratory symptoms. The application
samples audio data using smartphone’s built-in
microphone and performs symptom detection and
classification using multi-level coarse classifier and
SVM.
These novel designs appear quite elaborate and
plausible; nonetheless, common issues with them
include the ease of use of the system, and the
reproducibility of the algorithms used in the
detection process. There could be concerns about the
setup and cost of deployment by the user for systems
that utilize external audio sensors and other devices
connected to the mobile phone. Also, running
multiple level classification for the detection
algorithms may impact on the response time of the
applications when deployed in real-time. In
addressing these issues, our study uses a standalone
mobile platform with no external gadgets connected
to the smartphone. In other words, all the major
operations – audio sampling, pre-processing, feature
extraction, and classification are performed on the
mobile phone. This will not only enhance the
usability but will to an extent, ensure user’s privacy
since there are no networked devices nor any
processing performed at the backend.
Though we experimented with three classifiers,
we settled for only one - Random Forest, given its
robustness in different scenarios. The classifier has a
reasonable response time in the real-time testing as
highlighted in Table 3. And since the major
operations run in the background on the smartphone,
the concern about the classification tool hogging
device resources is ruled out. Table 4 shows a
comparison of different approaches from selected
studies based on design platform configuration, type
of audio sensor, and classification steps involved in
the sound recognition.
Table 4: Design Approaches for Smartphone-based
Detection of Respiratory Sounds.
Study
Monitoring
Platform
Configuration
Audio Sensor Classifier
ADAM
Distributed
mobile
Lapel Mic.
Multiple
HMM
Body-Beat
Distributed
mobile
Custom-built
Mic.
Linear
Discrimi-
nant
Classifier
(LDC)
Sym-
Detector
Standalone
mobile
Smartphone
Embedded
Mic.
Multi-Level
Coarse-
classifier
and SVM
Our Work
Standalone
mobile
Smartphone
Embedded
Mic.
RF, kNN,
SVM
6 CONCLUSIONS
The study focused on differentiating between
respiratory sound patterns using spectral and
temporal parameters. The parameters are believed to
correlate approximately with auditory perceptions
used in the evaluation of pathological respiratory
sounds. The ability of a mobile phone to perform the
sophisticated algorithms involved in the audio signal
analysis and classification, makes it selectable as an
assistive tool in providing real-time clinical
information on certain respiratory ailments. The
information obtained from the process can aid
physicians in further diagnosis of the suspected
respiratory conditions.
REFERENCES
Aydore, S., Sen, I., Kahya, Y. P. and Mihcak, M. K.,
2009. Classification of respiratory signals by linear
analysis. In Annual International Conference of the
Engineering in Medicine and Biology Society, (EMBC
2009). IEEE. 2617-2620.
Bohadana, A., Izbicki, G. and Kraman, S.S., 2014.
Fundamentals of lung auscultation. New England
Journal of Medicine, 370(8), 744-751.
El-Alfi, A. E., Elgamal, A. F. and Ghoniem, R. M., 2013.
A Computer-based Sound Recognition System for the
Diagnosis of Pulmonary Disorders. International
Journal of Computer Applications, 66(17).
On Smartphone-based Discrimination of Pathological Respiratory Sounds with Similar Acoustic Properties using Machine Learning
Algorithms
429

FreeSound, viewed 21 November 2016
https://www.freesound.org.
Irwin, R. S., Barnes, P. J. and Hollingsworth, H., 2013.
Evaluation of wheezing illnesses other than asthma in
adults. UpToDate. Waltham.
Larson, E. C., Lee, T., Liu, S., Rosenfeld, M. and Patel,
S.N., 2011. Accurate and privacy preserving cough
sensing using a low-cost microphone. In Proceedings
of the 13th international conference on Ubiquitous
computing, ACM. 375-384.
Lerch, A., 2012. An introduction to audio content
analysis: Applications in signal processing and music
informatics. John Wiley & Sons, NJ.
Lin, B. S. and Yen, T. S., 2014. An fpga-based rapid
wheezing detection system. International journal of
environmental research and public health, 11(2),
1573-1593.
Mazić, I., Bonković, M. and Džaja, B., 2015. Two-level
coarse-to-fine classification algorithm for asthma
wheezing recognition in children's respiratory
sounds. Biomedical Signal Processing and
Control, 21, 105-118.
Oletic, D., Arsenali B., and Bilas V., 2014. Low-Power
Wearable Respiratory Sound Sensing. Sensors 14(4),
6535-6566.
Pasterkamp, H., Kraman, S. S. and Wodicka, G. R., 1997.
Respiratory sounds: advances beyond the stethoscope.
American journal of respiratory and critical care
medicine, 156(3), 974-987.
R.A.L.E Lung Sounds, The R.A.L.E. Repository, viewed
01 September 2016. http://www.rale.ca.
Sterling, M., Rhee, H. and Bocko, M., 2014. Automated
cough assessment on a mobile platform. Journal of
medical engineering, 2014.
Ulukaya, S., Sen, I. and Kahya, Y. P., 2015. Feature
extraction using time-frequency analysis for
monophonic-polyphonic wheeze discrimination.
In 37th Annual International Conference of the
Engineering in Medicine and Biology Society (EMBC
2015), IEEE. 5412-5415.
Uwaoma, C. and Mansingh G., 2014. Detection and
Classification of Abnormal Respiratory Sounds on a
Resource-constraint Mobile Device. International
Journal of Applied Information Systems 7(11) 35-40.
Uwaoma, C. and Mansingh G., 2015. Towards real-time
monitoring and detection of asthma symptoms on a
resource-constraint mobile device. In Proceedings of
12th Annual Consumer Communications and
Networking Conference (CCNC 2015), IEEE. 47-52.
ICINCO 2017 - 14th International Conference on Informatics in Control, Automation and Robotics
430
