
Policy Analysis with Simulation: Centralization of Blood Supply
Chain
Burcu Cansu İnanç, Niousha Karimi Dastjerd, Emre Anıl Kakillioğlu and Nilgün Fescioğlu Ünver
Department of Industrial Engineering, TOBB University of Economics and Technology, Ankara, Turkey
Keywords: Blood Supply Chain, Centralization, Simulation Modeling.
Abstract: Incessant increase of human population and environmental factors increase patients’ need for blood, so
research on this topic is a crucial necessity. A blood supply chain starts with the donation of blood and ends
with transfusion to patient, and configuring blood supply chains as a whole has become a major requirement.
In this research, blood supply chain system centralization and decentralization policies are compared for a
specific setting in Turkey. Effects of these policies on performance measures like number of expired blood
products in regional blood bank and, in each hospital and total cost of the blood supply chain system are
observed using simulation modeling. Results show that under the given conditions the best policy is main-
taining a decentralized blood supply policy which leads to a lower blood expiration rate and lower total cost.
1 INTRODUCTION
The incessant increase of the population and
environmental factors results in the appearance of
some health issues. Some of these issues are taken
care through ambulatory treatment and some others
are treated through inpatient care (admitted to the
hospital). Blood is a human fluid which delivers vital
substances such as nutrients and oxygen to the body
cells and transports metabolic waste away from same
cells. The inpatients may need blood supply from
outsources due to operations and blood loss. Blood is
composed of many different kinds of components and
patients may need one or more of these component(s)
depending the treatment. In general, blood is
collected as a whole in donation centers or in
hospitals and, after donation, blood is decomposed
into different components such as red blood cells,
platelets and fresh frozen plasma which are
perishable. Hospitals may prefer to supply their
demand by their own production, if they have
necessary infrastructure, or by regional blood banks.
In hospitals, blood inventory levels of blood products
are monitored based on a determined period and when
they reach to the determined base stock level new
replenishments from the regional blood centers are
done. Orders are delivered to the hospitals at the
beginning of the day in which the orders are made. In
cases, which demanded blood products do not match
the existing blood groups and characteristics in stock,
hospitals make effort to afford the blood product. In
such a situation, hospitals first search for the proper
blood product in the regional blood bank and nearby
hospitals, if it is not found, they try to satisfy the
demand by letting donations occur.
As the process of supplying blood at the right time is
extremely vital on patients' side, blood supply chain
network and blood center locations play an important
role in efficient demand satisfaction as well as
economic scale. There are many decisions that are
effective in the pursuit of these objectives. One of the
major decisions is centralizing the blood supply chain
or decentralizing the blood supply chain by hospital
based blood banks which affects objectives with a
huge impact.
In Turkey, according to the new law about the
national blood banking system, the blood demand
from all hospitals is satisfied from Turkish Red
Crescent Society (TRCS). None of the hospitals are
authorized to collect blood donations by themselves
anymore though it costs more to supply blood
products from TRCS. Neither the tests for patient and
product match can be done by hospitals. Centralizing
blood supply chain with TRCS has positive and
negative effects as other decisions. For instance,
judging from hospitals point supplying blood
products from TRCS costs more than producing these
products by their own production. On the other hand,
in the centralized system all donations can be
collected at a single location and production process
can be standardized.
56
Inanc, B., Dastjerd, N., Kakillio
˘
glu, E. and Ünver, N.
Policy Analysis with Simulation: Centralization of Blood Supply Chain.
DOI: 10.5220/0006404100560064
In Proceedings of the 7th International Conference on Simulation and Modeling Methodologies, Technologies and Applications (SIMULTECH 2017), pages 56-64
ISBN: 978-989-758-265-3
Copyright © 2017 by SCITEPRESS – Science and Technology Publications, Lda. All rights reserved

Existing literature on blood supply chain is generally
focused on different main parts of the supply chain
with different purposes and includes different levels
of detail. However, each part and each property of the
supply chain effects objectives which exist in the
literature, therefore the supply chain must be taken
into account from donation to transfusion as a whole
with sufficient details. Besides, different scenario
analyzes exist in literature but a strategic decision that
will affect every aspect of the system like
centralization has not been analyzed from a broad
perspective. Different versions of this scenario
analysis exist in literature but blood products and
blood groups were not included and system was not
modelled from donation to transfusion as a whole.
In this research, the impact of centralization and
decentralization policies on blood supply chain
network's total cost and blood wastages/expired blood
products are investigated. Points that were not
considered in previous studies in the literature are
taken into account and in this research. For this
purpose, each blood product and blood group is
included in the blood supply chain network which is
modelled from donation to transfusion as a whole.
In addition, blood supply chain structure, standards
and policies vary for different countries and locations
and in Turkey or in a country with similar
infrastructure, no similar research exists.
In order to make the analysis on a realistic testbed,
data is collected from TRCS and own blood banks of
the hospitals in Ankara, and a simulation model is
generated based on this information.
This paper is organized as follows: Section two
presents existing work in literature, Section three
defines the problem and the method. The fourth
section includes the numerical results and, in the last
section conclusion and suggestions for future work
are presented.
2 LITERATURE
Existing literature which are related to the problem
are investigated and categorized into two groups as
studies handling blood supply chain issues and
policies by means of simulation methods and studies
considering blood as a perishable good and tackling
the issues occurred in blood supply chain.
Starting from the first category, Cohen and Pierskalla
(1975) considers management strategies for a
regional blood bank. The research focuses on the
impact of centralized and decentralized control and
also various scenarios on the transfused blood,
shortages, number and percentage of the outdated
blood. In Özgen (2007), three echelon supply chain
configurations which has been defined in the new
Turkish Law of Blood and Blood products has been
considered for regional blood center in Antalya.
Katsaliaki and Brailsford (2007) is a case study of a
blood center of a hospital which is located in United
Kingdom. This research aims minimizing the wastage
and shortages in blood supply chains. In Beliën and
Forcé (2012) all the researches of blood supply chain
till 2011 are categorized based on the modeling and
solution approaches they used and the ideas for future
works are presented. In Katsaliaki (2008) blood
donation in blood bank, donated bloods' storage,
blood distribution systems, hospitals' ordering,
stocking, blood- component user's performance and
costs are analyzed based on the data gathered from
UK blood bank and hospitals where the donations
take place. Zahraee et al. (2015) aim to increase the
efficiency of the blood supply chain by applying the
dynamic simulation and Taguchi method and monitor
the resulted change on simulation software. In the
work done by Baesler et al. (2014) the focus is on
storage of blood components. In this paper, process
between blood donations till its delivery is analyzed.
In Rytilä and Spens (2006) the increasing importance
of the blood supply chains and the strategic decisions
which can be made in order to afford the most
efficient blood utilization is negotiated. Different
inventory strategies, different transportation methods,
different ranking approaches and different production
control approaches are considered. Kamp et al. (2010)
considers blood availability and management in case
of epidemic diseases such as H5N1 and H1N1 instead
of considering the optimal inventory levels. In Pegels
et al. (1977) four different scenarios/strategies are
compared. The scenarios applied to the simulation
model can be listed as utilization of frozen blood
cells, utilization of techniques for extending blood
and blood components shell lives, application of
improved donation strategies and utilization of
improved inventory strategies. Simonetti et al. (2014)
aim at investigating the impact of various blood
management policies on the availability of the blood
and its distribution in USA. The utilized model
simulates the impact of different blood management
applications which are used in blood transfusion on
the demand. In Osorio et al. (2016) simulation is used
to support the strategic and operational decisions
made in production planning. Discrete event
simulation is used to show the supply chain flows
incorporating collection, production, stocking and
distribution. This research is a case study taken place
in Colombia and is based on the real-world data taken
from the blood bank. In J. Blake et al. (2015) a
Policy Analysis with Simulation: Centralization of Blood Supply Chain
57

simulation study is used to assess the network
performance when distinct blood centers are
consolidated into one unique blood center located in
Calgary, Alberta. Yuzgec et al. (2013) has suggested
a simulation model of blood network operations for
determining the inventory levels and distribution plan
of specific region having a regionalized blood
banking system. Vlachos et al. (2012) has considered
a methodology to estimate the required inventory
level of umbilical cord blood units in Greece. The
paper aims at ensuring an adequate probability that a
Greek patient find a Human Leukocyte Antigen. J.
Blake and Hardy (2013) have again studied the
impact that consolidation of blood production and
distribution facilities have on customer service. Xu et
al. (2013) has suggested a three-dimensional
simulation model which simulates the deformation
and aggregation of red blood cells by coupling the
interactions between the fluid and the deformable
solid membrane of the red blood cells using
continuum mechanics. In Onggo (2014) the elements
of a hybrid simulation model are explained using a
case study of blood supply chain simulation model for
low and middle-income countries that has different
characteristics and challenges in comparison to the
typical blood supply chain in high-income countries.
Baesler et al. (2014) have used a discrete event
simulation model for analyzing and proposing
inventory policies to a regional blood center. Haijema
et al. (2009) have developed a new approach which
combines stochastic dynamic programming and
simulation to provide practical order up to rules that
are nearly optimal formal theoretical support for
blood platelets. The proposed approach has been
applied to a Dutch regional blood bank. Mustafee et
al. (2009) has described an investigation into using
conventional and distributed approaches to
simulating the supply chain of blood from the UK
Southampton NBS Center to hospitals in this area.
Blake and McTaggart (2016) used simulation for
resolving the impacts of modernization configure-
tions on blood distribution network of Canadian
Blood Services.
The product considered in this research is known to
be highly perishable and due to this characteristic, the
second category includes the literature for existing
papers on the perishable inventory theory.
Sonnendecker and Millard (1960) are the researchers
who have suggested the application of general
inventory control methods and policies to the blood
supply chain and in this way the perishable inventory
theories has been applied to blood supply chain
problems. In Kopach et al. (2008) focus is on meeting
the trade-off between different demand levels
(emergency and ad-hoc), service levels, costs and also
the classic shortage and wastage minimizing
objective function factors by revising a queuing
model with utilization of cross level techniques.
Stanger et al. (2012) offered the best application that
minimizes the wastage occurring due to expiration of
the normal blood inventory holding durations. In this
paper, main focus is on the management of red blood
cells stock management in hospitals' transfusion
laboratories. In J. T. Blake et al. (2003) the methods
which can be used in platelet suppliers' regional
inventory ordering policies are discussed. In Hardy
(2015) four simulation models are used to evaluate
the impact of a reduced red blood cell shelf life on
outdate, shortage, and emergency order rates.
Literature analysis shows that blood products and
blood groups were not included and system was not
modelled from donation to transfusion as a whole in
previous researches despite their crucial effects on
objectives.
3 METHOD
In this section the functioning blood supply chain in
Ankara, centralization scenario and decentralization
scenario is summarized and then the simulation
model established is described in detail.
3.1 Problem Summary
In Turkey, a centralized blood bank system is used
and TRCS supplies blood products to hospitals
regardless of hospitals’ capabilities. In this research
the performance of centralized and decentralized
regional blood supply chain policies are compared
and the objective is to monitor the changes occurring
in number of expired blood products of hospitals and
TRCS and total cost of the system under centralized
and decentralized scenarios.
In this research, there are two types of hospitals: Type
1 and Type 2. Hospital types are determined based on
their ability to afford their own blood when
demanded. According to the investigation of this
subject, some large and facilitated hospitals which are
referred as Type 1 hospitals own their own blood
bank infrastructure and some smaller hospitals which
are referred as Type 2 hospitals need to satisfy their
demand from the regional blood bank.
The supply chain performance is assessed under two
different policy scenarios: Central supply chain
policy and decentral supply chain policy. In central
supply chain policy, all demands of both hospital
types are satisfied from the TRCS which plays the
SIMULTECH 2017 - 7th International Conference on Simulation and Modeling Methodologies, Technologies and Applications
58
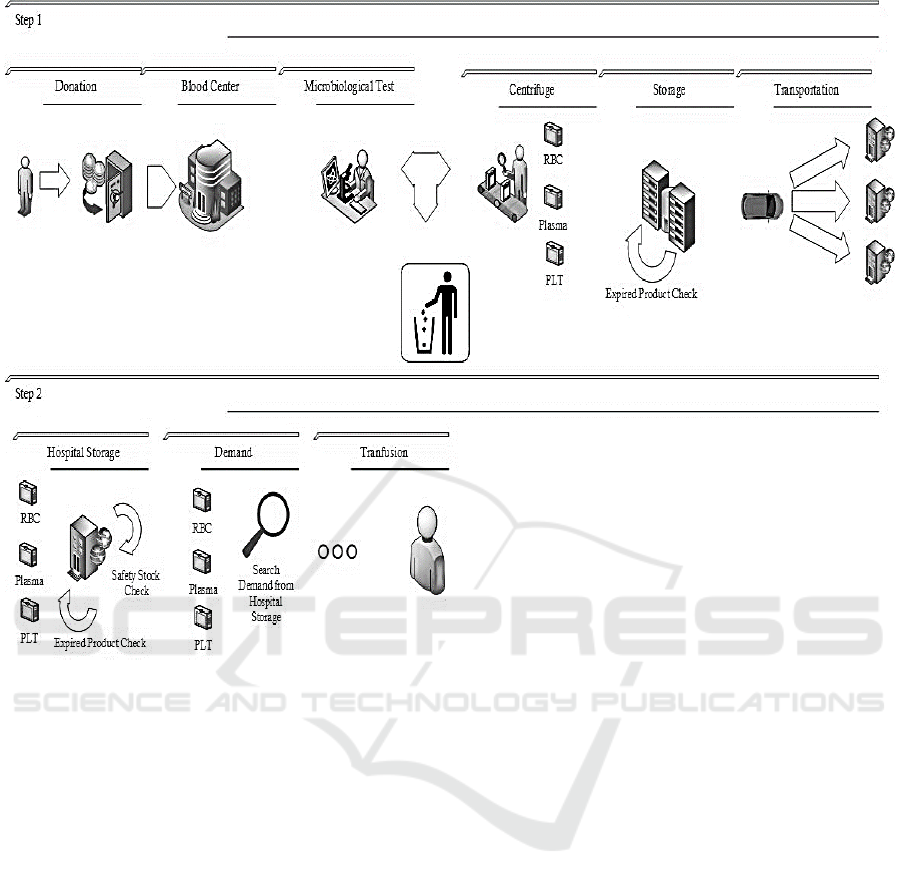
Figure 1: Centralized blood supply chain - Step1: within TRCS from donation to transportation - Step2: within hospitals from
storage to transfusion.
role of regional blood bank. TRCS collects, tests and
processes all blood donations within the city.
Hospitals keep an inventory and this inventory is
replenished by TRCS daily. The base stock level of
each hospital is determined by TRCS. When there is
a blood product demand, the hospital inventory is
checked, if it is not available in the hospital TRCS is
checked, if there is no blood product of the requested
type in TRCS banks, other hospitals are checked.
Also, blood cross match tests are done by TRCS.
Centralized blood supply chain is generalized into
two steps in Figure 1, the first step illustrates flow
from donation to TRCS storage and the second step
illustrates flow from hospital storage to transfusion.
In the decentralized supply chain policy, Type 1
hospitals produce their own blood components but
Type 2 hospitals still order from TRCS. In decentral
system, Type 1 hospitals collect, test and process their
own blood inventory. Type 2 hospitals order their
blood from TRCS and their inventory is replenished
daily by TRCS. If the required blood product is not
available in the inventory of a Type 1 hospital,
hospital first asks other Type-1 hospitals, if blood is
not available in other hospitals they ask TRCS. If the
hospital is a Type 2, they ask TRCS when the required
blood type is not in their inventory.
Outdated blood disposal is a crucial operation both at
TRCS and at hospitals. Both decentral and central
systems need to check their inventory periodically for
determining expired products. Blood and all its
components are perishable products which have
different shelf lives. To illustrate, red blood cells can
stay alive for a 42-day period of time, frozen plasma
cells can stay alive for 2 years while platelets live for
5 to 7 days, once the facility that collected them has
completed their tests. The responsible personnel
check the blood products' expiration date and dispose
the ones which are outdated.
In blood processing centers at first each donor’s
suitability is tested, if a donor is not suitable (2%
probability) the donation is disposed; otherwise the
blood is divided into its components and sent to
appropriate storages. In addition to the division of
blood to different components, blood can be
Policy Analysis with Simulation: Centralization of Blood Supply Chain
59

categorized into 8 subgroups based on blood groups
which have varying frequencies from population to
population. Blood demands of patients can be
satisfied in case that the blood group and other blood
characteristics match. These demands are satisfied
from hospitals' blood stocks, so it is crucial to keep
sufficient stock in hospitals.
Preparation process varies between different blood
products. RBC demands are prepared one day prior to
transfusion but when the time comes for transfusion
the product may not be needed anymore with 60%
probability. If RBC is not used product can be
returned to the relevant storage. Plasma demands are
prepared instantly with a 20 minutes defrosting
process. PLT demands are prepared instantly and it
does not require any special process. In contrary to
the red blood cells case all other products are disposed
if they are not used when being demanded.
Typically, before transfusion, the red blood cells have
to pass the cross-match tests which determine the
blood availability for a specific patient. In this
research, cross match tests are ignored. The ratio of
the blood which is considered as waste as a result of
the cross-match test is approximately 1% - 2% which
is a negligible percentage in comparison to other
components in the system. This 1% - 2% waste will
not affect the internal circulations of the system,
number of wasted blood and total cost by a significant
amount.
The blood donation amount is highly stochastic due
to its nature. Sometimes the natural disasters impulse
the empathy of human beings and the donation ratios
grow up sharply while in some other cases considered
as normal cases these ratios fall down. In addition to
donation ratios, the demand amounts and frequencies
are also stochastic values and to the best of the
knowledge one cannot say the demand would be
exactly equal to some amount on a specific day. In
order to study this highly stochastic system a
simulation approach is preferred. The simulation
model is used to assess the number of unsatisfied
demand due to blood shortages, wastages and also the
total system cost under different scenarios and
different donation levels.
3.2 Simulation Model
Ankara, Turkey is taken as the base of our simulation
model. The data set used in this research is gathered
from different resources. The information about the
demand values and process durations are collected
from a Type 1 Hospital’s annual reports that contain
daily amount of demands for a year. This demand
data contains the data for all the possible blood
products which includes blood groups. The process
durations, TRCS prices and blood product production
costs are taken based on the information taken from
experts. Ratios of blood group demands are adopted
from TRCS's statistics. In Ankara, hospitals to meet
their demand by their own stocks, is a more expected
situation which is approved by experts. In other
words, usually there is no need for hospitals to search
blood products from different sources, stocks can
usually meet demand. In addition, in Ankara Type 1
hospitals are located close to each other which make
the transfer time between Type 1 hospitals short
enough to not affect the expiration time of a blood
product. Therefore, in the decentral case Type-1
hospitals share one depot and Type-2 hospitals share
another depot (TRCS depot). Information about the
number of donations per day is adopted from TRCSs'
reports which contain the monthly donation numbers
for a period of 6 years. The distribution of daily
donation amounts is generated through this monthly
data and expert opinion. Ratios of blood group
donations are adopted from TRCS's statistics. In
addition to the data mentioned above, the blood bank
process durations are utilized which were presented
in Baesler et al. (2014). Blood product production
process distributions are generalized with the
generated data from the simulation model which is
established with process distributions presented in
Baesler et al. (2014).
The simulation model is developed in ARENA 14.0
and solved based on the real-life data gathered from
different resources as illustrated in Section 3.1.
The simulation model of centralized blood supply
chain network is shown in Figure 2 below. The
simulation model starts with donations, and then each
donation is transferred from donation points to
regional TRCS center where biological tests and
centrifuge occurs. Because of different processing
needs each blood product is modeled with a sub-
model and the sub-model of RBC is shown in Figure
3 below. Also in the simulation model, each blood
type of each product is stored in a different storage,
and for daily replenishments and shortages products
are transferred from TRCS to hospital storages where
they are stored in the same way. When demand
occurs, it is tried to be matched if there is enough
stock at hospital’s storage. If there is not enough
product with demanded properties, other storages,
TRCS and other hospitals’ storages, are investigated.
If demand can be matched with the requested blood
product transfusion process begins, and each
transfusion process is modeled with a sub-model.
SIMULTECH 2017 - 7th International Conference on Simulation and Modeling Methodologies, Technologies and Applications
60
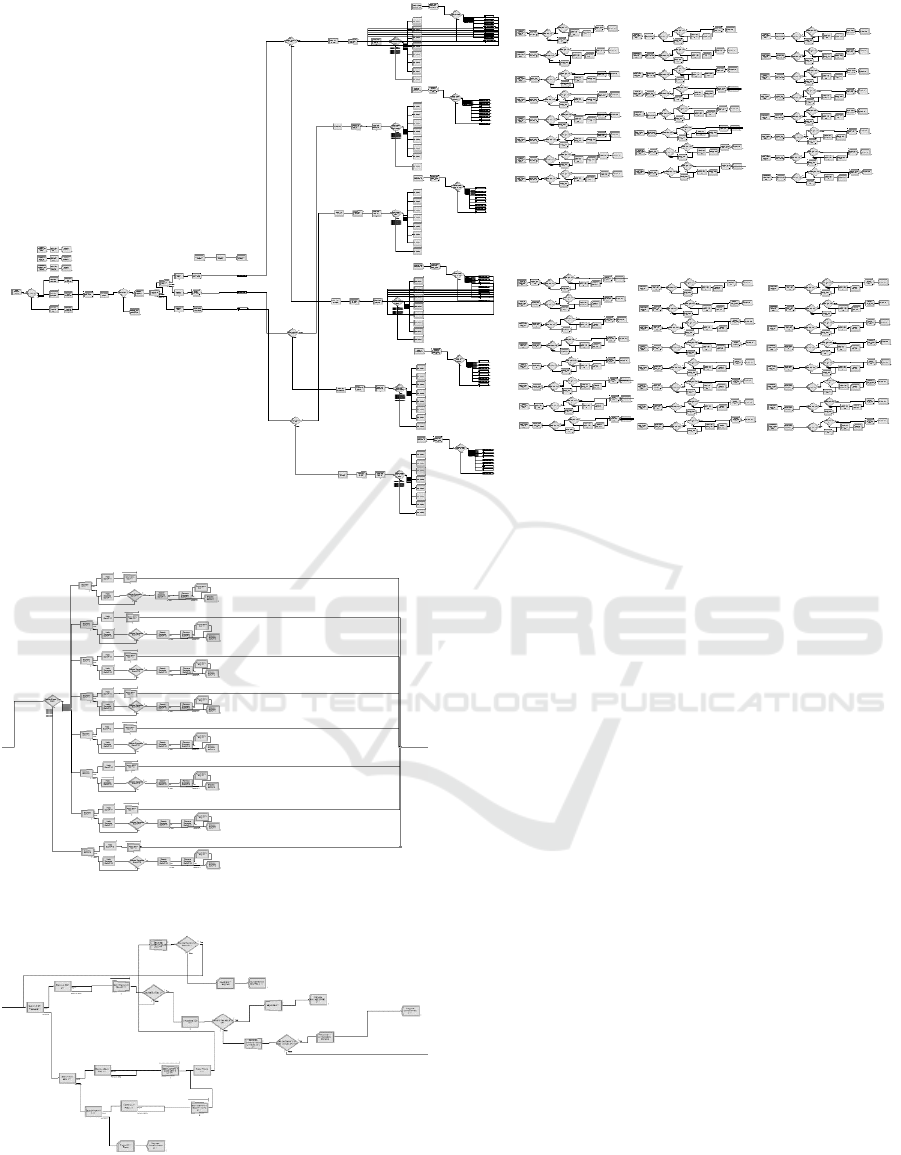
Figure 2: Simulation model for centralized system.
Figure 3: Sub-model for producing RBC.
Figure 4: Sub-model for RBC transfusion.
Sub-model of RBC’s transfusion process is
shown in Figure 4.
The blood donation data gathered from TRCS only
includes the donations which are from central
Ankara. Computations show that central Ankara
donations can only satisfy %50 of the demand for
each blood component. The results of the simulation
model also confirm this fact. However in reality,
TRCS also gathers additional donations which come
from the close provinces. Only with the addition of
these donations, Ankara can satisfy its blood demand
completely.
For further analysis of the system multiple levels of
donation ratios (donation/demand) are considered
which represent the cases where the demand increase
or donations decrease. For each scenario donation
rates are gradually increased to fulfill the demand and
its effects to objectives are observed. Hourly donation
ratios (donation/demand within the same hour) are
taken as different percentages that are (100%, 87.5%,
75%, 62% and 50%). Expert opinion was obtained in
validation stage and the model showed high face
validity. The model was run for 365 days and 6
replications with a warm of period of 1000 hours.
4 NUMERICAL RESULTS
The performance measures which are assessed
include number of expired products and the total cost
Policy Analysis with Simulation: Centralization of Blood Supply Chain
61
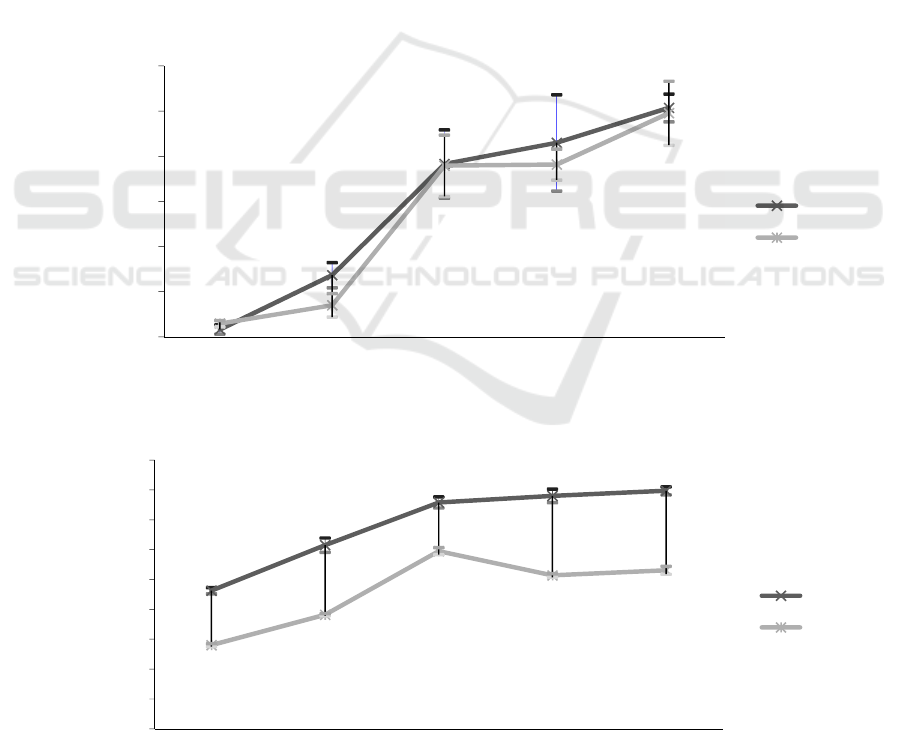
of the system. In this case study, the demand rate is
kept constant while the donation ratios are changed.
The first performance measure is the blood products
that expired which may mean that the supply chain is
not good structured enough, and it is a problem that
needs to be addressed on. In the decentralized system,
there are less expired blood products than the
centralized system. In the centralized system, Type 1
hospital storages usually contain extra blood product
than needed because of the new emergency stock
legislation. Due to a high amount of stock held until
the blood product is identified by other hospitals and
transfer process is completed, the blood can expire.
Therefore, blood products may expire before being
used and centralization with high amount of base
stocks is not a good scenario for this performance
measure as shown in Figure 5.
The second performance measure is total cost. This
measure is considered for Type 1 hospitals and for the
whole system. TRCS produces blood products with
the same cost as Type 1 hospitals and sells these blood
products with the price of 3 times of its production
cost. That’s why total cost increase for Type 1
hospitals in centralized scenario is expected while
total cost of the system increases as well. The only
factor of total cost is not the blood product
production; there are disposal costs of expired blood
products which is costly because of the type of the
product. As previously shown in the decentralized
system there is less expired blood products than the
centralized system, so total cost of the system is
expected to be less in the decentralized system.
Decentralized scenario gives better results than
centralized scenario in this performance measure
which is shown in Figure 6.
For these performance criteria, the best scenario is the
decentralized one which has lower expiration rate and
lower total cost. So, it is better to have a decentralized
system for Type 1 hospitals which are capable of
supplying their own demand by their laboratories.
Figure 5: Number of expired products of central and decentral systems.
Figure 6: Total cost of central and decentral systems.
0,00
10000,00
20000,00
30000,00
40000,00
50000,00
60000,00
50% 62.5% 75% 87.5% 100%
Expired Products
Donation ratio
Central
Decentral
0
20000000
40000000
60000000
80000000
100000000
120000000
140000000
160000000
180000000
50% 62.5% 75% 87.5% 100%
Total Cost
Donation ratio
Central
Decentral
SIMULTECH 2017 - 7th International Conference on Simulation and Modeling Methodologies, Technologies and Applications
62

5 CONCLUSIONS
Blood supply chain policies become more and more
important nowadays, because of the increasing
population rate, widespread epidemics, disasters and
terrorist attacks which increase the need of blood
products. Therefore, centralization policy and its
effects on system have great importance in terms on
both cost and human life.
In this research, the impact of centralization and
decentralization policies on blood supply chain
network's total cost and blood wastages/expired blood
products are investigated with simulation. Ankara,
Turkey blood supply chain system is used as the base
of the simulation model. With aim of eliminating
deficiencies in previous research each blood product
and blood group is included in the blood supply chain
network which is modelled from donation to
transfusion as a whole
Results showed that decentralized system is better for
performance criteria like, number of expired products
of hospitals and TRCS, and total cost of the
system. Actually, the decentralized scenario is a kind
of a semi-decentralization which is also preferred by
USA. In USA system hospitals, which are capable of
producing blood products from their donations supply
blood to system with Red Cross. With adoption of this
semi-decentralized blood supply chain system, type 1
hospitals’ having idle blood product production
facilities can be prevented. Results also showed that
base stock levels of the hospitals should be
determined carefully in order to the centralized
system work efficiently. The current base stock levels
lead into a greater number of expired products.
For future work, the effects of different base stock
levels on performance measures can be evaluated.
Optimal stock levels of different stock policies can be
determined with a mathematical programming model
and then the impact of centralization and
decentralization policies on blood supply chain
network can be observed with use of the simulation
model which is developed in this research.
REFERENCES
Moore, R., Lopes, J., 1999. Paper templates. In
TEMPLATE’06, 1st International Conference on
Template Production. SCITEPRESS.
Smith, J., 1998. The book, The Publishing Company.
London, 2
nd
edition.
Baesler, F., Nemeth, M., Martínez, C., & Bastías, A.
(2014). Analysis of inventory strategies for blood
components in a regional blood center using process
simulation. Transfusion, 54(2), 323-330.
Beliën, J., & Forcé, H. (2012). Supply chain management
of blood products: A literature review. European
Journal of Operational Research, 217(1), 1-16.
Blake, J., & Hardy, M. (2013). Using simulation to evaluate
a blood supply network in the Canadian maritime
provinces. Journal of Enterprise Information
Management, 26(1/2), 119-134. doi: doi:10.1108/
17410391311289587
Blake, J., McTaggart, K., & Hardy, M. (2015). Modelling a
Blood Distribution Network in the Prairies with a
Generic Simulation Framework. INFOR: Information
Systems and Operational Research, 53(4), 194-210
Blake, J. T., Thompson, S., Smith, S., Anderson, D.,
Arellana, R., & Bernard, D. (2003). Optimizing the
platelet supply chain in Nova Scotia. Paper presented at
the Proceedings of the 29th meeting of the European
Working Group on Operational Research Applied to
Health Services (ORAHS). Prague: European Working
Group on Operational Research Applied to Health
Services.
Cohen, M., & Pierskalla, W. (1975). Management policies
for a regional blood bank. Transfusion, 15(1), 58-67.
Haijema, R., van Dijk, N., van der Wal, J., & Smit Sibinga,
C. (2009). Blood platelet production with breaks:
optimization by SDP and simulation. International
Journal of Production Economics, 121(2), 464-473.
doi:http://dx.doi.org/10.1016/j.ijpe.2006.11.026
Hardy, M. (2015). Simulation of a reduced red blood cell
shelf life.
Kamp, C., Heiden, M., Henseler, O., & Seitz, R. (2010).
Management of blood supplies during an influenza
pandemic. Transfusion, 50(1), 231-239.
Katsaliaki, K. (2008). Cost-effective practices in the blood
service sector. Health policy, 86(2), 276-287.
Katsaliaki, K., & Brailsford, S. C. (2007). Using simulation
to improve the blood supply chain. Journal of the
operational research society, 58(2), 219-227.
Kopach, R., Balcıoğlu, B., & Carter, M. (2008). Tutorial on
constructing a red blood cell inventory management
system with two demand rates. European Journal of
Operational Research, 185(3), 1051-1059.
Mustafee, N., Taylor, S. J., Katsaliaki, K., & Brailsford, S.
(2009). Facilitating the analysis of a UK national blood
service supply chain using distributed simulation.
Simulation, 85(2), 113-128.
Onggo, B. S. (2014). Elements of a hybrid simulation
model: a case study of the blood supply chain in low-
and middle-income countries. Paper presented at the
Proceedings of the 2014 Winter Simulation
Conference, Savannah, Georgia.
Osorio, A. F., Brailsford, S. C., Smith, H. K., Forero-Matiz,
S. P., & Camacho-Rodríguez, B. A. (2016). Simulation-
optimization model for production planning in the
blood supply chain. Health Care Management Science,
1-17. doi:10.1007/s10729-016-9370-6
Özgen, C. (2007). Simulation analysis of the blood supply
chain and a case study. Middle East Technical
University.
Policy Analysis with Simulation: Centralization of Blood Supply Chain
63

Pegels, C. C., Seagle, J., Cumming, P., Kendall, K., &
Shubsda, J. (1977). An analysis of selected blood
service policy changes. Medical care, 15(2), 147-157.
Rytilä, J. S., & Spens, K. M. (2006). Using simulation to
increase efficiency in blood supply chains.
Management Research News, 29(12), 801-819.
Simonetti, A., Forshee, R. A., Anderson, S. A., &
Walderhaug, M. (2014). A stock-and-flow simulation
model of the US blood supply. Transfusion, 54(3pt2),
828-838. doi:10.1111/trf.12392
Sonnendecker, J. P., & Millard, D. W. (1960). Industrial
Engineering Analyses of a Hospital Blood Laboratory:
Engineering Experiment Station, College of
Engineering, Ohio State University.
Stanger, S. H., Yates, N., Wilding, R., & Cotton, S. (2012).
Blood inventory management: hospital best practice.
Transfusion medicine reviews, 26(2), 153-163.
Vlachos, D., Iakovou, E., Keramydas, C., &
Anagnostopoulos, A. (2012). On the estimation of the
necessary inventory for hellenic public cord blood
banks using simulation. Operational Research, 12(1),
57-68. doi:10.1007/s12351-010-0091-1
Xu, D., Kaliviotis, E., Munjiza, A., Avital, E., Ji, C., &
Williams, J. (2013). Large scale simulation of red blood
cell aggregation in shear flows. Journal of
Biomechanics, 46(11), 1810-1817. doi:http://dx.doi.
org/10.1016/j.jbiomech.2013.05.010
Yuzgec, E., Han, Y., & Nagarur, N. (2013). A Simulation
Model for Blood Supply Chain Systems. Paper
presented at the IIE Annual Conference. Proceedings.
Zahraee, S. M., Rohani, J. M., Firouzi, A., & Shahpanah,
A. (2015). Efficiency improvement of blood supply
chain system using Taguchi method and dynamic
simulation. Procedia Manufacturing, 2, 1-5.
Blake J., McTaggart K. (2016), Using Simulation for
Strategic Blood Supply Chain Design in the Canadian
Prairies, SIMULTECH 2016.
SIMULTECH 2017 - 7th International Conference on Simulation and Modeling Methodologies, Technologies and Applications
64
