
Forecasting Asthma Hospital Admissions from Remotely Sensed
Environmental Data
Rute Almeida
1,2
, Ana Cl
´
audia Teodoro
3
, Hern
ˆ
ani Gonc¸alves
1
, Alberto Freitas
1,4
, Ana S
´
a-Sousa
1
,
Cristina J
´
acome
1
and Jo
˜
ao Fonseca
1,4,5
1
CINTESIS - Center for Health Technology and Services Research, Faculty of Medicine, University of Porto,
Rua Dr. Pl
´
acido da Costa 4200-450 Porto, Portugal
2
CMUP - Centre of Mathematics of the University of Porto, Porto, Portugal
3
Department of Geoscience, Environment and Land Planning/Institute of Earth Sciences (ICT), Faculty of Sciences,
University of Porto, Rua do Campo Alegre, 4169-007 Porto, Portugal
4
MEDCIDS - Department of Community Medicine, Information and Health Decision Sciences, Faculty of Medicine,
University of Porto, Rua Dr. Pl
´
acido da Costa 4200-450 Porto, Portugal
5
CUF Porto Institute & Hospital, Estrada da Circunvalac¸
˜
ao 14341, 4100-180 Porto, Portugal
Keywords:
Asthma Exacerbation, NDV I, Temperature, NO
2
, Air Pollution, Meteorological Parameters, Forecasting
System.
Abstract:
Asthma has a major social impact and is prone to exacerbations. It is known that environmental factors, such as
meteorological conditions and air pollutants, have a role over their occurrence. In a previous work, positive as-
sociations were found between hospital admissions due to asthma exacerbation at highly urbanized regions of
Portugal and higher atmospheric NO
2
levels, lower vegetation density and higher air temperatures, estimated
using remote sensing. In this study we propose the use of georeferenced environmental factors to forecast the
risk of hospital admissions due to asthma exacerbation. We applied linear discriminant analysis using monthly
averages based in 2003–2007 environmental data to forecast positive monthly admission rates in municipal-
ities of Lisboa district (Portugal) during 2008. Space-time estimates of nitrogen dioxide (NO
2
), vegetation
density from MODIS Normalized Difference Vegetation Index (NDV I) and near-surface air temperature (Ta)
were considered as independent variables. We identified over 65% of the combinations months/municipalities
having hospital admissions in the testing set, with less than 10% of false positives. These results confirm that
NO
2
, NDV I and Ta levels obtained from remotely sensed data can be used to predict hospital admissions due
to asthma exacerbation, and may be helpful if applied in warning systems for patients in the future.
1 INTRODUCTION
Asthma is an inflammatory disorder of the airways
associated with a hyper-responsiveness that leads to
recurrent episodes of wheezing, breathlessness, chest
tightness, and coughing. It is among the most com-
mon chronic diseases, affecting people of all ages
throughout the world, with increasing prevalence in
many countries, especially among children (GINA,
2016). The Portuguese National Asthma Survey
(2010) found a prevalence of 6.9% (43% uncontrolled
asthma) (S
´
a-Sousa et al., 2012; Ferreira-Magalh
˜
aes
et al., 2015). Asthma is punctuated by exacerba-
tions, which are characterized by the worsening of
symptoms and increase in reliever medication usage,
which are the main cause for a huge social impact,
by leading to unscheduled healthcare usage, including
hospitalizations, absenteeism and productivity loss at
workplace.
There is evidence that the delivery of healthcare
via information and communication technology has
beneficial effects in chronic diseases management
(Bashshur et al., 2014). Studies with Portuguese
asthma patients showed that they are willing and
ready to use information and communication technol-
ogy to help managing their asthma (Fonseca et al.,
2006; Cruz-Correia et al., 2007). In a Cochrane re-
view of mobile applications to improve asthma symp-
tom control performed in 2013 (Marcano Belisario
et al., 2013), only two randomized control studies
124
Almeida, R., Teodoro, A., Gonçalves, H., Freitas, A., Sa-Sousa, A., Jácome, C. and Fonseca, J.
Forecasting Asthma Hospital Admissions from Remotely Sensed Environmental Data.
DOI: 10.5220/0006385201240130
In Proceedings of the 3rd International Conference on Geographical Information Systems Theory, Applications and Management (GISTAM 2017), pages 124-130
ISBN: 978-989-758-252-3
Copyright © 2017 by SCITEPRESS – Science and Technology Publications, Lda. All rights reserved

were found over hundreds of articles and only one
reporting higher asthma-related quality life scores.
Therefore patient self-management using information
and communication technology tools may represent
high value patient care in near future, which potential
is still to be achieved.
It is known that several environmental factors,
such as meteorological conditions and air pollutants,
have a role over exacerbations occurrence. Neverthe-
less, there is no consensus regarding the specific fac-
tors which should be considered, and attempts to pre-
dict asthma exacerbation from environmental param-
eters have produced inconsistent results (Akinbami
et al., 2010; Delamater et al., 2012; Moustris et al.,
2012; Soyiri et al., 2013; GINA, 2016).
The association between hospital admissions due
to asthma exacerbation and remotely sensed data
(MODIS sensor) for air pollutants NO
2
and PM
10
,
relative humidity (RH), Normalized Difference Veg-
etation Index (NDV I) and near-surface air tempera-
ture (Ta), in Mainland Portugal and considering spa-
tial information, has been recently studied by Ayres-
Sampaio et al (Ayres-Sampaio et al., 2014). In that
work, linear univariate regression analysis and Pear-
son correlation coefficients were used to quantify
separately the association between asthma hospital
admissions (dependent variable) with which one of
the five environmental variables, considering six-year
(2003-2008) based seasonal averages. A positive as-
sociation between asthma hospitalizations at highly
urbanized regions of Portugal mainland and higher at-
mospheric NO
2
levels, lower vegetation density and
higher air temperatures.
In the current research we propose that the com-
bined use of georeferenced environmental factors data
are able to forecast the geographical dependent risk
of hospital admissions due to asthma exacerbation. In
this work we explored the potential of the environ-
mental factors previously reported in (Ayres-Sampaio
et al., 2014) as determinants of asthma hospitaliza-
tions due to asthma - Ta, NDV I and NO
2
- to fore-
cast the positive admission rates by municipality at
the Lisboa district (Portugal).
2 DATA AND METHODS
The study area of this research was the district of Lis-
boa (Figure 1), as it represents more than 45% of the
population living at the Portuguese districts with high
(> 10%) urban coverage and nearly a quarter of all
population living in Portugal, with a population rang-
ing from 2 190 197 to 2 238 484 between 2003 and
2008. Lisboa district has 16 municipalities, which
were considered as separate data points to attend to
spatial dependency of environmental exposition.
The data sources used in this work were the same
used in (Ayres-Sampaio et al., 2014) as well as the
preprocessing of enviromental data. All processing
was performed using ArcGIS 10.0 and MATLAB
R2014a.
2.1 Environmental Data
Several environmental variables have been reported
as associated to asthma hospital admissions. Attend-
ing to the previously found associations between the
admissions due to asthma exacerbation at high urban
coverage districts and NO
2
, NDV I and Ta (Ayres-
Sampaio et al., 2014), those parameters were chosen
as independent variables in this research.
The air temperature Ta at a given point can be
computed by a linear regression if the lapse rate (I
r
)
the altitude (H), and the temperature at sea level (T
0
)
are known. The altitude H was given by Digital Ele-
vation Model (DEM) from the Shuttle Radar Topog-
raphy Mission (SRTM) (Farr et al., 2007) composed
by 23 1X1-degree images with 90m of spatial resolu-
tion and after resampled in a 5 km resolution image
(DEM5); l
r
and T
0
were determined using MODIS
temperature profile. MODIS temperature profile was
acquired from MOD07 products. The MODIS Atmo-
spheric Profiles product (MOD07) consists of several
parameters, all of than are produced day and night
for Level 2 at 5X 5 1-km pixel resolution. The NDV I
was obtained directly from the MOD13A3 product.
The NDV I assumed values between −1 and +1 and
is computed as:
NDV I = [(ρ
NIR
− ρ
Red
)/(ρ
NIR
+ ρ
Red
)], (1)
where ρ
NIR
and ρ
Red
are respectively the near-infrared
reflectance and red reflectance. MOD13A3 data are
provided monthly at 1-km spatial resolution. In gen-
erating this monthly product, the algorithm takes all
the 16-day 1-km products that overlap the month.
Hourly NO
2
measurements were collected from the
Portuguese Environmental Agency through an online
database available at http://www.qualar.org/, followed
by the computation of monthly averages from the
daily averages.
The 1-km spatial resolution of the remote sensed
data is enough considering the municipality spatial
unit considered for hospitalizations.
2.2 Hospitalizations Data
Data from hospitalizations is a subset of that used in
(Ayres-Sampaio et al., 2014), which refers to all of the
Forecasting Asthma Hospital Admissions from Remotely Sensed Environmental Data
125

Figure 1: District of Lisboa (Portugal) and its 16 municipalities.
public acute care hospitals of the National Health Ser-
vice as provided by the Ministry’s of Health Central
Authority for Health Services (Administrac¸
˜
ao Central
do Sistema de Sa
´
ude, ACSS). The database includes
diagnostic codes according to the International Clas-
sification of Diseases, Ninth Revision, Clinical Modi-
fication (ICD-9-CM), from which cases with a princi-
pal diagnosis of asthma (code ICD-9-CM 493.x) were
retrieved.
A total of 4 889 admissions in the Lisboa district
in the period from 2003 to 2008 were analized (Ta-
ble 1), which represent over 25% of the total of the
asthma hospital admissions in Portugal during that pe-
riod. Monthly admission rates per 1000 inhabitants
were calculated for each municipality from annual
resident population data obtained from the National
Statistical Institute (Instituto Nacional de Estat
´
ıstica,
INE).
2.3 Classification Strategy
The forecasting of hospital admissions due to asthma
exacerbation was based on the following binary
classes defined for each municipality:
class 0 - no admissions were registered in that month;
class 1 - at least one admission was registered in that
month.
Training set was defined as the reported data from
2003 to 2007. The classifier was constructed by tak-
ing the averages in each month per municipality, both
for the independent variables (T
a
, NDV I and NO
2
)
and dependent variable (asthma related monthly ad-
mission rates per 1000 inhabitants).
Supervised classification was performed by Lin-
ear Discriminant Analysis (LDA). The LDA classifier
was evaluated over 3 data sets:
i. training data (averages), the monthly 5-years
(2003-2007) based averages for each of the 16 mu-
nicipalities (192 data points);
ii. training data (monthly), the 12 monthly values
for each year from 2003 to 2007 for each of the 16
municipalities (960 data points);
iii. test data (monthly), the 12 monthly values for
2008 for each of the 16 municipalities (192 data
points).
The outcome achieved in a binary classification
can be easily displayed as a confusion matrix, which
is a two-by-two table (Table 2). In the confusion ma-
trix, True Negatives (TN) and True Positives (TP) cor-
respond to the number of correct classifications for re-
spectively classes 0 and 1, while False Positives (FP)
and False Negatives (FN) correspond to the number
of miss-classifications as class 1 and class 0, respec-
tively. The misclassification error rate based on the
training data was quantified as the apparent error rate:
err = 1/2 (FP/(T N + FP) + FN/(FN + T P)) (2)
where 1/2 corresponds to the prior probabilities for
the groups. Additionally, a 10-fold cross-validation
scheme of training data was used.
GISTAM 2017 - 3rd International Conference on Geographical Information Systems Theory, Applications and Management
126

Table 1: Hospital admissions due to asthma exacerbation, per municipality and year, in the Lisboa district.
Municipality 2003 2004 2005 2006 2007 2008 total
Alenquer 10 9 12 10 8 8 57
Amadora 71 62 86 103 85 55 462
Arruda dos Vinhos 2 0 1 1 1 1 6
Azambuja 5 7 2 2 2 2 20
Cadaval 2 2 2 1 1 2 10
Cascais 49 55 68 78 57 36 343
Lisboa 251 238 224 197 192 222 1324
Loures 67 79 57 74 67 68 412
Lourinh
˜
a 6 7 4 6 3 7 33
Mafra 6 19 12 19 12 18 86
Odivelas 82 87 62 59 78 77 445
Oeiras 74 76 65 57 36 27 335
Sintra 128 159 165 209 182 132 975
Sobral de Monte Agrac¸o 4 5 3 1 1 4 18
Torres Vedras 34 36 24 25 10 22 151
Vila Franca de Xira 44 38 37 34 37 22 212
For all data sets, the performance was also mea-
sured in terms of the sensitivity (S), positive predic-
tive value (P+) and accuracy (A)
S = T P/(T P + FN) (3)
P+ = T P/(T P + FP) (4)
A = (T P + T N)/(T P + FP + FN + T N). (5)
Table 2: Confusion matrix for binary classification.
Classifier
class 0 class 1
Truth
class 0 TN FP
class 1 FN TP
3 RESULTS AND DISCUSSION
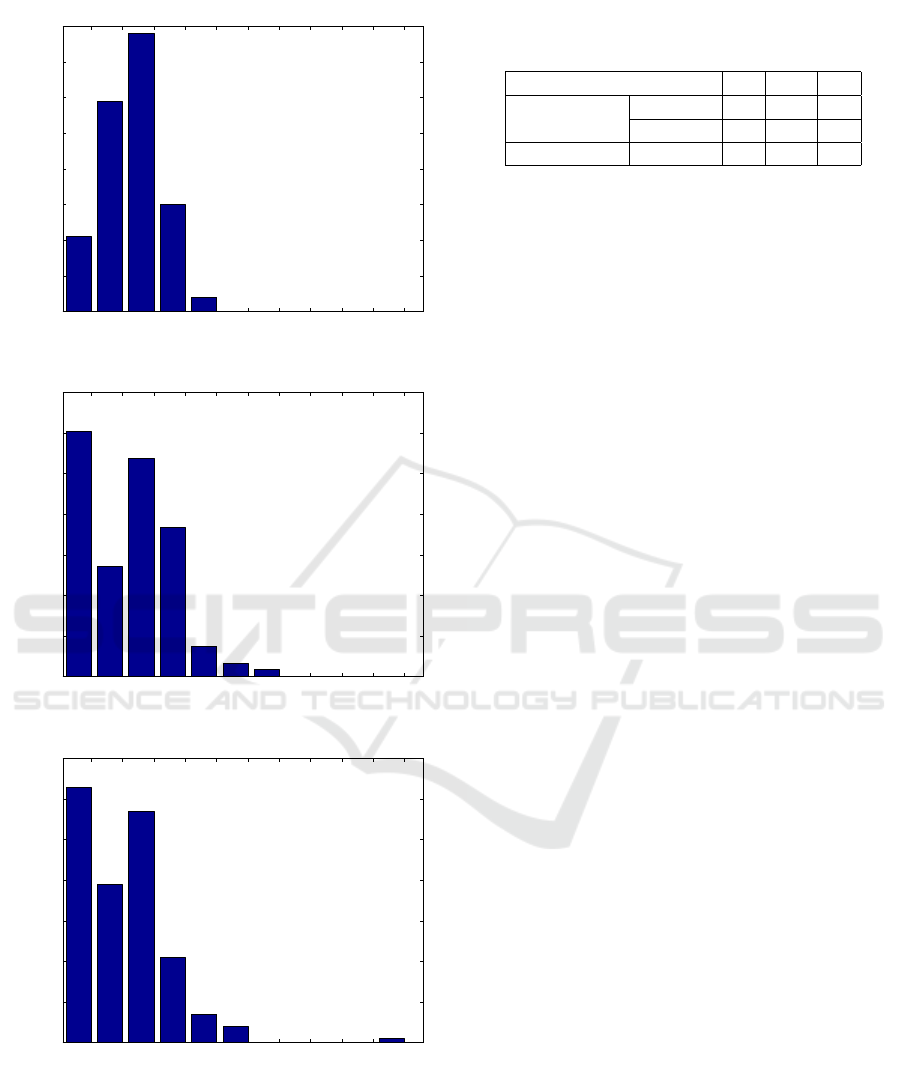
The frequency distributions of hospital admission
rates in each data set are represented in Figure 2. As
consequence of averaging, a single admission within
the 5-year period (2003-2007) is sufficient to produce
non-zero mean. Thus, the class 0 (no admissions)
in the monthly averages is less represented that in
monthly data.
Considering performance evaluation over training
data (averages), the apparent error rate was 24% and
a 36% error was found using 10-fold cross-validation.
The confusion matrices considering training and test-
ing data are presented in Table 3, while sensitivity
(S), positive predictivity (P+) and accuracy (A) values
can be found in Table 4. Notice that the LDA classi-
fier was able to correctly identify roughly 2/3 of the
combinations months/municipalities having hospital
admissions (with S = 65% in testing data), while the
fraction of false positive identifications was always
below 15%. For test data, less than 10% of the pos-
itive forecastings would be false alarms for hospital
admissions in that month for the specific municipal-
ity. The results obtained confirm that Ta, NDV I and
NO
2
levels based on remotely sensed data have the
ability to predict existence of hospital admissions due
to asthma exacerbation, using simple linear methods,
which do not consider any possible nonlinear depen-
dencies.
Table 3: Confusion matrices for training and testing data.
Training data Classifier
(averages) no admissions admissions
Truth
no admissions 19 2
admissions 64 105
Total 83 107
Training data Classifier
(monthly) no admissions admissions
Truth
no admissions 238 64
admissions 179 479
Total 417 543
Testing data Classifier
(monthly) no admissions admissions
Truth
no admissions 55 8
admissions 44 85
Total 99 93
It is important to mention that many of asthma ex-
acerbation episodes does not require healthcare atten-
tion and from those requiring it, only a small fraction
results on hospitalization. Thus, hospital admissions
are not a good indicator of mild asthma exacerbation,
quantifying only the most severe cases. Furthermore
only admissions with principal diagnosis of asthma
Forecasting Asthma Hospital Admissions from Remotely Sensed Environmental Data
127
0 0.02 0.04 0.06 0.08 0.1 0.12 0.14 0.16 0.18 0.2
0
10
20
30
40
50
60
70
80
2003−2007 based monthly averages
Absolute frequency
0 0.02 0.04 0.06 0.08 0.1 0.12 0.14 0.16 0.18 0.2
0
50
100
150
200
250
300
350
2003−2007 monthly values
Absolute frequency
0 0.02 0.04 0.06 0.08 0.1 0.12 0.14 0.16 0.18 0.2
0
10
20
30
40
50
60
70
2008 monthly values
Admissions rate per 1000 inhabitants
Absolute frequency
Figure 2: Hospital admission rates per 1000 inhabitants,
with a principal diagnosis of asthma, in the district of Lis-
boa, considering the training set with 192 points (top plot),
the training set with 960 points (middle plot) and the testing
set with 192 points (lower plot).
Table 4: Performance evaluation based on Sensitivity (S),
Positive Predictivity (P+) and Accuracy (A), expressed in
%.
S P+ A
training data
averages 63 98 66
monthly 73 88 75
testing data monthly 66 91 73
were retrieved, excluding the cases of hospital admis-
sions in which other diseases (co-morbidities) were
classified as primary diagnosis in spite of asthma ex-
acerbation were also occurring (e.g. hospital admis-
sions during asthma exacerbation but with concomi-
tant pneumonia). This constitutes a main limitation
of this work and alternative indicators and sources
of data for less severe exacerbation should be pur-
sued. Even using the most populated district of Por-
tugal, hospital admissions per municipality were not
very high, and the data size is likely to limit the per-
formance of discriminant analysis. Additionally, the
loss of time reference within the month can intro-
duce spurious information, as an admission at the first
days of a particular month will surely not depend on
the future environmental exposition during the whole
month. Future studies could therefore include a larger
dataset, for example by including more districts, and
analyze shorter time periods (e.g. weekly data).
Only environmental factors for which the monthly
base seasonal average showed relevant correlation
with admissions due to asthma in (Ayres-Sampaio
et al., 2014) were considered in this work. Nev-
ertheless PM
10
and RH exposition has been related
with asthma exacerbation in the past (Akinbami et al.,
2010; Delamater et al., 2012). It is that any possible
effect of those factors was diluted by the month-based
averages. Furthermore, the environmental effects on
asthma are likely to be more immediate (weekly or
even daily) possibly non visible using month-based
values. In particular, with respect to air temperatures
and pollutants, the intrinsic daily variability and ex-
position to extreme values which were not considered
in this work, can matter. Also, in the present work we
considered the time range from 2003 to 2008 because
we used environmental factors data already processed
in a previous work ((Ayres-Sampaio et al., 2014)). In
the near future we will consider a wider and more re-
cent temporal window and include these alternative
variables in the analysis, possibly using weekly data.
The implemented strategy only considers global
geographically dependent risk, thus other personal ex-
posure factors such as indoor air pollution, time spent
outdoors, passive smoking, allergen avoidance behav-
ior, and viral infections were not considered. Also if
a patient moves across several municipalities (multi
GISTAM 2017 - 3rd International Conference on Geographical Information Systems Theory, Applications and Management
128

locations exposure), both locations should be consid-
ered.
All these previously mentioned particularities and
limitations of the present work, namely using rough
temporal scales and not considering a personalized
approach, might explain the lower sensitivity values
compared to the overall accuracy. Still, regarding the
interest for asthma self-management tools, the classi-
fication obtained can be used as geographical depen-
dent risk indicator, in spite of the above listed limita-
tions.
4 CONCLUSIONS
The classifier developed in this work allowed to fore-
cast asthma related admissions with good accuracy
levels. The reduced rate of false positive is important
if it is to be included in information and communi-
cation technology tools for patient self-management.
It can be used as a risk warning tool, to be combined
with individual monitoring factors. Despite all the en-
vironmental variables have been processed and ana-
lyzed in a GIS software, in the future a deeper analysis
using a GIS approach and considering other factors,
not considered in this work will improve the informa-
tion on the spatial distribution of asthma hospitaliza-
tions and their relationship with the environment.
ACKNOWLEDGEMENTS
This article was supported by the Project NORTE-
01-0145-FEDER-000016 (NanoSTIMA), financed
by the North Portugal Regional Operational Pro-
gramme (NORTE 2020), under the PORTUGAL
2020 Partnership Agreement, and through the
European Regional Development Fund (ERDF).
Hern
ˆ
ani Gonc¸alves is financed by a post-doctoral
grant (SFRH/BPD/69671/2010) from the Fundac¸
˜
ao
para a Ci
ˆ
encia e a Tecnologia (FCT), Portugal.
The MATLAB licenses used in this work were
supported by Portuguese funds through CMUP
UID/MAT/00144/2013, funded by the Portuguese
Foundation for Science and Technology (FCT -
Fundac¸
˜
ao para a Ci
ˆ
encia e a Tecnologia). The authors
wish to thank the Portuguese Ministry’s of Health Au-
thority for Health Services (Administrac¸
˜
ao Central do
Sistema de Sa
´
ude, ACSS) for providing access to na-
tional hospital admissions data and to Diogo Ayres
Sampaio by the initial preprocessing of the data.
REFERENCES
Akinbami, L. J., Lynch, C. D., Parker, J. D., and Woodruff,
T. J. (2010). The association between childhood
asthma prevalence and monitored air pollutants in
metropolitan areas, United States, 2001-2004. Envi-
ronmental Research, 110(3):294 – 301.
Ayres-Sampaio, D., Teodoro, A. C., Sillero, N., Santos, C.,
Fonseca, J., and Freitas, A. (2014). An investigation
of the environmental determinants of asthma hospital-
izations: An applied spatial approach. Applied Geog-
raphy, 47:10 – 19.
Bashshur, R. L., Shannon, G. W., Smith, B. R., Alverson,
D. C., Antoniotti, N., Barsan, W. G., Bashshur, N.,
Brown, E. M., Coye, M. J., Doarn, C. R., Ferguson,
S., Grigsby, J., Krupinski, E. A., Kvedar, J. C., Link-
ous, J., Merrell, R. C., Nesbitt, T., Poropatich, R.,
Rheuban, K. S., Sanders, J. H., Watson, A. R., We-
instein, R. S., and Yellowlees, P. (2014). The Em-
pirical Foundations of Telemedicine Interventions for
Chronic Disease Management. Telemedicine and e-
Health, 20(9):769–800.
Cruz-Correia, R., Fonseca, J., Amaro, M. J., Lima, L.,
Ara
´
ujo, L., Delgado, L., Grac¸a Castel-Branco, M.,
Costa-Pereira, A., Jo
˜
ao, R., and Correia, C. (2007).
Web-based or paper-based self- management tools for
Asthma patients’ opinions and quality of data in a ran-
domized crossover study. Studies in health technology
and informatics.
Delamater, P. L., Finley, A. O., and Banerjee, S. (2012). An
analysis of asthma hospitalizations, air pollution, and
weather conditions in los angeles county, california.
Science of The Total Environment, 425:110 – 118.
Farr, T. G., Rosen, P. A., Caro, E., Crippen, R., Duren, R.,
Hensley, S., Kobrick, M., Paller, M., Rodriguez, E.,
Roth, L., Seal, D., Shaffer, S., Shimada, J., Umland,
J., Werner, M., Oskin, M., Burbank, D., and Alsdorf,
D. (2007). The Shuttle Radar Topography Mission.
Reviews of Geophysics, 45(2):RG2004.
Ferreira-Magalh
˜
aes, M., Pereira, A. M., Sa-Sousa, A.,
Morais-Almeida, M., Azevedo, I., Azevedo, L. F., and
Fonseca, J. A. (2015). Asthma control in children is
associated with nasal symptoms, obesity, and health
insurance: a nationwide survey. Pediatric Allergy and
Immunology, 26(5):466–473.
Fonseca, J. A., Costa-Pereira, A., Delgado, L., Fernandes,
L., and Castel-Branco, M. G. (2006). Asthma patients
are willing to use mobile and web technologies to sup-
port self-management. Allergy, 61(3):389–390.
GINA (2016). Global strategy for asthma manage-
ment and prevention. Technical report, Global
Initiative for Asthma. http://ginasthma.org/2016-
gina-report-global-strategy-for-asthma-management-
and-prevention/.
Marcano Belisario, J. S., Huckvale, K., Greenfield, G., Car,
J., and Gunn, L. H. (2013). Smartphone and tablet
self management apps for asthma. In Marcano Belis-
ario, J. S., editor, Cochrane Database of Systematic
Reviews, number 11, page CD010013. John Wiley &
Sons, Ltd, Chichester, UK.
Moustris, K. P., Douros, K., Nastos, P. T., Larissi, I. K.,
Anthracopoulos, M. B., Paliatsos, A. G., and Priftis,
Forecasting Asthma Hospital Admissions from Remotely Sensed Environmental Data
129

K. N. (2012). Seven-days-ahead forecasting of child-
hood asthma admissions using artificial neural net-
works in athens, greece. International Journal of En-
vironmental Health Research, 22(2):93–104. PMID:
21854178.
S
´
a-Sousa, A., Morais-Almeida, M., Azevedo, L. F., Car-
valho, R., Jacinto, T., Todo-Bom, A., Loureiro, C.,
Bugalho-Almeida, A., Bousquet, J., and Fonseca,
J. A. (2012). Prevalence of asthma in portugal -
the portuguese national asthma survey. Clinical and
Translational Allergy, 2(1):15.
Soyiri, I. N., Reidpath, D. D., and Sarran, C. (2013). Fore-
casting asthma-related hospital admissions in london
using negative binomial models. Chronic Respiratory
Disease, 10(2):85–94. PMID: 23620439.
GISTAM 2017 - 3rd International Conference on Geographical Information Systems Theory, Applications and Management
130
