
An Investigation into the Use of Solar Power in Cloud Computing
Environments
Emmanuel Kayode Akinshola Ogunshile
Department of Computer Science, University of the West of England, Bristol, U.K.
Keywords: Cloud Computing, Solar Power, Virtualisation.
Abstract: Cisco predict that by 2019, 86% of computing workloads will be carried out within a cloud computing
environment. This is leading to the dramatically increasing need for data centre expansion which in turn is
consuming more and more of the world’s natural resources to generate the electricity needed to power them.
This paper uses a fictitious electronics recycling company called Compucycle to investigate the feasibility
and cost of integrating solar power generation into Compucycle’s IT Infrastructure compared to completely
outsourcing it to a cloud service provider. It was discovered that a complete solar power solution was not
feasible due to the excessive costs it brought to the business. It was then decided that two out of four
proposed solutions in this paper were a good fit for the business. The first being a hybrid power solution
where a small portion of power is derived from the grid along with solar power generation. The second
being the outsourced option. The third and fourth solutions were disregarded due to the fact that one was
completely unfeasible and the other went against what Compucycle wanted to achieve.
1 INTRODUCTION
Compucycle Ltd is an electronics recycling
company based in Bristol, United Kingdom (UK).
They are accredited by a number of large technology
companies such as Dell (Dell, 2016), HP Inc (HP,
2016), Hewlett Packard Enterprise (HPE) (Hewlett
Packard Enterprise, 2016) and Lenovo (Lenovo,
2016). Compucycle primarily deal with the recycling
of computing hardware. Sustainability and
environmental conservation are very important parts
of Compucycle and they’re currently in year 3 of a 5
year process to make the business as energy efficient
as possible. The next stage in this process is to
attempt to power their IT infrastructure from
renewable energy sources. Compucycle have 3 sites
spread across the UK. The Bristol, Manchester and
Chatham sites each have a recycling plant and the
head office is located in Bristol. Compucycle have
stated that they would like to continue using Hewlett
Packard hardware as they are happy with it’s
reliability and performance and don’t see the need
for change. Due to the location of their sites which
are in developed urban environments where local
legislation prohibits the use of wind or hydroelectric
solutions, only a solar solution will be feasible.
Although being able to power their IT infrastructure
Ũs a key part of their plan Compucycle stress that it
must be cost effective. Compucycle will consider
cloud outsourcing methods as part of this IT
initiative. This paper only deals with the feasibility
of powering new server hardware and not existing
networking, computing, printing or electrical
systems.
Technology companies are already using
sustainable energy sources to power their data
centres, most notable are Google and Amazon Web
Services. In 2007 Google installed the largest
corporate solar panel installation at their Mountain
View campus (Google, 2016). The 1.9MW system
has been able to produce over 3,000,000kWh of
energy per year. Amazon Web Services is another
example (Amazon Web Services, 2014). As of April
2015 25% of the power consumed by their global
infrastructure is supplied from renewable energy
resources. Their 3 wind farms and 1 solar farm in the
United States generates more than 1.6 million MWh
per year.
The objectives of this research paper are:
Understand different types of solar power
technologies and how they are utilised in
different environments. This can be found in
section 3 of this paper.
Understand the concept of virtualisation and
cloud service platforms. This can be found in
Ogunshile, E.
An Investigation into the Use of Solar Power in Cloud Computing.
DOI: 10.5220/0006380107550766
In Proceedings of the 7th International Conference on Cloud Computing and Services Science (CLOSER 2017), pages 727-738
ISBN: 978-989-758-243-1
Copyright © 2017 by SCITEPRESS – Science and Technology Publications, Lda. All rights reserved
727
section 4.
Design a cloud computing solution to replace the
existing Compucycle IT infrastructure based on
the requirements set out in section 2. The
proposed solution can be found in section 5 of
this paper.
Determine whether or not the proposed solution
can be powered by electricity generated from
solar panels which can be found in section 5.2,
5.4 and 5.5.
The rest of this paper is organised as follows:
Section 2 states the requirements Compucycle have
for the proposed solution. Section 3 examines solar
power technologies, how they are utilised, what
factors can impact solar power generation and power
storage methods. Section 4 introduces the concept of
virtualisation. Finally, section 5 presents the
proposed solutions and recommendations in order to
determine the most appropriate solution for
Compucycle.
2 REQUIREMENTS
Compucycle are currently using a number of HP
tower servers, a central storage array for backup and
networking switches to make up their IT
Infrastructure. The storage and networking is
relatively new but the servers are reaching the end of
their lifespan. Each site currently has exactly the
same hardware with the exception of head office in
Bristol.
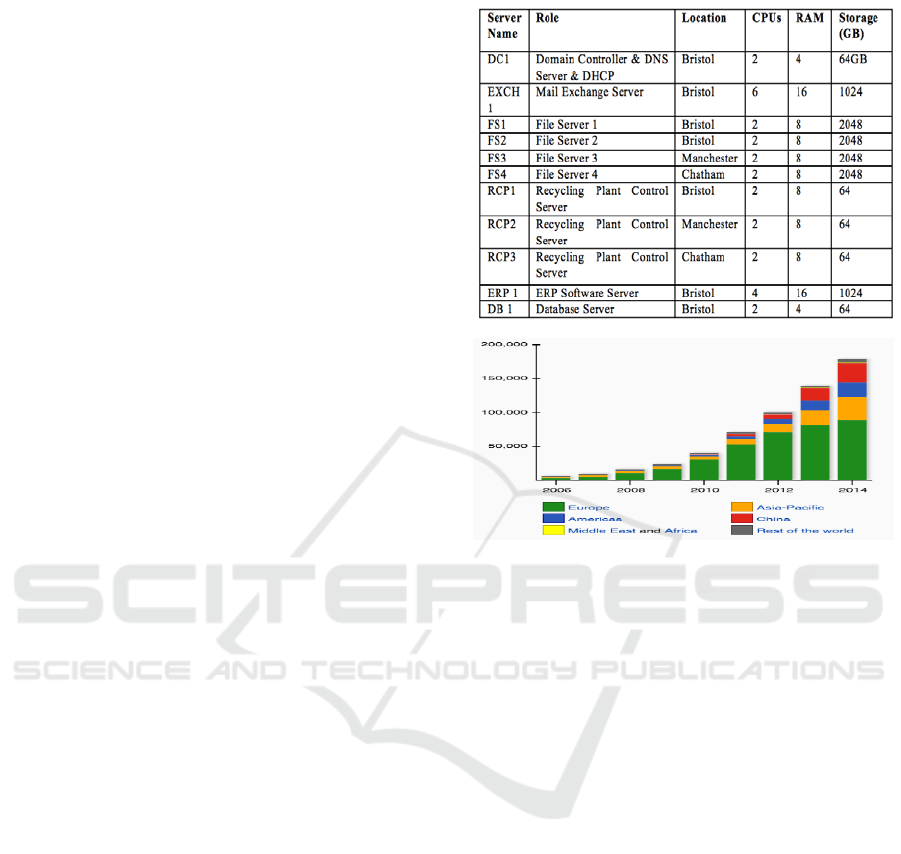
Compucycle Ltd have stated that they wish to
transition to a virtualised environment in order to
reduce underutilisation of resources, real estate
space and power consumption. As part of this
Compucycle want to attempt move their entire IT
infrastructure to the Bristol head office. Table 1
shows the resource requirements for their systems.
3 SOLAR POWER
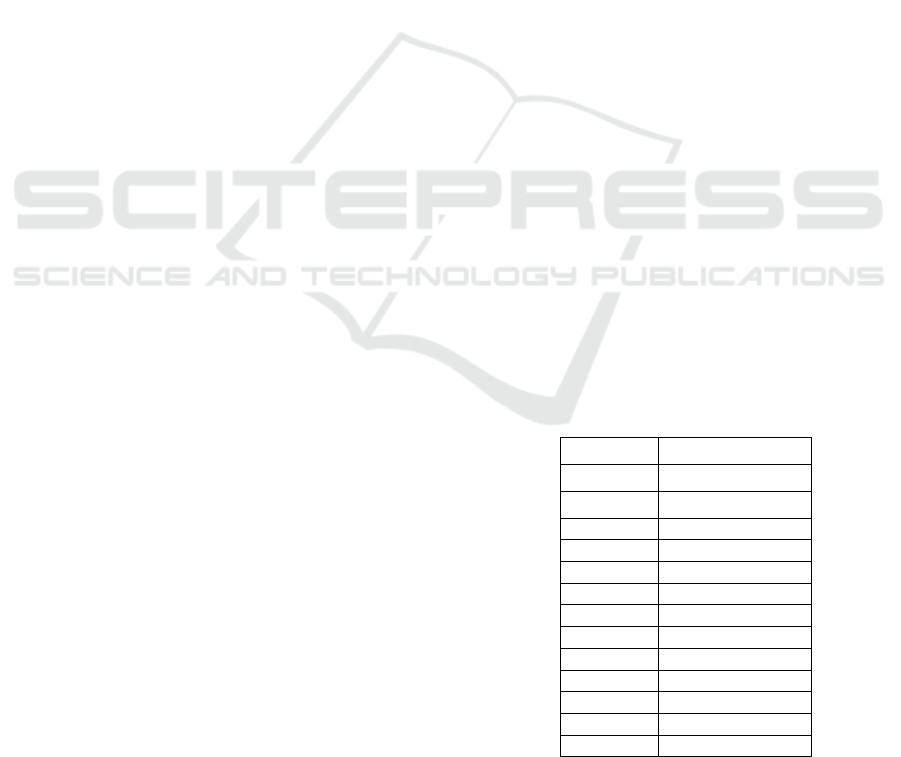
In recent years the adoption of solar energy
generation has increased exponentially. The
(International Energy Agency, 2015) states that the
biggest adoption rate has been since 2010, where the
total global solar power capacity was 40,336MW.
Since then it has continued to grow year on year
when in 2014 the total global capacity is
178,391MW figure 1. In 2015 this was expected to
reach 233,000MW, at the time of writing this, that
data was not available. As shown in figure 1 a large
Table 1: Resource requirements for Compucycle systems.
Figure 1: A graphical representation of the adoption rate
of solar power. (Growth of Photovoltaics, 2016).
portion of this growth was in Europe. As of 2014 the
UK was in the top 10 countries globally having the
capacity to produce a total of 5,104 MW. This is a
relatively small amount compared to Germany who
have the capacity to produce 38,200MW.
3.1 Solar Panel Technologies
Almost 90% of the world’s solar panels are made
from some type of silicon. The main difference is
the purity of the silicon which has a direct impact on
the efficiency of the solar panel. Silicon purity is
determined by how aligned the silicone molecules
are, this is referred to as Crystalline Silicon. From
this it is possible to create a number of different
types of solar panel. Energy Informative has written
an article on the different types of solar panels, a
summary of which can been seen in section 3.1.
3.1.1 Polycrystalline
Polycrystalline based silicon solar panels have been
on the market since 1981. They have an efficiency
range of 13 – 16%. Being able to generate 255W of
electricity.
CLOSER 2017 - 7th International Conference on Cloud Computing and Services Science
728
Advantages:
The process to make polycrystalline solar panels
is simple and more cost effective.
The process to make polycrystalline produces
less waste silicon compared to others.
Disadvantages
The efficiency of polycrystalline solar panels is
considerably less than monocrystalline based
solar panels.
Polycrystalline solar panels have a much lower
space efficiency compared to other solar panel
types.
3.1.2 Monocrystalline
Monocrystalline solar panels are made up of
cylindrical silicon ingots. Monocrystalline solar
panels are the most efficient solar panels with
having a maximum efficiency of 21.5% being able
to generate up to 345W of electricity per year.
Advantages:
Monocrystalline solar panels are more space
efficient compared to other types of solar panels.
They have a longer life span than other types of
solar panels.
Monocrystalline solar panels perform better in
lower light conditions.
Disadvantages:
They are the most expensive type of the solar
panel types.
If the panel becomes covered with debris or
shade the panel will cease to operate.
The production of Monocrystalline solar panels
produces a large amount of waste silicon.
Monocrystalline solar panels are not as efficient
in warmer weather.
3.1.3 Thin-Film Solar Panels (TFSP)
Thin-Film Solar panels are relatively new compared
to Crystalline based solar panels. They are
constructed by depositing one or several layers of
solar cell material onto conductive material. TFSP
prototypes have reached an efficiency rate of 7-13%
and production models operate at 9%.
Advantages:
Mass production of TFSP is very simple.
They can be made flexible opening up numerous
more applications.
They are less affected by temperature and
shading.
Disadvantages:
They require a large amount of space.
They don’t produce as much electricity
compared to other types of solar panels.
They degrade a lot faster than other types of
solar panels.
It is clear from this that the Monocrystalline solar
panel is the better performing solar panel with much
higher efficiency, smaller footprint, longer lifetime
and better performance in lower light conditions.
Therefore, the recommendation for Compucycle at
this point is to use monocrystalline solar panels.
Comparison of a range of monocrystalline solar
panels can be found in 3.4.
3.2 Factors Affecting Solar Power
Generation
A report written by the NREL comparing studies of
solar panel degradation across a diverse range of
countries and environments states that the speed and
amount they degrade varies greatly on the type of
solar panel as well as the environment that it
operates in.
3.2.1 Sunshine Hours
Geographical locations can impact the ability to
generate solar power as different areas of the world
have varying amounts of sunshine hours throughout
the year. Sunshine hours need to be taken into
account when exploring solar solutions. Table 2
shows the average amount of sunlight hours over a
29 year period at the closest weather monitoring
station to the Compucycle Bristol site.
Table 2: Average sunlight hours over 29 years at the
Filton Weather station provided by the Met Office.[12].
Month Sunshine Hours
Jan 58.5
Feb 74.8
Mar 112.7
Apr 170.8
May 199.6
Jun 214.7
Jul 217.7
Aug 201.8
Sep 149.9
Oct 104.8
Nov 69.1
Dec 52.7
Annual 1627.0
When this is compared to a different geographical
location entirely such as Las Vegas, the amount of
An Investigation into the Use of Solar Power in Cloud Computing
729
sunshine hours per year is completely different.
Table 3 shows that Las Vegas has more than twice
the amount of sunshine hours as the UK. Bringing
into question the amount of power than can actually
be generated from solar technology in that particular
location.
Table 3: Average sunlight hours in Las Vegas, Nevada
provided by Weather2Travel.com.
Month Sunshine Hours
Jan 248
Feb 252
Mar 310
Apr 360
May 403
Jun 390
Jul 403
Aug 372
Sep 330
Oct 310
Nov 240
Dec 248
Annual 3866
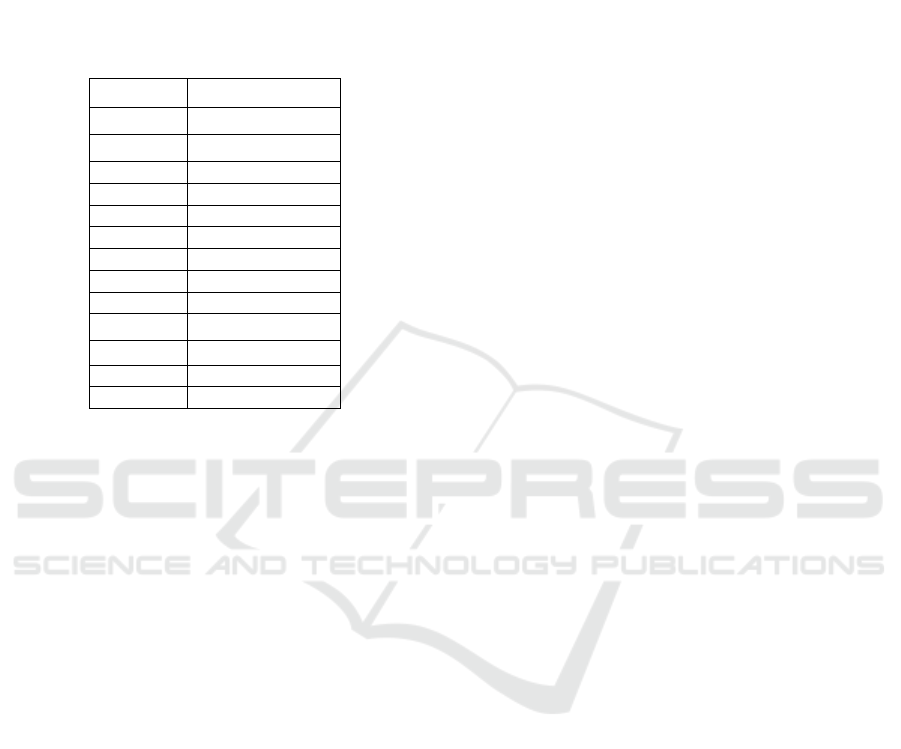
3.2.2 Placement of Solar Panels
The sun moves across the sky at different elevations
during different periods of the year. Therefore, it is
important to understand the impact sun elevation on
solar power generation. Figure 2 is a graph that
shows the elevation of the sun at the Compucycle
Bristol head office site. This graph specifically plots
the elevation of months December to June. The
graph shows a massive variation in elevation making
it difficult to best determine at what angle to install a
solar panel. During summer the elevation is as
follows:
Sunrise: 04:00AM at elevation 2°
Mid-Morning: 10:00AM at elevation 53°
Mid-Day: 12:00PM at elevation 62°
Mid-Afternoon: 3:00PM at elevation 46°
Sunset: 8:00PM at elevation 2°
Winter elevation is as follows:
Sunrise: 08:00AM at elevation 1°
Mid-Morning: 10:00AM at elevation 9°
Mid-Day: 12:00PM at elevation 14°
Mid-Afternoon: 3:00PM at elevation 5°
Sunset: 3:50PM at elevation 1°
From this it is clear that if the solar panels are
installed to best capture the sunlight during summer
will capture very little or no sunlight during the
winter months.
Charles Landau states that it has always been
common practice to place solar panels facing true
south in the Northern Hemisphere and true north in
the Southern Hemisphere. This is to ensure that
sunlight always reaches solar panels throughout the
day. The elevation paths in figure 2 seem to support
this. Whilst this may be true for most cases
Professor Ralph Gottschalg from Loughborough
University claims this method is wrong and can lead
to spikes of energy at midday.
Although this may sound like good news to
someone storing energy this is in fact bad news if
they are feeding energy back to an electricity grid.
Gothschalg uses Germany in his example, a country
that has the most solar panel installations in Europe.
He states that having too many installations facing
south causes huge spikes in the electricity grid at
midday making the grid not only unstable but
forcing suppliers to give power away very cheaply
because there is so much of it.
To combat this Gothschalg recommends that the
UK follows Germany’s new policy of only installing
solar panels facing east or west in order to achieve a
smoother flow of electricity throughout the day.
Although this information is very useful it does not
give any reference on what angle to best place the
solar panels. Landau however does give guidance on
this problem.
He recommends that it is best to adjust the
elevation of panels twice a year. The elevation
angles should be the latitude of the location plus 15°
in winter and minus 15° in summer. From this it is
possible to work out the best angles for solar panel
elevation for the Compucycle Bristol site:
Summer: 37.53°
Winter: 67.53°
3.2.3 Shading
It is clear that solar panels need direct uninterrupted
sunlight in order to perform at their highest levels.
When talking about solar panel shading it does not
only mean shadow created by physical objects.
It also extends to weather conditions such as
overcast skies. A paper written by G. Pachpande et
al studying the effects of solar shading, describes
two forms of shading:
Soft source shading: An object that is in the path
of the sunlight reducing the amount of light reaching
the solar panel. Examples are trees, birds, leaves and
rooftop chimneys. Soft sources do not permanently
stop light from reaching the panel and often cast
shadows that move across the panel with the sun.
Hard source shading: This can be described as
objects that completely prevent sunlight from
CLOSER 2017 - 7th International Conference on Cloud Computing and Services Science
730
reaching the panels. This is commonly debris that is
resting on the panel itself such as leaves.
Figure 2: A graph plotting the elevation of the sun at the
Compucycle site in Bristol from Jun -Dec. Generated
using a tool created by the University of Oregon.
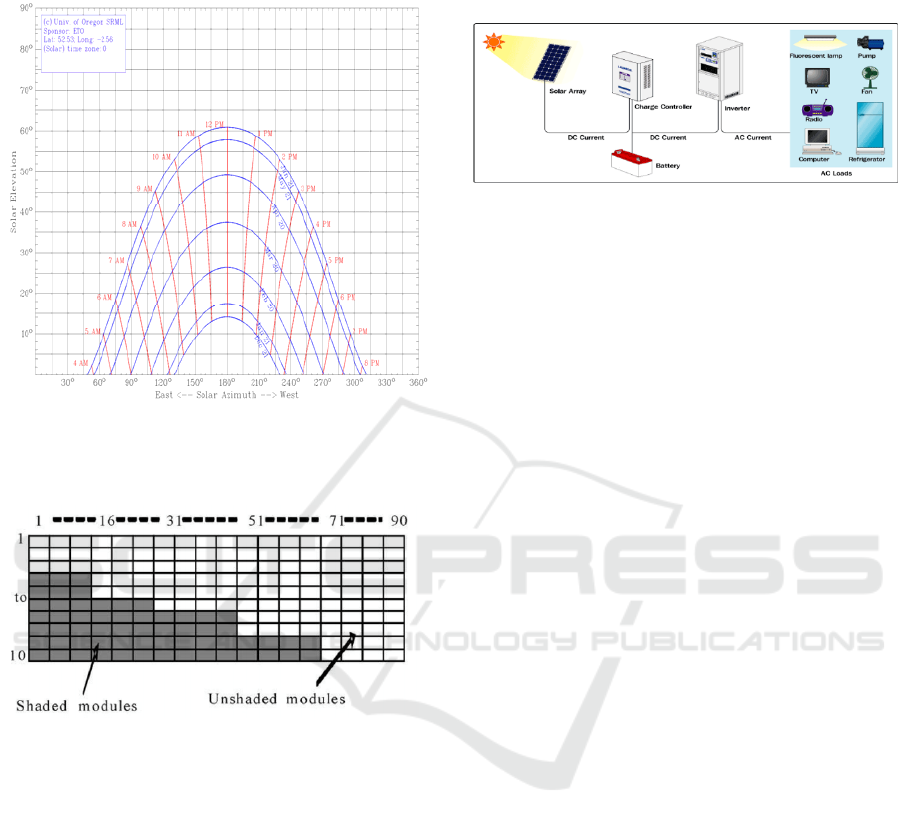
Figure 3: Example of Solar Panel Shading.
Pachpande goes on to state that when a single solar
panel cell is covered by a hard source the voltage of
that module will drop to half of it’s unshaded value
in order to protect itself. If enough cells are shaded,
then the panel will not generate any electricity at all
and will become a drain on the system. Figure 3 is a
graphic showing shading on a solar panel.
Considering the Compucycle head office in
Bristol is also a recycling site that is not surrounded
by other buildings and trees, there will be very little
shading in this location.
3.3 Methods for Utilising Solar
Technology
There are many different ways of utilising solar
energy to generate power. Some methods are for
small domestic and business implementations others
are for larger implementations built to feed power
straight into the grid. This sections explores the
different methods for utilising solar technology.
Figure 4: Diagram of a rooftop based solar panel system.
3.3.1 Conventional Rooftop
Rooftop solar panels have become more and more
prevalent in the UK in recent years. This is mainly
due to government grants and schemes where
surplus energy can be sold back to energy suppliers.
Figure 4 is a system model showing the process of
how solar energy is converted into electricity for
home use. DC current produced from the solar array
is transferred to a charge controller where it is
regulated and transferred to a battery for storage.
Either from the battery or straight from the charge
controller the DC current it transferred to an inverter
where it is converted to AC current thus suitable for
home appliance use. Power being transferred back to
the utility grid is transferred via the inverter. Figure
4 does not show this.
3.3.2 Solar Farms
Solar farms are the large scale implementation of
solar panels that generate electricity to feed straight
into the utility grid. They can range between 1 acre
and 100 acres in size and are often found in rural
areas. They are eligible for grants and discounts
from the UK government. They are currently the
most natural and eco friendly way to generate
energy. Solar farms are designed in such a way that
they can be combined with agricultural farming thus
making the maximum use of the land they use. To
put things into perspective for every 5MW solar
farm installed it can produce electricity for up to
1,515 homes. Each 5MW installation takes up
approximately 25 acres of land.
3.3.3 Concentrated Solar Power
Concentrated solar power generates electricity by
using mirrors to concentrate the sun’s energy and
convert it to high temperature heat. This heat is then
captured and converted into electricity. There are
An Investigation into the Use of Solar Power in Cloud Computing
731
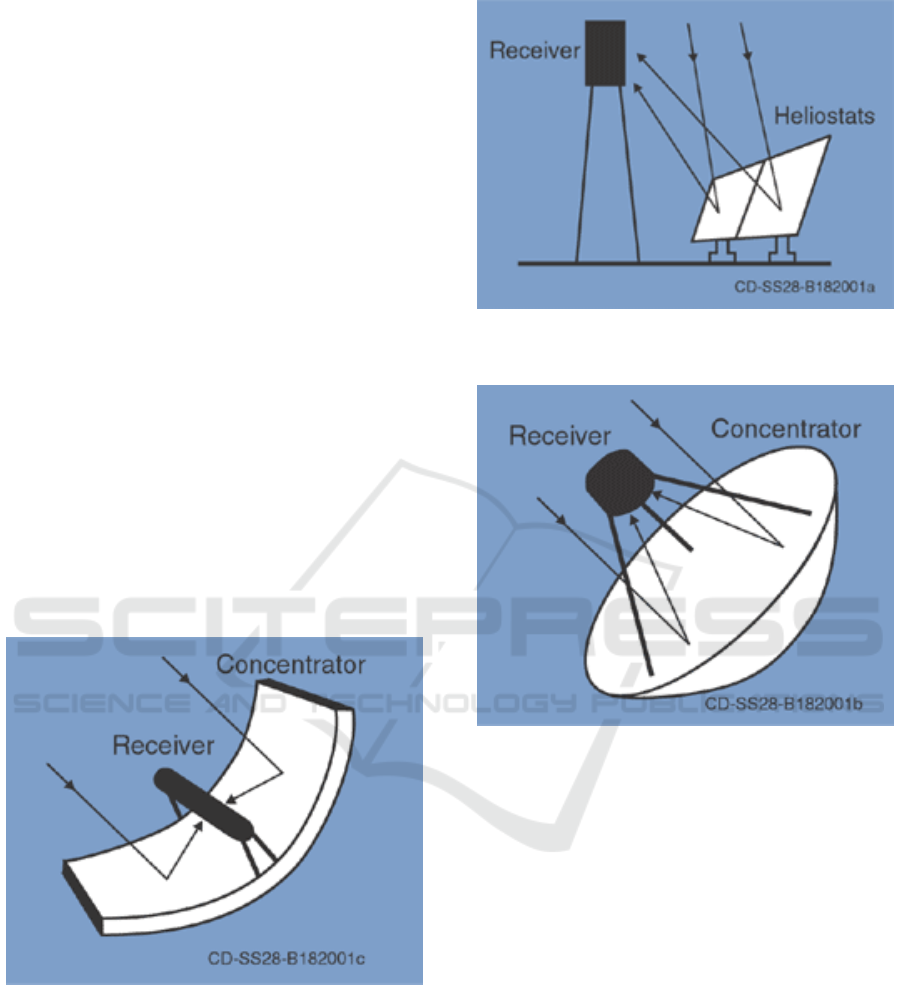
three different methods for concentrating the solar
energy and capturing it:
Trough Systems: This is a large U shaped
reflective surface with a cylinder filled with oil in
the middle. This oil is heated up to 750°F which in
turn is used to boil water to create steam to power
turbines and generators. Figure 5 shows how a
trough system works.
Power Tower Systems: This method uses large
flat reflective surfaces to track the sun’s rays
throughout the day and reflect them towards a
central receiver. Again this receiver contains liquid
that’s heated to produce steam to power turbines and
generators in order to produce electricity. Figure 6
shows a power tower system.
Dish Engine Systems: This method uses a large
reflective dish to reflect sunlight to a receiver
mounted on the focal point. This dish tracks the
sunlight as it moves across the sky. The dish is
connected to an external combustion engine filled
with hydrogen gas. When the heat is transferred
from the dish to the engine the gas expands causing
the pistons inside to turn and power a crankshaft
connected to an external electricity generator. Figure
7 shows the dish used in this method, it is very
similar to a conventional satellite dish but they are in
fact much larger.
Figure 5: Trough System for Concentrating Solar Power.
Figure 6: Power Tower System for Concentrating Solar
Power.
Figure 7: Dish Engine System for Concentrating Solar
Power.
3.4 Comparison of Solar Panels
As established in section 3.1 monocrystalline solar
panels are the better performing. This section
compares several solar panels to find the best fit for
Compucycle. According to the solar panel
comparison website theecoexperts.com the top
monocrystalline solar panels are:
SunPower X21-345-COM
Sanyo HIT Double 195
SunPower 327-320
AUO SunForte PM318B00
Tables 4, 5, 6 and 7 give further specification of
these panels.
CLOSER 2017 - 7th International Conference on Cloud Computing and Services Science
732
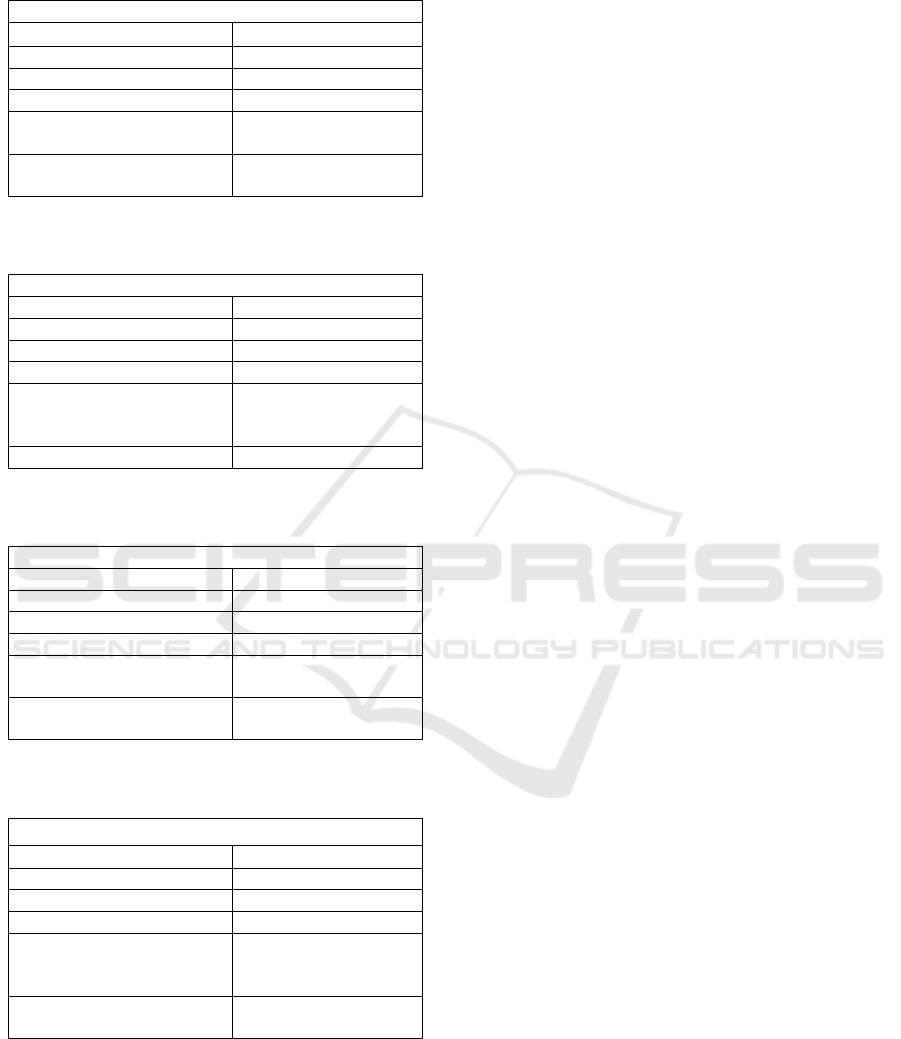
Table 4: Technical information on the SunPower X21-
345-COM.
SunPower X21-345-COM
Maximum Efficiency 21.5%
Maximum Power Output 345W
Solar Cells Per Panel 96
Size HxWxD (mm) 1559 x 1046 x 46
Warranty
25 Year Product and
Power Warranty
Price
Not publically
available
Table 5: Technical information on the Sanyo HIT Double
195 solar panel.
Sanyo HIT Double 195
Maximum Efficiency 20.5%
Maximum Power Output 249W
Solar Cells Per Panel 96
Size HxWxD (mm) 1351 x 898 x 60
Warranty
5 Year Product and
20 Year Power
Warranty
Price $849.00 (£507.09)
Table 6: Technical information on the SunPower 327-320
solar panel.
SunPower 327-320
Maximum Efficiency 20.4%
Maximum Power Output 327W
Solar Cells Per Panel 96
Size HxWxD (mm) 1559 x 1046 x 46
Warranty
25 Year Product and
Power Warranty
Price
Not publically
available
Table 7: Technical information on the AUO SunForte
PM318B00 solar panel.
AUO SunForte PM318B00
Maximum Efficiency 19.5%
Maximum Power Output 318W
Solar Cells Per Panel 96
Size HxWxD (mm) 1559 x 1046 x 46
Warranty
10 Year Product and
25 Year Power
Warranty
Price
Not publically
available
Notes: ecoexperts.com stated Ja Solar JAC M6PA-4
as the second best solar panel, upon further research
this is in fact an individual solar cell. Therefore, it
has not been included in this paper. SunPower solar
panel prices are not publically available as they are
not sold individually.
It is clear that the SunPower X21-345-COM best
panel with a much higher power output of 345W
compared to the others and a higher efficiency rate
of 21.5%. It offers the best warranty out of the
selection. It is recommended that Compucycle use
this panel or SunPower 327-320. There is very little
difference between these two panels and are the best
performing out of the selection. Price will have to be
accounted for but is not possible in this paper due to
prices per panel not being published by SunPower or
AUO.
3.5 Solar Battery Technologies
Kathie Zipp claims that the batteries used in solar
power systems have to operate under unusual
circumstances compared to others. They have to
cope with unstable and irregular power flows along
with heavy charging and discharging. For a
conventional battery this would cause significant
damage to the battery. Two types of battery
technology, Lead Acid and Lithium Ion are the most
common in solar power systems. Deep cycle lead
acid batteries are very similar to car batteries and
have been used for off-grid power storage for many
decades due to their low cost, reliability and
predictable performance. Solar lead acid batteries
are designed to be able to charge at very low
currents so they are able to take advantage of any
power available.
Lithium ion batteries are commonly found in
most household electrical goods such as laptops and
smartphones. However, they are applicable in solar
energy environments. They have high energy
density making the battery much lighter and smaller
than lead acid batteries, the life of the battery is
much longer and very high efficiency ratings
providing much faster charge times.
3.5.1 Tesla Powerwall
The Tesla Powerwall is a wall mounted lithium ion
battery developed by Tesla Motors. It charges using
power generated from solar panels and stores it for
later use. Each Powerwall unit has a 6.4kWh storage
capacity which is sufficient for the average home,
however it is possible use multiple batteries in a
single environment. Tesla is not only targeting the
Powerwall at home users but commercial
environments as well with a 10kWh variation of the
Powerwall called Powerpack. May 2015 Tesla
announced it would be partnering with Amazon Web
Services to trial the Powerwall technology in their
data centres with a 4.8MW installation in their US
An Investigation into the Use of Solar Power in Cloud Computing
733
West data centre. The cost of a Powerwall is $3000
and $3500 for the Powerpack. At the time of writing
that is approximately £2112 and £2464.
Here the clear choice for Compucycle would be a
Lead Acid Battery. It is a proven and reliable
technology that has been used for a number of years
to store power generated from solar panels. The
recommended battery for Compucycle is the
Sonnenschein A600 Solar OPzV Gel 3500. Each
battery is able to store up to 42 kWh of energy. Each
battery costs £1,578.78 which is half the price of the
Tesla battery and comes with over four times more
storage.
4 VIRTUALISATION
TECHNOLOGIES
The concept of Virtualisation can be defined as
using hardware and software to create the illusion
that two or more entities are present when only one
physical entity exists. There are many forms of
virtualisation, the most common computing forms
are:
Server Virtualisation: Making multiple servers run
virtually on one physical server. This provides
greater compute resource utilisation across a set of
servers for example. These can also be referred to as
Virtual Machines (VMs).
Desktop Virtualisation: Allows a user to switch
between different operating systems on the same
computer. These can also be referred to as Virtual
Machines (VMs).
Network Virtualisation: This gives the illusion that a
user is connected directly to a network even though
no physical connection exists. This is most
commonly used to create Virtual Private Networks
where users are access a network via the internet
without physically being connected to the network.
Storage Virtualisation: Similar to server
virtualisation, it gives users the ability to create
individual virtual hard disks that can spread across
several physical hard disks. Again providing greater
resource utilisation due to data not being restricted
to a physical hard drive.
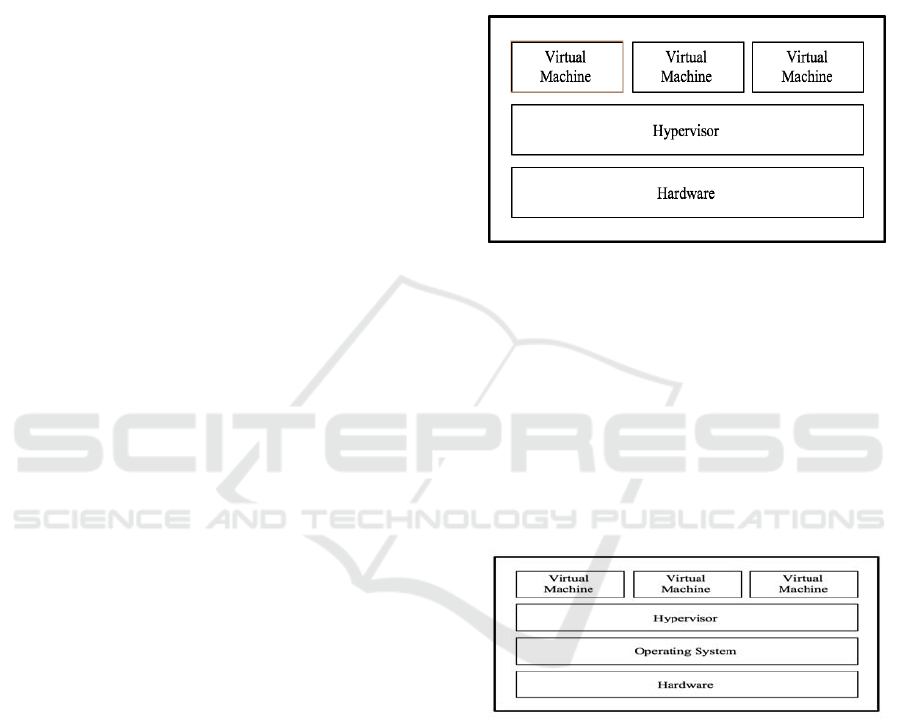
4.1 Hypervisors
Virtualisation is achieved through the use of
Hypervisors. A hypervisor is a layer of software that
sits below the virtual machines and above the
hardware it is running on. They control the
communication between the virtual machines and
the hardware. Without the Hypervisor multiple
operating systems will want simultaneous control of
the same piece of hardware. There are two types of
Hypervisor, Type 1 and Type 2. Type 1 is often
referred to as a bare-metal implementation. Meaning
the Hypervisor runs directly on the compute
hardware essentially as it’s own operating system
see figure 8.
Figure 8: Type 1 Hypervisor Architecture.
Type 2 is where the hypervisor runs on a hosted
operating system. Figure 9 is an example of a Type 2
Hypervisor. Type 2 hypervisors are considered
easier to implement compared to Type 1 but can be
slower as it has to rely on the hosted operating
system to handle the communication to the
hardware. Type 2 hypervisors are considered less
secure than Type 1 due to the fact that the host
operating system could become infected with
malicious software.
Figure 9: Type 2 Hypervisor Architecture.
4.1.1 Hypervisor Features and Examples
According to Software Insider the typical features in
a Hypervisor are: VM creation, VM cloning, VM
backup/restore, VM snapshots, live migration,
dynamic resource allocation, VM migration, storage
migration, performance reports, virtual firewalls,
failover and thin provisioning.
4.1.1.1 VMware vSphere
vSphere is a data centre management and
CLOSER 2017 - 7th International Conference on Cloud Computing and Services Science
734

virtualisation application suite developed by
VMware and is one of the most widely used data
centre management and virtualisation packages
globally. It is a cloud operating system that can
manage large collections of infrastructure such as
servers, storage arrays and networks and provide
them as a pool of resources within the data centre.
Key features include VM creation, cloning and
migration, x86 support, integration with operations
management giving better insights, API integration,
workload capacity optimisation, workflow
automation and performance monitoring. vSphere is
a Type 1 hypervisor allowing it to be more secure
and perform better than some Type 2 hypervisors.
4.1.1.2 Microsoft Hyper-V
Hyper V is Microsoft’s main virtualisation platform,
it utilises the virtualisation technology built into
Windows Server. It has much the same features as
vSphere and can be integrated with with System
Centre, Microsoft’s separate data centre
management suite.
4.2 Hypervisor Recommendation
vSphere is essentially an all in one data centre
management package that can be installed straight
onto the hardware as a Type 1 hypervisor which
makes it more secure and faster. Hyper V is a Type
2 hypervisor and on it’s own doesn’t provide the
data centre management features that vSphere does.
Based on this the recommended hypervisor package
for Compucycle is VMware vSphere.
5 SOLUTIONS
This section looks at the possible solutions for
Compucycle and attempts to determine their
approximate cost over a 5 year period. Starting with
various solar panel solutions and on premise
solutions. Then looking at alternative solutions such
as cloud platforms.
Based on the requirements set out in section 2 it
has been decided Hewlett Packard Enterprise (HPE)
Hyper Converged 250 System is the best fit for
Compucycle. It’s all in one design where the Server,
Storage and Networking is contained in one compact
box immediately satisfies the requirements. The
Hyper Converged 250 system is purpose built to
host virtualized systems and offers support for both
VMware vSphere and Microsoft Azure.
Before the solutions can be designed it is
necessary to first understand: the server
configurations, power requirements, grid electricity
cost, roof space and solar panel placement.
5.1 Server Configurations
Considering the infrastructure will be virtualized and
there is sufficient network bandwidth to all of the
sites it is possible to house all of the servers in one
location. Using the requirements provided in table 1
the following configuration has been provided for a
Hyper Converged 250 chassis. Nodes 3 & 4 are
duplicates of 1 and 2. They will be used for failover
and redundancy purposes.
Node 1: 2x Intel Xeon E5-2640v3 CPUs, 512GB
RAM, 2x960GB SSD, 4x 1.2TB 10K SAS,
2x10GbE SFP Ports.
Node 2: 2x Intel Xeon E5-2640v3 CPUs, 256GB
RAM 2x960GB SSD, 4x 1.2TB 10K SAS, 2x10GbE
SFP Ports.
Node 3: 2x Intel Xeon E5-2640v3 CPUs, 512GB
RAM, 2x960GB SSD, 4x 1.2TB 10K SAS,
2x10GbE SFP Ports.
Node 4: 2x Intel Xeon E5-2640v3 CPUs, 256GB
RAM 2x960GB SSD, 4x 1.2TB 10K SAS, 2x10GbE
SFP Ports.
The price for this configuration is not publically
available, however the starting list price per system
is approximately $121,483. At the time of writing
this that is equivalent to £85,437.09.
System backups will take place on a separate
existing storage array that is not in the scope of this
paper.
5.2 Power Requirements
This section will use the maximum power
consumption possible for the Hyper Converged 250
system.
The power requirements per site for the new
HPE Hyper Converged system are calculated using a
number of equations to establish the maximum
Kilowatts per hour used. The equation for this is as
follows:
Power in Kilowatts = S (Volt amps or VAC) x
Power Factor / 1000.
(1)
P
(KW)
= S
(VA)
× PF / 1000
In order to calculate the power factor, the following
equation is required.
Power Factor = input watts / voltage amps.
(2)
PF = W/VA
An Investigation into the Use of Solar Power in Cloud Computing
735
HPE do not publish the power factors of their
servers, hence the need to calculate it. Each system
has 2x 1400 power supplies of which the VA is 1570
making the equation PF = 2800/3140. The result of
which is 0.8917197452. Meaning the system is 89%
power efficient.
To calculate the power consumption in kWh of
the system the equation will be P = 3140 x
0.89/1000. The result of which is 2.7946kWh.
Considering these systems are likely to be on 24/7
365 days a year each system will use a maximum of
67.0704KW every 24 hours, 469.4928KW per week,
2040.0607946KW per month and 24,480.696KW
per year. Using this it is possible to establish the
maximum power requirements for the system.
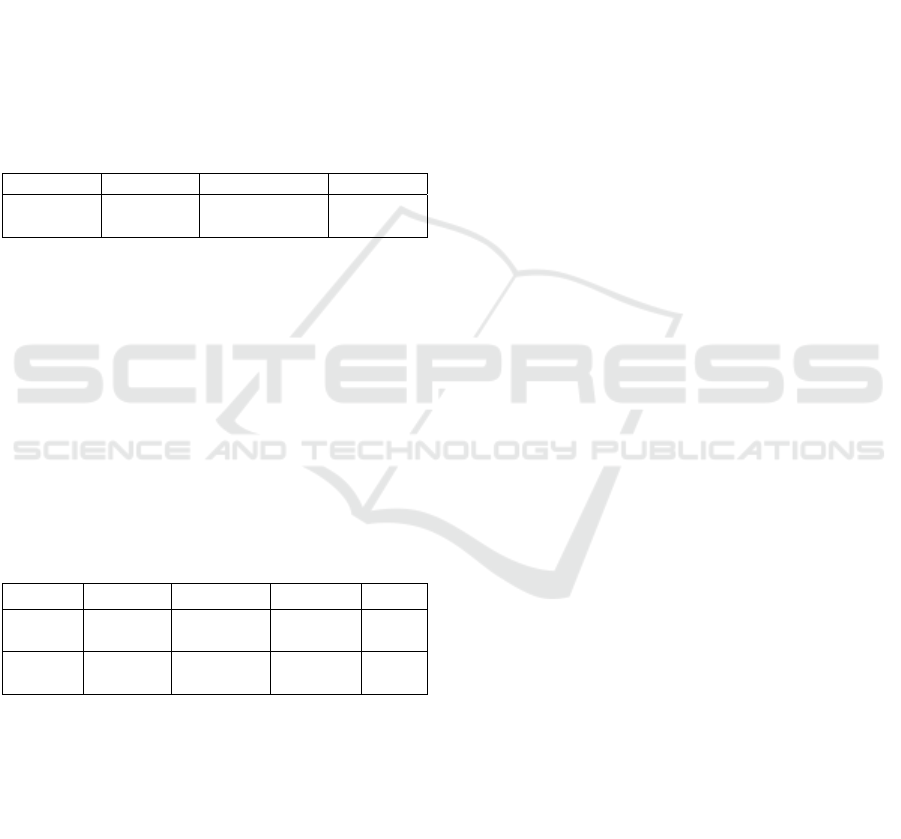
Table 8: Power consumption of the HPE Hyper Converged
250 System.
Daily Weekly Monthly Yearly
0.0670704
MW
0.4694928
MW
2.040.0607946
MW
24.480696
MW
5.3 Grid Electricity Cost
This section calculates the cost of powering the
solution using electricity from the grid. As
calculated in 6.2 each system uses 2.7946kWh per
hour. Using the EDF Energy unit rate comparison
calculator it is possible to determine the electricity
price per kWh for the Bristol head office area which
is 13.35p per kWh. Table 9 shows the prices per
hour, day, week, month and year to power the Hyper
Converged 250 system from the electricity grid.
Table 9: Grid Electricity cost of the HPE Hyper
Converged 250 System.
Hourly Daily Weekly Monthly Yearly
37.30791p 895.38984p
6,267.72888
p
26,861.6952
326817.
2916p
£0.375 £8.955 £62.675 £268.615
£3268.1
75
5.4 Roof Space
The main building at the Compucycle Bristol site is
67m x 25m. Making the roof space 1675m
2
. This
means that the rooftop can accommodate the
following maximum amount of solar panels:
SunPower X21-345-COM: 966
Sanyo HIT Double 195: 966
SunPower 327-320: 1323
AUO SunForte PM318B00: 966
Obviously these numbers are excessive and way
beyond what Compucycle need to power their
infrastructure.
5.5 Solar Panel Placement
As described in section 3.2.2 the recommended
angle for the solar panels to be installed in Bristol is
37.5 degrees in the summer and 67.53 degrees in the
winter. Next the direction of the solar panels needs
to be considered. Compucycle will not be feeding
any energy back to the electricity grid so there is no
need to compensate for the spikes in the electricity
grid mentioned by Gothschalg. Therefore, the
recommendation at this point is to have the solar
panels facing true south. As stated in section 6.2 the
daily power requirement of the Hyper Converged
250 system is 67.0704kWh. Using the solar panels
listed in section 3.4 the minimum amount of solar
panels required to power the system entirely are:
- SunPower X21-345-COM: 195
- Sanyo HIT Double 195: 270
- SunPower 327-320: 206
- AUO SunForte PM318B00: 211
5.6 Proposed Solutions
Solution 1: On premise solution using the Hewlett
Packard Enterprise Hyper Converged 250 System
running Microsoft Azure. This solution uses solar
energy to entirely power the system.
1 x Hyper Converged 250 System
(£85,437.09)
Hyper Converged 250 System 24/7 Care
Pack (£7150 per year)
195 x SunPower X21-345-COM Solar Panels
(N/A)
OR
270 x Sanyo HIT Double 195 Solar Panels
(£161,215)
OR
206 x SunPower 327-320 (N/A)
OR
211 x AUO SunForte PM318B00 (N/A)
2x A600 Solar OPzV Gel 3500 (£3,157.56)
Installation, maintenance and solar panel
fixings. (N/A)
Azure professional support (£7330.80 per
year)
Total Cost over 5 years.
Year 1 - £261,132.80
Year 2 - £14,480
Year 3 - £14,480
CLOSER 2017 - 7th International Conference on Cloud Computing and Services Science
736
Year 4 - £14,480
Year 5 - £14,480
Total: £319,052.8
Solution 2: On premise solution using the Hewlett
Packard Hyper Converged 250 System running
Microsoft Azure. This solution is powered by
electricity from the grid.
1 x Hyper Converged 250 System
(£85,437.09)
1x Hyper Converged 250 System 24/7 Care
Pack (£7150 per year)
Electricity from the grid (£3268.175)
Azure professional support (£7330.80 per
year)
Total Cost over 5 years.
Year 1 - £103,186.07
Year 2 - £17,748.98
Year 3 - £17,748.98
Year 4 - £17,748.98
Year 5 - £17,748.98
Total: £174,181.99
Solution 3: On premise solution using the Hewlett
Packard Enterprise Hyper Converged 250 System
running Microsoft Azure. This solution uses a
hybrid power system where up to 42 kWh can be
derived from solar sources and the rest is derived
from the power grid.
1 x Hyper Converged 250 System
(£85,437.09)
Hyper Converged 250 System 24/7 Care
Pack (£7150 per year)
98 x SunPower X21-345-COM Solar Panels
(N/A)
OR
135 x Sanyo HIT Double 195 Solar Panels
(£68,492)
OR
104 x SunPower 327-320 (N/A)
OR
106 x AUO SunForte PM318B00 (N/A)
1x A600 Solar OPzV Gel 3500 (£1,578.78)
Installation, maintenance and solar panel
fixings. (N/A)
Azure professional support (£7330.80 per
year)
Electricity from the grid (£1634.9)
Total Cost over 5 years.
Year 1 - £171,622.90
Year 2 - £16,114.90
Year 3 - £16,114.90
Year 4 - £16,114.90
Year 5 - £16,114.90
Total: £236,082.50
Solution 4: Cloud solution using the Azure platform
hosted by Microsoft. The prices shown below are the
closet possible match to the requirements set out in
Table 1.
Virtual machines (£26,290.72 per year)
Storage (£8,407.56 per year)
Azure Professional Support (£7,330.8 per
year)
Total Cost over 5 years.
Year 1 - £42,029.08
Year 2 - £42,029.08
Year 3 - £42,029.08
Year 4 - £42,029.08
Year 5 - £42,029.08
Total: £210,145.40
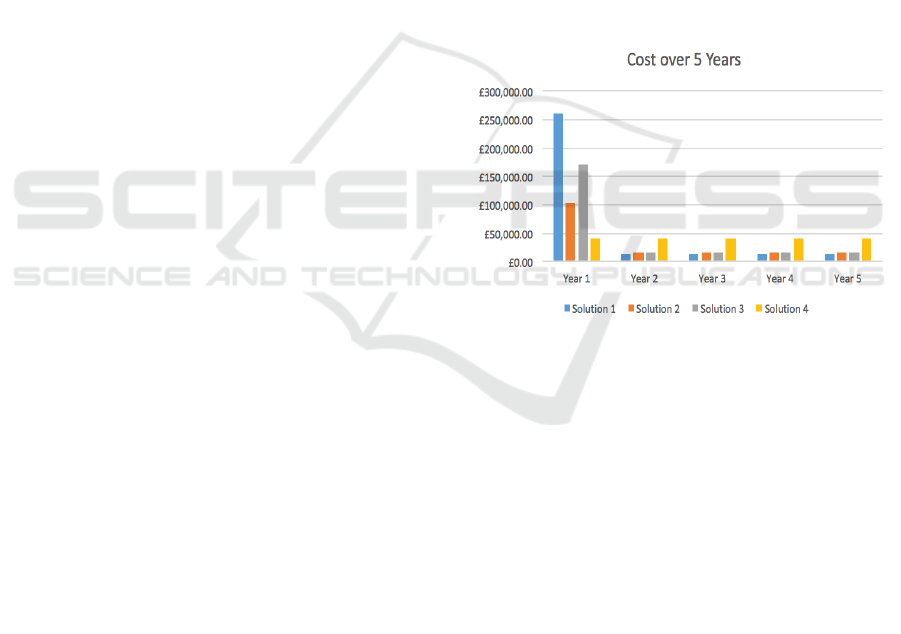
Figure 10: Graph comparing the cost of the proposed
solutions over 5 years.
6 CONCLUSIONS
It is clear that solution 2 has the lowest overall cost
spread over 5 years. It does however go against what
Compucycle are trying to achieve by including no
sustainable power sources at all and drawing power
directly from the utility gird. Solution 4 outsources
Compucycle’s server infrastructure altogether to a
3
rd
party and as figure 10 shows it has the most even
cost spread over 5 years compared to the other
solutions.
Solution 1 attempts to completely power the
infrastructure from renewable energy which is
highly unfeasible for Compucycle, not only from a
cost perspective but because solar power is not
guaranteed power due to the factors mentioned in
section 3.2. Perhaps, the most appropriate solution
An Investigation into the Use of Solar Power in Cloud Computing
737

for Compucycle is solution 3. This is a hybrid
solution, in the sense that only part of the power the
solution consumes comes from renewable energy
resources. This is more realistic for the business and
it’s what companies such as Amazon Web Services
and Google are implementing themselves.
It is important to note that as previously
mentioned in section 6.1 the price stated for the
Hyper Converged 250 is entry list price. The
configuration stated is most likely to be much
higher, thus driving the overall cost of solutions 1, 2
and 3 up significantly. Where as solution 4 will stay
at the same price over the 5 years.
Therefore, the most appropriate solutions at the
time of writing this paper are solution 3 being the
hybrid solar approach and solution 4 being the
complete cloud outsourcing approach.
REFERENCES
Dell, "About dell," Dell, 2016. [Online]. Available:
http://www.dell.com/learn/us/en/uscorp1/corp-comm.
Accessed: Mar. 16, 2016.
HP Inc, "HP® official site," 2016. [Online]. Available:
http://www8.hp.com/us/en/hp-information/index.html.
Accessed: Mar. 16, 2016.
Hewlett Packard Enterprise, "About Hewlett Packard
enterprise information and strategic vision," 2016.
[Online]. Available: https://www.hpe.com/uk/
en/about.html. Accessed: Mar. 16, 2016.
Lenovo, "For those who do," Lenovo, 2016. [Online].
Available: http://www.lenovo.com/lenovo/uk/en/
?footer-id=our_company. Accessed: Mar. 16, 2016.
Google, "Renewable energy – Google green,". [Online].
Available: https://www.google.co.uk/green/energy/.
Accessed: Feb. 26, 2016.
Amazon Web Services, "AWS & sustainability," Amazon
Web Services, 2014. [Online]. Available: https://
aws.amazon.com/about-aws/sustainability/. Accessed:
Feb. 26, 2016.
"Growth of Photovoltaics,". [Online]. Available:
https://en.wikipedia.org/wiki/Growth_of_photovoltaic
s. Accessed: Mar. 10, 2016.
International Energy Agency, "TRENDS 2015 IN
PHOTOVOLTAIC APPLICATIONS EXECUTIVE
SUMMARY," 2015. [Online]. Available:
http://www.iea-pvps.org/index.php?id=92&eID
=dam_frontend_push&docID=2797. Accessed: Mar.
6, 2016.
CLOSER 2017 - 7th International Conference on Cloud Computing and Services Science
738
