
Ubiquitous Environmental Monitoring as Decision Tool
MONITAR SENSE: An Environmental Tool
Paulo Pinho
1,3
, Sérgio Lopes
1,2,3
, Gabriel Rodrigues
3
and Pedro Colaço
3
1
CI&DETS, Center for Studies in Education, Technologies and Health, Polytechnic Institute of Viseu,
Campus Politécnico, 3504-510, Viseu, Portugal
2
ADAI/LAETA, Association for the Development of Industrial Aerodynamics, Coimbra University,
Rua Pedro Hispano, 12, 3030-289, Coimbra, Portugal
3
MONITAR, Lda, Repeses, Viseu, Portugal
Keywords: Environmental Monitoring, Web-based Platform, Ubiquitous Monitoring, Decision Tool.
Abstract: Ambient (outdoor) Environmental Quality (AEQ) of urban areas and Indoor Environmental Quality (IEQ)
of buildings are recognized as key factors that contribute to improve the position on ranking of smart cities.
The challenge is being able to evaluate AEQ and IEQ in large scale, and making the results available, in
real-time, so that decision makers can react according to the received information. Monitar started the
implementation of an AEQ and IEQ monitoring network based on new environmental sensors and
information and communication technologies (ICT), such as a web-based platform, in order to monitor
environmental parameters in a large area at a lower cost than conventional environmental monitoring
networks and to disseminate information to become available for decision. The data collected are the base
for decision support tool to be used by building and district managers and also individual people. In terms of
Smart City, in its component Smart Environment, the monitoring network uses different equipment that due
to their dimension and price can be placed in several locations. ICT supports Smart Governance and Smart
Living, also addressed by accessing information helping changing people’s behaviour. This paper describes
the Environmental Monitoring Network applied by Monitar (designated MONITAR SENSE) in Central
Portugal namely the mainframe and some results.
1 INTRODUCTION
A poor ambient environmental quality (AEQ) is a
current problem in urban areas. The continuous
exposure to noise has a significant impact on health
and well-being resulting, for example, in an
increased of cardiovascular disease risk caused by
the increase of hypertension and stress (e.g. WHO,
2001) and available data shows that 65% of the
Europeans living in urban areas are exposed to high
noise levels (Decision n. º 1386/2013/EU). Health
problems associated with exposure to air pollutants
are also an major concern, with particulates (mainly
small ones PM
2,5
and PM
10
), ozone (O
3
) and nitrogen
dioxide (NO
2
) (e.g. EEA, 2015), as main pollutants.
The lack of instantaneous data on environmental
parameters such as: air pollutants, noise,
temperature, relative humidity, ultraviolet radiation,
among others, is due to the fact that most of the
measurement techniques and web-based platforms
have not yet reached a threshold technological
development versus costs, that allow its global
spread.
In developed countries there are several
convencional AEQ monitoring networks and
databases that allow access to historical data,
however, usually, they do not measure important
environmental parameters such as noise, neither are
stable databases nor provide real time data.
European Union obliges member states to have a
network of air quality monitoring stations using
reference methods and equipment with very strict
technical specifications (Directive 2008/50/EC of
the European Parliament and of the Council of 21
May 2008 on ambient air quality and cleaner air for
Europe). These equipments are expensive, need to
be in a large conditioned compartment, with great
consumption of energy. This type of stations is not
expected to increase due to its high cost.
Information produced by this type of network
usually does not have the necessary interaction with
274
Pinho, P., Lopes, S., Rodrigues, G. and Colaço, P.
Ubiquitous Environmental Monitoring as Decision Tool - MONITAR SENSE: An Environmental Tool.
DOI: 10.5220/0006344002740280
In Proceedings of the 6th International Conference on Smart Cities and Green ICT Systems (SMARTGREENS 2017), pages 274-280
ISBN: 978-989-758-241-7
Copyright © 2017 by SCITEPRESS – Science and Technology Publications, Lda. All rights reserved

public due to several failures in data communication
process, nonfunctional communication platforms,
information not updated in real time and limited
spacial coverage. Same issues are verified in
meteorological stations.
In developed societies, most people spend about
90% of their time doing indoors activities and, in
most cases, exposed to poor indoor environmental
quality (IEQ) associated with health problems,
performance decrease and absenteeism (e.g.
Shendell et al., 2004; WHO, 2010; Mendell and
Heath, 2005; Madureira et al. 2009; Haverinen-
Shaughnessy et al., 2011 and Bakó-Biró et al.,
2012).
However, there is no ubiquitous monitoring of
indoor environmental parameters for public
administration buildings (schools, hospitals, public
departments, etc.) or private social services (nursing
homes, kindergartens, etc.), neither assessment of
workers exposure or building users.
In recent years there has been a substantial
development and/or improvement of technologies
for measuring environmental parameters. These
technologies allow the modular development with
several environmental sensors and communication
components with lower costs, less space required,
good temporal and spatial representativeness and
lower energy requirements than traditional
equipment. However, it is necessary to develop the
equipment and not only the sensor, also auxiliary
components and validation and calibration protocols
that will guarantee the quality of results (MacDonell
et al., 2013; sneider, et al., 2013; spinelle et al.,
2013; Jovašević-Stojanovića et al., 2015)
For temperature, relative humidity, ultraviolet
radiation, noise and CO
2
, low cost sensors have got
range and precision required, almost, for their
immediate application. For air quality parameters,
several recent studies show that low cost technology
is already available for reduced concentration ranges
and with some stability (e.g. Mead et al., 2013 and
Ikram et al., 2012; spinelle et al., 2015; spinelle et
al., 2017). For pollutants such as O
3
or NO
2
, the
electrochemical sensors allow determine its
concentration in the range observed in ambient air,
but there are also other aspects that compromise
their use, namely the operating conditions
(temperature and humidity) and electronic noise
which affects the output signal (Aleixandre et al.,
2014, Spinelle et al., 2015 and Spinelle et al., 2017).
Therefore, the main challenge for these sensors is to
improve its operation sensitivity, stability and
longevity (e.g. Kumar et al., 2015).
For measurement fine particles (PM
10
or PM
2,5
),
the low cost sensors are based on counting particles
as they interrupt a light beam. Particle concentration
is further determined by signal processing
(separating size intervals as function of beam
interruption time) and on a calculation algorithm that
considers particle density, counting efficiency
amongst other parameters. The device results
depends on the operating conditions and the
calculation algorithm used for converting particle
count to concentration (Gozzi et al., 2016, Johnson
et al., 2016 and Williams et al., 2014).
Several projects of ubiquitous environmental
monitoring are being developed (e.g. Hwang et al.,
2010; Ghobakhlou et al., 2011; Bagula et al., 2012;
Yun et al., 2012; Moltchanov et al., 2015) intending
to use current communication technologies and
equipment to support the decision making of
governmental entities, private entities and everyday
people’s behavior.
2 MONITAR SENSE: AN
ENVIRONMENTAL TOOL
Monitar has been developing an environmental
monitoring network associated to a web-based
platform MONITAR SENSE (sense.monitar.pt) as
frame for a decision tool.
In terms of Smart City, the components of Smart
Governance, Smart Environment and Smart Living,
are contemplated. The calculation of indexes based
on real-time data that summarize reality (in final
development, not implemented yet) will support
decision makers and therefore support a Smart
Governance. Smart Environment was achivied by
increasing temporal and spatial representativeness of
environmental data through the use of
communication technologies and equipment that due
to their dimension and price have been placed in
several locations. Smart Living is also addressed by
the dissemination of real-time data helping people
changing their behaviour in daily life and
contributing to improve their health.
In terms of Citizens' Observatories, MONITAR
SENSE is developing home monitoring equipment
that will enable citizens to contribute and participate
in environmental information sharing, influencing
the rest of the community, social priorities and
decision making.
In terms of IOT, MONITAR SENSE equipment
has real-time communication systems and web-
based platform that connects people to real-time
equipment data. Most of the environmental
Ubiquitous Environmental Monitoring as Decision Tool - MONITAR SENSE: An Environmental Tool
275
monitoring equipment operates on an "Off-Grid" or
"Stand-Alone" logic, collecting data over a long
period of time, which are then analysed in
backoffice, resulting in reports that reflect a past
episode. This time lapse between the monitored
episode and the data communication gives rise to an
ineffective, or even non-existent decision.
MONITAR SENSE platform, see Figure 2, is a
user friendly tool to interact with decision makers
and general public allowing visualization of
measured parameters in real time, perform historical
query, download editable files to data post-
processing and view equipment location in a map.
Also, enable to create private and public monitoring
networks, user management, equipment
management and network management.
At a final development stage, not yet
implemented, are the possibilities of: configure
alerts when exceeded a predetermined value of a
measured parameter, calculate in real time several
indexes that will be used to support decisions and
also statistical treatment and reports of measured
data and access to data through the application
programming interface (API).
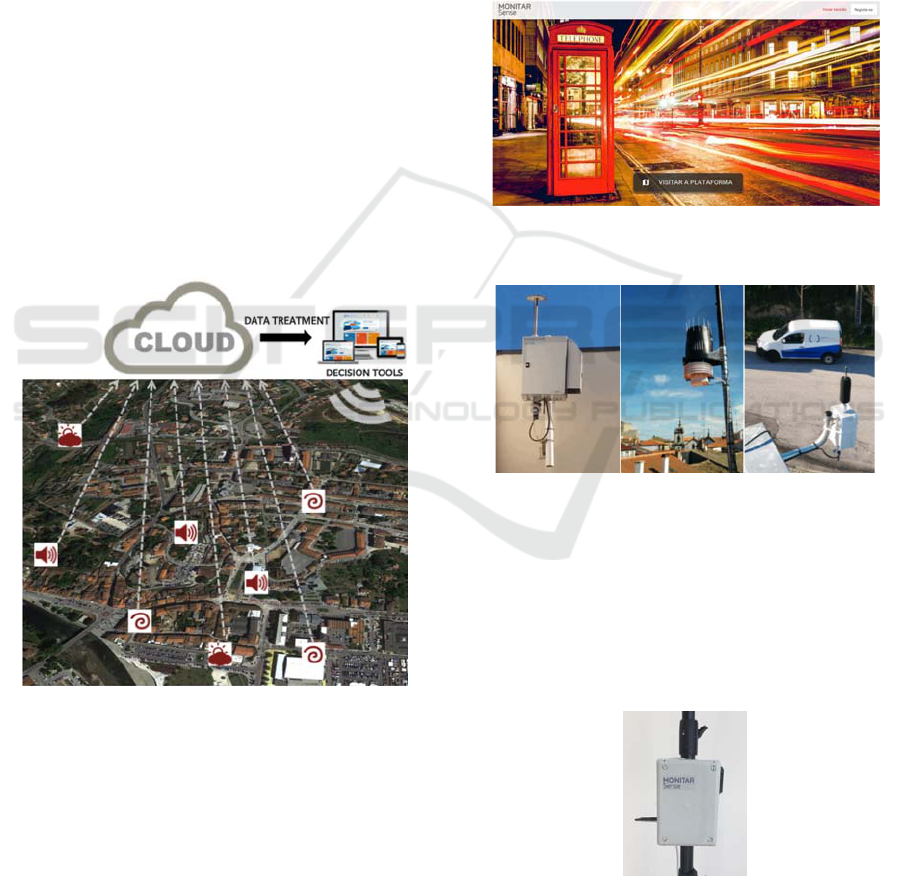
Figure 1: Environmental monitoring network and web-
based platform MONITAR SENSE concept.
The network is composed by equipament that
measure several environmental parameters.
Collected data are transmitted to backoffice to be
analysed and become available in a user-friendly
frontend.
Concerning ambient environmental quality, as
shows Figure 3, equipments that are being installed
by MONITAR are: SmartAIRSense for monitoring
ambient air quality, measuring parameters such as
ozone (O
3
) and nitrogen dioxide (NO
2
) (using
electrochemical sensors) and particle matter (PM
10
and/or PM
2,5
) (using a particule counter);
SmartNOISESense for monitoring noise levels
(using an microphone type 2); SmartMETEOSense
for monitoring meteorological parameters such as air
temperature and relative humidity (using capacitive
sensors); ultraviolet and total radiation (using
photodiode); wind speed and direction (using a vane
anemometer); atmospheric pressure (using a resistor
sensor) and rainfall intensity (using a rain collector).
Figure 2: Web-based platform MONITAR SENSE
(
sense.monitar.pt
).
Figure 3: SmartAIRSense, SmartMETEOSense and
SmartNOISESense.
Figure 4 shows equipment that are being developed
by MONITAR to evaluate indoor environmental
quality in schools and homes. SmartHOMESense
and SmartSCHOOLSense for monitoring parameters
such as CO
2
, O
x
(O
3
+NO
2
), PM
10
and/or PM
2,5
, air
temperature and relative humidity, illuminance and
noise.
Figure 4: SmartHOMESense or SmartSCHOOLSense.
The equipment uses an electrochemical sensor to
SMARTGREENS 2017 - 6th International Conference on Smart Cities and Green ICT Systems
276
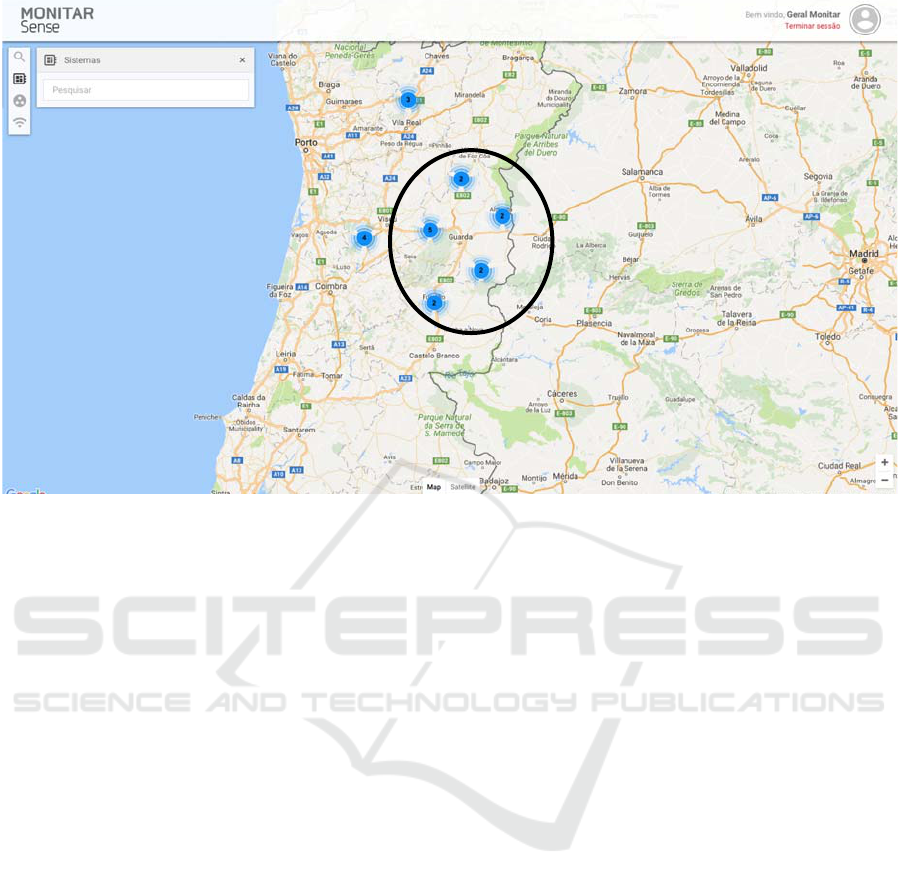
Figure 5: Display of web-based platform MONITAR SENSE (sense.monitar.pt) showing 13 MONITAR environmental
monitoring stations located in inland central Portugal.
O
x
measurement, a nondispersive infrared sensor for
CO
2
measure, microphone type 2 for noise
measurement, a particule counter for PM
10
and/or
PM
2,5
, capacitive sensors to measure temperature
and relative humidity and photodiode to measure
illuminance.
3 MONITAR SENSE
APPLICATION - AN
ENVIRONMENTAL
MONITORING NETWORK IN
CENTRAL PORTUGAL
MONITAR SENSE is being applied as a frame of an
environmental monitoring network located in central
Portugal.
The network has 13 locations. Each location has
a SmartAIRSense, a SmartNOISESense and a
SmartMETEOSense. Figure 5 presents the web-
based platform display MONITAR SENSE
(sense.monitar.pt), showing Monitar stations located
in central Portugal.
Since early network implementation, not every
station worked continuously due to internet
availability, stopping data communication, or
refrigeration fail in SmartAIRSense equipment
compromising liability of air quality data.
MONITAR SENSE platform displays
environmental parameters charts measured every 5
minutes, allowing selection of the visible data
period, see an example in Figure 6.
The obtained data from SmartNOISESense and
SmartMETEOSense are very reliable since sensors
are very stable and have good accuracy within a
large range of environmental conditions.
Air quality electrochemical sensors (O
3
and NO
2
)
are very sensible to temperature changes having less
accuracy if equipment is not temperature
conditioned. SmartAIRSense equipment has
conditioned temperature but in extreme
environmental conditions (when completely exposed
to sun during summer months, for example) cannot
always guarantee optimal temperature range.
Although this handicap obtained information can
still be very useful to decision makers.
In this location area (Inland Central Portugal) only
exists two conventional Air Quality Monitoring
Stations (AQMS) from the Environmental
Portuguese Agency Air Quality National Network
(Fornelo do Monte and Fundão, 75 km of distance
between them).
When ozone concentration are above 180 g/m
3
measured in these stations population should be
informed to avoid exposition to breathing air
containing ozone including people with asthma,
children, older adults, and people who are active
Ubiquitous Environmental Monitoring as Decision Tool - MONITAR SENSE: An Environmental Tool
277
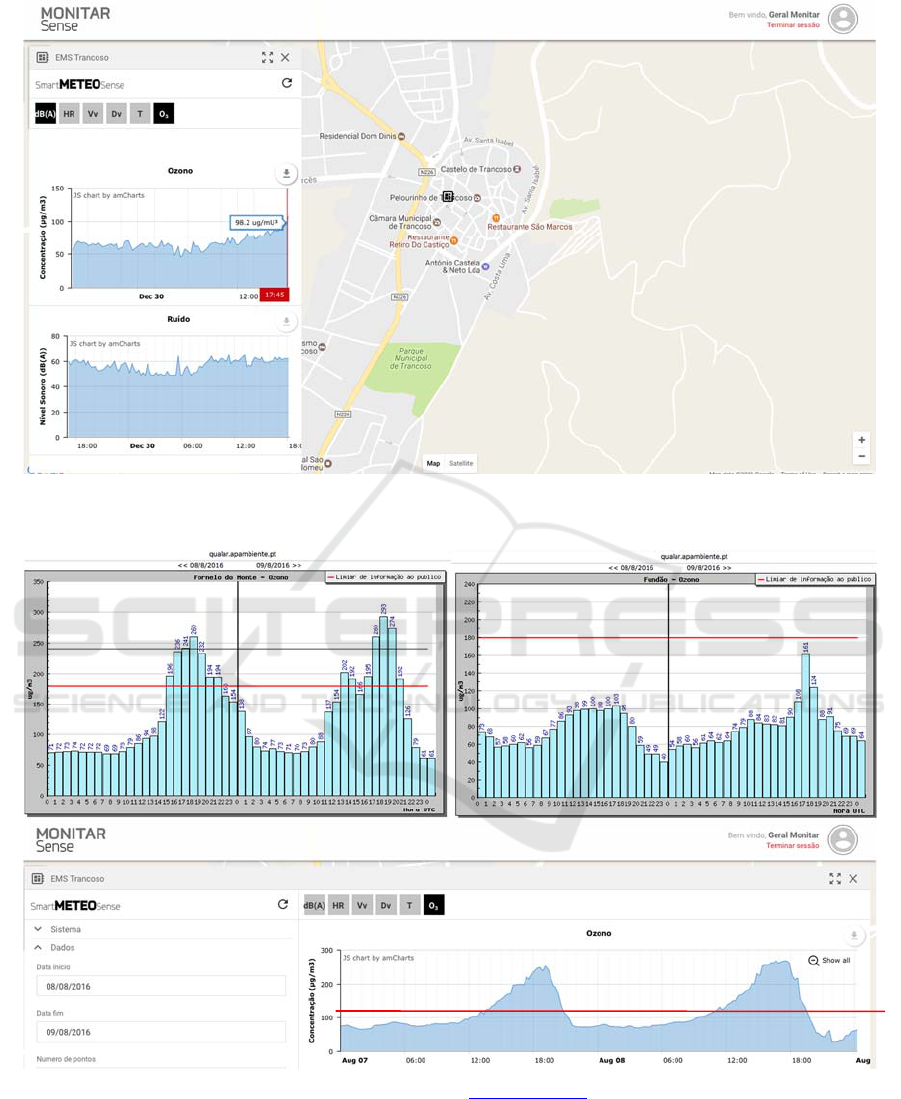
Figure 6: Display of web-based platform MONITAR SENSE showing ozone data and noise data from one of the
MONITAR stations.
Figure 7: Display of web-based platform MONITAR SENSE (sense.monitar.pt) and the chart obtained in Environmental
Portuguese Agency Air Quality Platform showing data from Air Quality Monitoring Station located in Central Portugal
concerning to in 8 and 9 of august of 2016.
outdoors. However, it is verified that the informative
channels are not working correctly and people are
not informed in real time, and usually know only
after the exposition occurred.
As it can be seen in Figure 7, on August 8 and 9,
2016, two ozone episodes occurred in Central
Portugal detected by the Fornelo do Monte station
(AQMS from Environmental Portuguese Agency)
SMARTGREENS 2017 - 6th International Conference on Smart Cities and Green ICT Systems
278

but not detected in the other Central Portugal
AQMA (Fundão). These episodes were also detected
in the MONITAR SENSE station located
approximately in the middle location between these
two stations. Information from MONITAR SENSE
station, even less accurate, can be very useful for
decision makers that after receiving alert can
confirm the values in the National Network and act
in real time.
4 CONCLUSIONS
Ubiquitous environmental monitoring starts being a
reality since the technology become available and
affordable. However, for some parameters like air
quality pollutants (O
3
, NO
2
, PM
10
and PM
2,5
) the
technology is not available in a ready-to-use way,
needing to be tested and calibrated before use.
Also, some steps need to be done before this
ubiquitous environmental monitoring starts being a
decision tool.
MONITAR SENSE is already a real
environmental tool although it needs some
improvements.
ACKNOWLEDGEMENTS
The authors acknowledge the support from the
Polytechnic Institute of Viseu, namely the
CI&DETS – Center for Studies in Education,
Technologies and Health (Project I&D
CI&DETS/IPV/CGD), from ADAI/LAETA -
Association for the Development of Industrial
Aerodynamics and from Monitar, LDA and
Associação de Munícipios da Cova da Beira.
REFERENCES
Aleixandre M., Matatagui D., Santos J. P., Horrillo M.
C., 2014. Cascade of Artificial Neural Network
committees for the calibration of small gas
commercial sensors for NO
2
, NH
3
and CO. IEEE
SENSORS 2014 Proceedings.
Bagula, A., Zennaro, M., Inggs, G., Scott, S., & Gascon,
D. 2012. Ubiquitous Sensor Networking for
Development (USN4D): An Application to Pollution
Monitoring.Sensors(Basel,Switzerland),12(1),391–14.
Bakó-Biró Z, Clements-Croome D.J., Kochhar N., Awbi
H.B., Williams M.J., 2012. Ventilation rates in
schools and pupils performance. Building and
Environment 48:215-23.
Decisão n. º 1386/2013/UE do Parlamento Europeu e do
Conselho de 20 de novembro de 2013 relativa a um
programa geral de ação da União para 2020 em
matéria de ambiente “Viver bem, dentro dos limites do
nosso planeta”.
EEA (European Environment Agency), 2015. Air quality
in Europe. Report. EEA Report n. º 5/2015.
Ghobakhlou A., Zandi S., Sallis P., 2011. Development of
Environmental Monitoring System with Wireless
Sensor Networks. 19th International Congress on
Modelling and Simulation, Perth, Australia.
Gozzi, F., Ventura, D.G., Marcelli, A., 2016. Mobile
monitoring of particulate matter: State of art and
perspectives. Atm. Pollution Research 7, 228-234.
Haverinen-Shaughnessy U., Moschandreas D.J.,
Shaughnessy R.J., 2011. Association between
substandard classroom ventilation rates and students
academic achievement. Indoor Air, 21:121-31.
Hwang, J., Shin, C., Yoe, H., 2010. Study on an
Agricultural Environment Monitoring Server System
using Wireless Sensor Networks. Sensors, 10(12),
11189–11211.
Ikram J., Tahir A., Kazmi H., Khan Z., Javed R., Masood
U., 2012. View: implementing low cost air quality
monitoring solution for urban areas. Environmental
Systems Research, 1:10.
Johnson, K.K., Bergin, H.M., Russell, G.A., Hagler,
W.S.G., 2016. Using Low Cost Sensors to Measure
Ambient Particulate Matter Concentrations and On-
Road Emissions Factors. Atmospheric Measurement
Techniques, amt-2015-331.
Jovašević-Stojanovića, M., Bartonovab, A., Topalovićc,
D., Lazovića, I., Pokrićd, B., Ristovskie, Z., 2015. On
the use of small and cheaper sensors and devices for
indicative citizen-based monitoring of respirable
particulate matter. Envir. Pollution, V. 206, 696–704.
Kumar P., Morawska L., Martani C., Biskos G.,
Neophytou M., Sabatino S. D., Bell M., Norford,
Britter L.R., 2015. The rise of low-cost sensing for
managing air pollution in cities. Environment
International, Volume 75, 199-205.
Madureira J., Alvim-Ferraz M., Rodrigues S., Gonçalves
C., Azevedo M.C., Pinto E., Mayan O., 2009. Indoor
Air Quality in Schools and Health Symptoms among
Portuguese Teachers. Human and Ecological Risk
Assessment: An Int. Journal, 15:159-69.
MacDonell M., Raymond M., Wyker D., Finster M.,
Chang Y., Raymond T., Temple B., Scofield M., 2013.
Research and Development Highlights: Mobile
Sensors and Applications for Air Pollutants. Argonne
National Laboratory Environmental Science Division
(EVS) Argonne, IL, EPA/600/R-14/051.
Mead M.I., et al., 2013. The use of electrochemical
sensors for monitoring urban air quality in low-cost,
high-density networks. Atmospheric Environment,
Volume 70, 186–203.
Mendell M.J., Heath G.A., 2005. Do indoor pollutants and
thermal conditions in schools influence student
performance? A critical review of the literature.
Indoor Air, 15:27-52.
Ubiquitous Environmental Monitoring as Decision Tool - MONITAR SENSE: An Environmental Tool
279

Shendell D.G., Prill R., Fisk W.J., Apte M.G., Blake D.,
Faulkner D., 2004. Associations between classroom
CO
2
concentrations and student attendance in
Washington and Idaho. Indoor Air, 14:333-41.
Snyder, E., P. Solomon, M. MacDonell, R. Williams, E.
Thoma, D. Vallano, M. Raymond, AND D. Olson.
Next generation air monitoring-a review of portable
air pollution sensors. Presented at 2013 32nd annual
AAAR, Portland, OR, September 30, 2013.
Spinelle L., Aleixandre M., Gerboles M., 2013, Protocol
of evaluation and calibration of low-cost gas sensors
for the monitoring of air pollution, EUR 26112.
Spinelle L., Gerboles M., Villani M. G., Aleixandre M.,
Bonavitacola F., 2017. Field calibration of a cluster of
low-cost commercially available sensors for air
quality monitoring. Part B: NO, CO and CO
2
. Sensors
and Actuators B: Chemical, Vol. 238, Pages 706-715.
Spinelle L., Gerboles M., Villani M. G., Aleixandre M.,
Bonavitacola F., 2015. Field calibration of a cluster of
low-cost available sensors for air quality monitoring.
Part A: Ozone and nitrogen dioxide. Sensors and
Actuators B: Chemical, Volume 215, Pages 249-257.
WHO (World Health Organization), 2010. WHO
Guidelines for Indoor Air Quality: Selected Pollutants.
WHO Regional Office for Europe.
WHO (World Health Organization), 2001. Occupational
and community noise. Fact sheet N.258. Feb. 2001.
Williams, R., Kaufman, A., Hanley, T., Rice, J., Garvey,
S., 2014. Evaluation of Field-deployed Low Cost PM
Sensors. United States Environmental Protection
Agency. EPA/600/R-14/464.
Yun, J. , Baek, J. , Kang, B. , Park, P. 2012. 'Development
of Workplace Environmental Monitoring Systems
Using Ubiquitous Sensor Network'. World Academy
of Science, Engineering and Technology, International
Science Index 70, International Journal of Mechanical,
Aerospace, Industrial, Mechatronic and Manufacturing
Engineering, 6(10), 2210 - 2214.
Moltchanov S., Levy I., Etzion Y., Lerner U., Broday
D.M., Fishbain B., 2015. On the feasibility of
measuring air pollution at dense urban areas by
wireless distributed sensor networks. Science of the
Total Environment. 502:537–547.
SMARTGREENS 2017 - 6th International Conference on Smart Cities and Green ICT Systems
280
