
DOTSIM
A Simulation-based Optimization Methodology for the Optimal Duplication
Sequence on Freight Transportation Systems
Heygon Araujo and Samyr Vale
Department of Computer Science, Federal University of Maranh
˜
ao - UFMA, Sao Lu
´
ıs, Maranh
˜
ao, Brazil
Keywords:
Optimization, Transportation Systems, Methodology, Simulation, Railways.
Abstract:
The definition of the best sequence on route duplication of freight systems consists on a complex NP-hard
problem. There exists a huge variety of meta-heuristics (MH) capable of generating satisfactory solutions.
However, it is fastidious to know which MH will produce the best solution for a Duplication Sequencing
Problem (DSP). There not exists a methodology to structure, plan and control algorithms and processes in
modeling the various MH applied to find the best solution in this type of problems. This paper proposes
a process development methodology which guides to evaluate the best duplication sequence comparing the
MH’s performance with existing approaches such as linear analytical method (LAM). The potential of this
methodology is demonstrated by a case study in railway systems.
1 INTRODUCTION
Rail transportation is one of the most efficient trans-
portation ways due to its capacities to freight and pas-
sengers at low costs comparing with road transporta-
tion. The growth of its support infrastructure is com-
plex as much as its importance.
The duplication sequence problem (DSP) is des-
cribed as a set of single segments or routes in a trans-
portation system, the link between these routes (usu-
ally duplicated where vehicles can park) called cros-
sing loops, and the travel cost between the connected
crossing loops. The best solution for a DSP is the se-
quence which has lower cost, besides that all routes
should be duplicated one at a time. For most of DSP
problems the search for the best solution is relevantly
hard. A problem with 10 single routes has about 3.5
x 10
6
feasible solutions. An exhaustive search runned
by a computer with capacity to process 1 billion solu-
tions per second would find the best solution in about
four years.
For this kind of problem, a satisfactory solution,
close to an optimal one, may be obtained by meta-
heuristics (MHs). MHs are optimization methods ba-
sed in robust strategies to avoid optimal local soluti-
ons (Gendreau and Potvin, 2010). Different MHs pro-
vide satisfactory solutions for different instances from
PSD, however, how to select the most promising for
an specific DSP? It involves a typical selection pro-
blem algorithm (Rice, 1976). According to the theo-
rem ”No free Lunch” (Wolpert and Macready, 1997)
always selecting the same algorithm does not produce
satisfactory results. On the other hand, by processing
all available algorithms for the desired instance and
after select the best solution would be relevantly ex-
pensive. A computational methodology could provide
a comprehensive framework for MHs management in-
cluding to plan, run, schedule, control and analyse
different algorithms and results on the duplication se-
quence problems. To the best of our knowledge, there
is no methodology available which describes how to
conduct a feasibility way to find the best solution in
DSP problems. This paper proposes a methodology
based on simulation and optimization techniques to
identify satisfactory solutions for a determined DSP
problem, comparing the performance between diffe-
rent MHs in order to find which is the more promising
over different instances. The remaining of this paper
is organized as follows: section 2 describes the DSP
problem. Section 3, presents a brief literature review
of Railway Capacity Concepts, Simulation and Opti-
mization approaches in transportation systems. Three
varieties of algorithms are discussed based on the se-
arching space model. Section 4 presents and explains
the methodology; in section 5, a mathematical mo-
deling is depicted; a case study based in railway sys-
tems is reported in section 6. Section 7 gives conclu-
sions and final remarks.
Araujo, H. and Vale, S.
DOTSIM - A Simulation-based Optimization Methodology for the Optimal Duplication Sequence on Freight Transportation Systems.
DOI: 10.5220/0006337404590466
In Proceedings of the 19th International Conference on Enterprise Information Systems (ICEIS 2017) - Volume 2, pages 459-466
ISBN: 978-989-758-248-6
Copyright © 2017 by SCITEPRESS – Science and Technology Publications, Lda. All rights reserved
459
2 DUPLICATION SEQUENCE
PROBLEM IN
TRANSPORTATION
SYSTEMS - DSP
For most of the DSP problems the exhaustive search
for the best solution requires complex modeling and
hard computational efforts. A problem with 10 sin-
gle routes has about 3.5 x 10
6
viable solutions. An
exhaustive search processed by a computer with ca-
pacity to process 1 billion solutions per second would
find the best one in about four years. Certainly,
an analyst will not spend all this time to define the
best duplication sequence for a transportation system
which needs investments in its infrastructure.
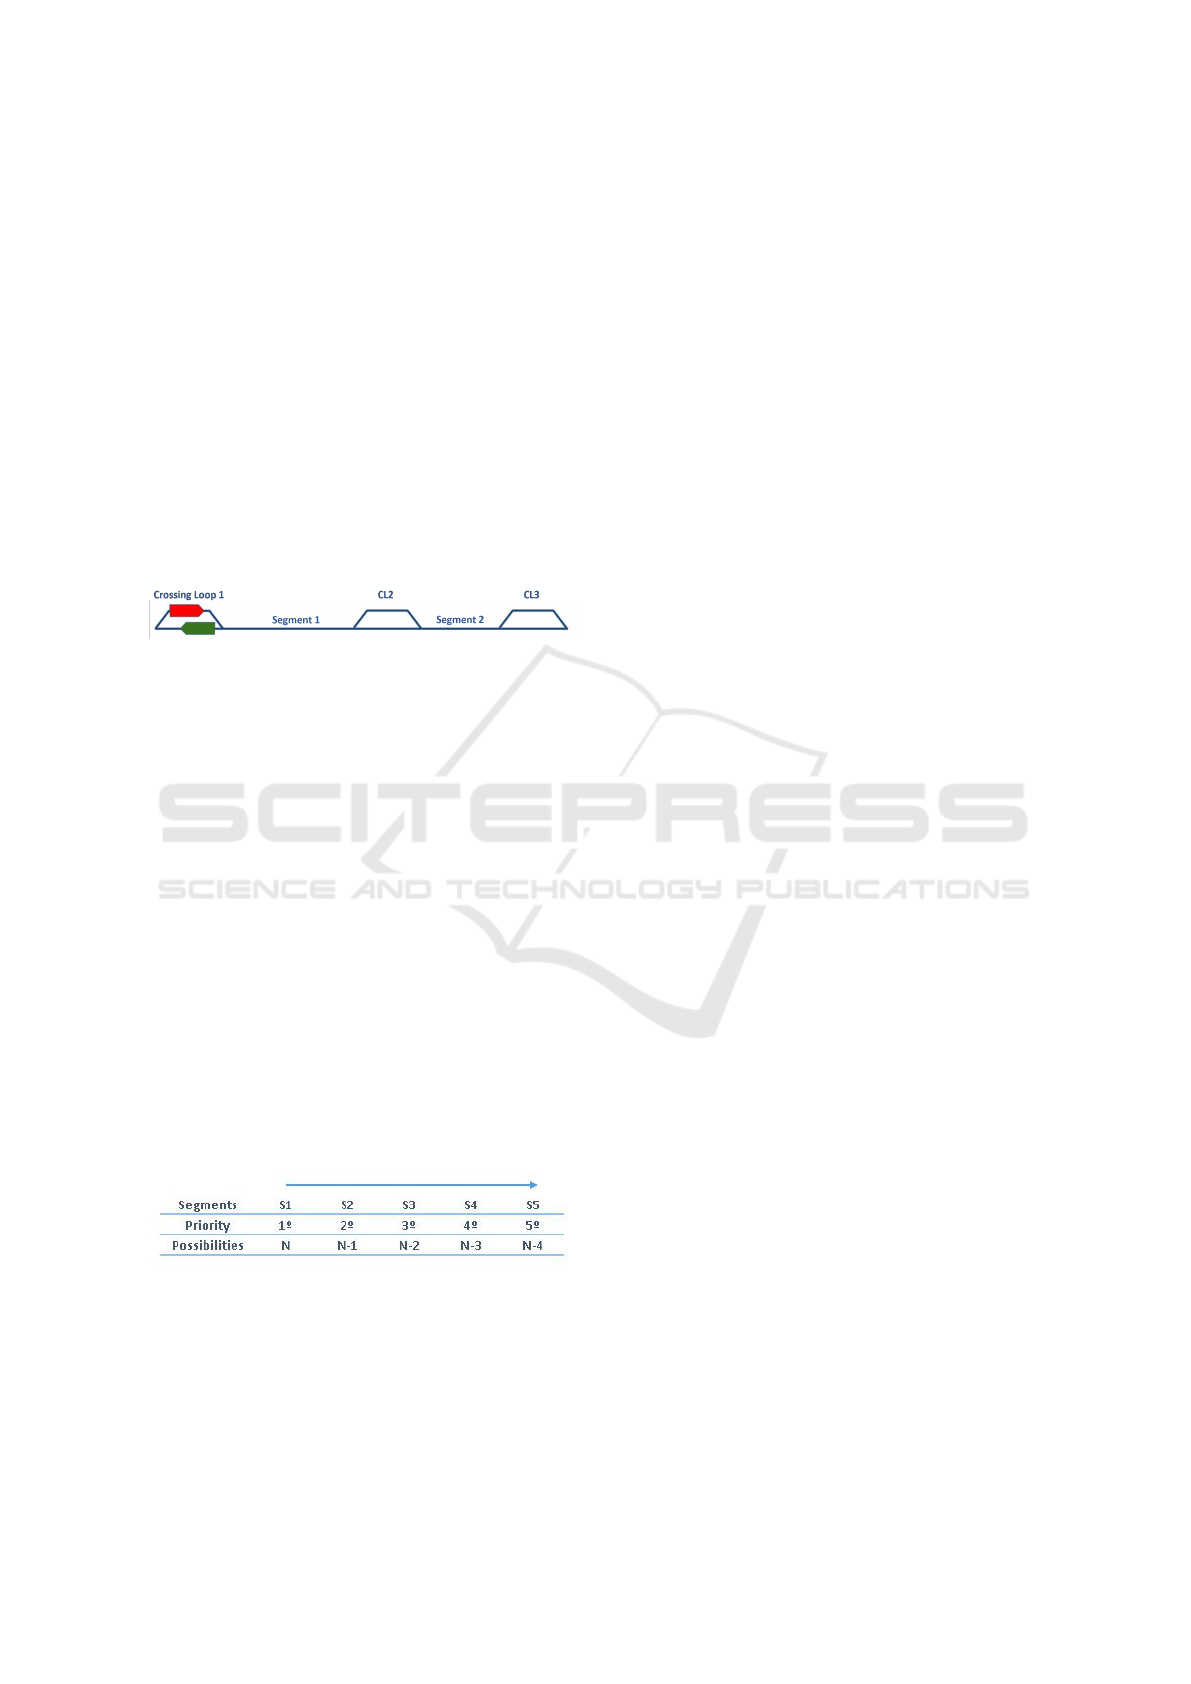
Figure 1: A Rail Transportation System with two single seg-
ments and three crossing loops.
DSP basically consists on defining the best pri-
ority duplication sequence in transportation systems
that still have single routes or segments (as depicted
in figure 1) and that is experiencing a need to incre-
ase its transportation capacity to support an increase
in demand. Moreover, in DSP all single routes should
be duplicated and the priority of each route must be
defined. The complexity of a DSP increases exponen-
tially according to the amount of singles segments as
showed in figure 2.
We can also observe in figure 2 an example of pri-
ority for a system with N=5 single segments. The
priority defined is shown by the arrow, in other words,
the ”S1” is going to be the first segment duplicated,
and the last will be the ”S5”. In additional, for each
route selected to duplicate, there are N-1 more possi-
bilities. That is the reason for DSP become a permuta-
tion problem. For system with 5 segments, we would
have a search space with 5! or 120 viable solutions.
Figure 2: Feasible Solutions for a railway with 5 singles
segments/routes.
Each segment has a cost which can be represen-
ted by a variety of variables which depend on the ob-
jective of the transport route analyst, e.g, investment
costs, capacity costs, or the average between them,
etc.
There are a variety of applications in the real
world that are modeled through the DSP, such as
freight and passenger in onshore transportation sy-
stems, e.g. railways, LRVs (Light Rail Vehicles),
highways, roads, subway etc.
3 RAILWAY CAPACITY
CONCEPTS
3.1 Simulation
(Pegden et al., 1995) presents a more complete de-
finition, covering the entire simulation process. He
mentions that ”simulation is the process of designing
a computer model of a real system and conducting
experiments with this model in order to understand
their behavior and/or evaluate strategies for their ope-
ration.” As noted, the mentioned author considers that
simulation as a larger process, including not only the
construction of the template, but also all the following
experimental method, searching excessively: (i) To
describe the system behaviour, (ii) To build theories
and hypotheses considering the observations made,
(iii) To provide a base model for future behaviour pre-
dictions, that means, the effects produced by changes
in the system or employed in methods over its opera-
tion.
There are a variety of simulation software which
can measure the cost for feasible solutions to DSP
problems such as GPSS, JSL, Arena, ProModel, Si-
mul8 and FlexSim among more than sixty commer-
cial simulators.
In this research, a framework and open source
software called the Java Simulation Library (JSL) is
used as a simulation environment. The JSL has been
used in a number of researches and educational set-
tings; however, its implementation has not been fully
described in the literature except through its many ap-
plications (Rossetti, 2008).
This paper uses a simulation model as an objective
function in the search for optimal solutions. The key
indicator defined by the analyst is collected in the si-
mulation model which should be maximized or mini-
mized. Detailed information about the infrastructure
(e.g. rail segments capacities, disturbances, preven-
tive maintenance, number of trains, headway, etc) are
necessaries to specify the input data for the simulation
model.
ICEIS 2017 - 19th International Conference on Enterprise Information Systems
460

3.2 Optimization Approach
Simulation-Optimization and its applications in
railways: Simulation-based optimization stands for
a programming problem (usually a stochastic one)
whose objective function is evaluated by means of an
experimental simulation. Due to the complexity and
the stochasticity considered within the simulation, the
objective function is (i) usually subject to several le-
vels of random noise, (ii) not necessarily differenti-
able, and (iii) expensive to evaluate from the com-
putational standpoint. It is intuitive that simulation
optimization problems can be intractable if the op-
timization problem has a large number of variables
and/or the simulation involves many parameters and
many interactions to be described. The mathemati-
cal formalization and the computational complexity
of optimizing via simulation is clearly described in
(Fu, 1994; Fu, 2002).
In the field of railway systems, simulation-based
optimization has been used to face different problems
regarding the design of both train operations and in-
frastructure. A method for robust timetabling is intro-
duced by (Kroon et al., 2008) which adopts a stochas-
tic optimization model to allocate time supplements
and buffer times in a timetable in order to make it ro-
bust against stochastic disturbances during real ope-
rations.
It is important to emphasize that this work treats
the duplication railway sequence as a classic problem
of permutation considering as an NP-hard problem in
combinatorial optimization. (Kang et al., 2014) men-
tions that the MHs more used to similar permutation
problems, such as the Travelling Salesman Problem
(TSP) are: Tabu-Search (TS), Greedy Randomized
Adaptive Search Procedure (GRASP), Simulated An-
nealing (SA), genetic Algorithm (GA), and Colony
Optimization Algorithm (COA).
3.3 Optimization Approach for DSP in
Railways
In this paper, three approaches were explored:
Genetic Algorithm: Genetic techniques were cho-
sen because of their suitability in optimizing non-
polynomial (NP) complete problems. GAs have alre-
ady been used for symbolic layout, (Fourman, 1985),
and work scheduling (Davis, 1985).
Chromosomes were constructed in which each
gene represents the segment to be duplicated in chro-
nological order. Connected with each chromosome
is a fitness represented by the amount of discharged
trains which is collected from the simulation model.
The method use a population of chromosomes, each
chromosome is tested and a fitness is evaluated. A
new population of chromosomes is bred from the cur-
rent population, with the parents chosen on a fitness
basis.
Each generation was evaluated in the following
manner: it is created an initial population which is
randomly generated with one hundred duplication rail
sequences. Then each member of the population is
then evaluated and a fitness for that individual is si-
mulated.
In the selection stage the current population is im-
proved discarding the bad designs and only keep the
best individuals in the population. The basic idea was
fitter individuals were selected for next generations.
During crossover new individuals or duplication se-
quences were created by combining aspects of our
selected individuals. This ’combining aspects’ is to
cross two individuals and create two new sons who
combine part of the chromosome from their parents.
The goal is that this aspect combination between indi-
viduals create an even ’fitter’ offspring which will in-
herit the best traits from each of their parents. To add
a little bit randomness into our population’s genetics
it was implemented a mutation state which typically
random swaps were done to individuals genome. Now
we provide our next generation and we can start again
until a termination condition.
Tabu-Search: The tabu search (TS) is a determi-
nistic metaheuristic based on local search (Glover,
1986), which makes extensive use of memory for gui-
ding the search. Basic elements of a tabu search are
the concepts of move and tabu list, which restrict the
set of solutions to explore. From the incumbent solu-
tion, non-tabu moves define a set of solutions, called
the neighborhood of the incumbent solution. At each
step, the best solution in this set is chosen as the new
incumbent solution. Then, some attributes of the for-
mer incumbent are stored in a tabu list (TL), used by
the algorithm to avoid being trapped in local optima
and to avoid re-visiting the same solution. The moves
in the tabu list are forbidden as long as these are in
the list, unless an aspiration criterion is satisfied. The
tabu list length can remain constant or be dynamically
modified during the search.
Simulated Annealing: SA has been adopted wi-
dely to solve engineering problems,e.g., trains plat-
form problem (Kang et al., 2014), transit network op-
timization problem (Zhao and Zeng, 2006), and bott-
leneck routing problem at railway stations (Wu et al.,
2012), etc. The SA starts from an initial solution at
a high temperature, and makes a number of changes
DOTSIM - A Simulation-based Optimization Methodology for the Optimal Duplication Sequence on Freight Transportation Systems
461
according to annealing schedules. For any two itera-
tions, there are two objective values marked as few
and fold, and the difference between the objective va-
lues (∆f - fnew - fold) is calculated.If ∆f¡= 0, then
the new solution is accepted with probability ρ-1. Ot-
herwise, it is accepted with a small probability ρm,
ρ-exp(-∆f/T), where T is the current annealing tem-
perature (Kang et al., 2014). As the cooling proceeds
to the set frozen point, the algorithm terminates.
4 DOTSIM METHODOLOGY
In this paper, we propose the DOTSIM methodology
to aid finding solutions with high quality in dupli-
cation sequencing problem in complex transportation
systems. Our methodology has the following charac-
teristics:
(i) We assume that the methodology can be ap-
plied for any onshore freight and passengers trans-
portation system such as: railways, LRVs (Light Rail
Vehicles), highways, roads, public transportation (e.g.
subway), etc, that is experiencing a need to increase
its capacity of transport so as to support an increase
in demand.
(ii) The objective function is strictly a simulation
model inside a optimization loop.
(iii) Our methodology is meant for both resear-
chers and practitioners and those users having a ba-
sic knowledge of simulation and optimization techni-
ques.
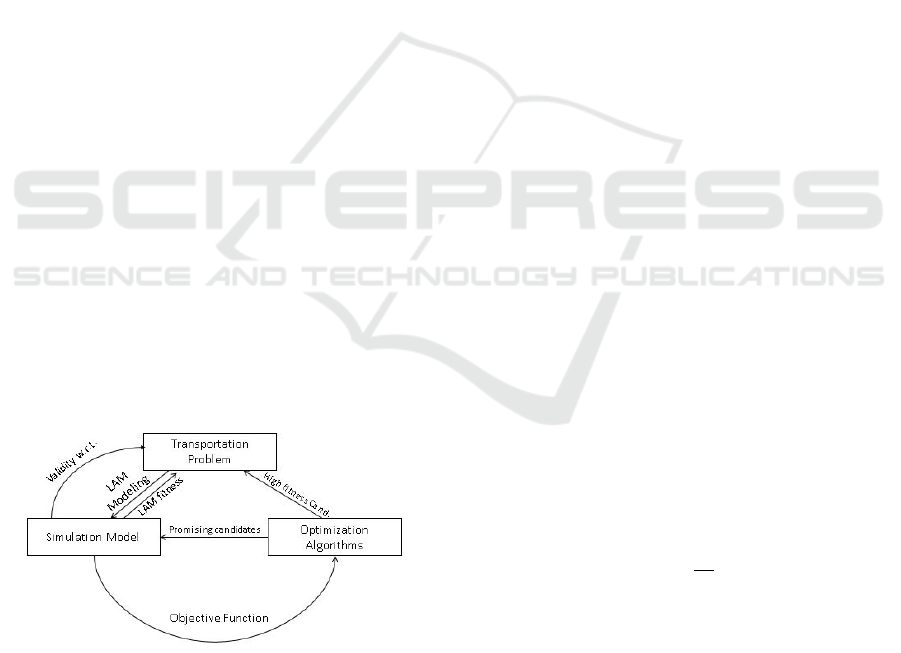
We distinguish the relationships among simula-
tion model, definition of the problem, optimization
techniques and linear analytical method (LAM) in fi-
gure 3.
Figure 3: Simulation model, definition of the problem, op-
timization techniques and LAM.
A transportation problem is a transportation sy-
stem (real or proposed) that can be modeled. A simu-
lation model is a casual model of infrastructure of the
transportation system; this model may have determi-
nistic or stochastic variables as inputs. It tests dupli-
cation sequence candidates coming from the optimi-
zation algorithms and the own transportation system
through the LAM and works as an objective function.
The optimization algorithms are the MHs which will
choose promising candidates to the simulation mo-
del and receive feedbacks with the candidate’s fitness.
Candidates with high quality fitness are ranked by the
MHs and compared with a LAM with is measured
by the Simulation Model. Validation is a key part of
the methodology because it confirms that the model
works in accordance with the analyst’s objective. Fi-
gure 3 shows that validation of a simulation model re-
lates to the transportation system, where w.r.t. stands
for ’with respect to’ (for validation of simulation mo-
dels see (de Freitas Filho, 2001)).
5 MATHEMATICAL MODELING
A railroad train analyses the capacity of the railway
line by measuring the practical and theoretical capa-
city of the rail network. The theoretical capacity is
considered as the maximum limit to the number of
trains that can simultaneously navigate a particular
stretch, also known as a theoretical maximum capa-
city.
The theoretical maximum capacity is characteri-
zed by the temporal spacing between trains, which
depends on the commercial speed of each train, travel
times and resources offered by signaling and existing
licensing systems.
In the case of simple line, the interval between
trains is proportional to the distance between consecu-
tive intersection of deviations away from the one that
can be counted among axes of stations, or between a
starting signal consecutive patios (when there is ap-
propriate signaling system, or when you can compute
the blocking times of simple line).
The maximum theoretical capacity can be equated
by the following mathematical expression:
C =
24
T
(1)
The C means capacity in number of trains/day and
the T means Travel time between shifts , round trip
(”headway”).
The value of the capacity is inversely proportional
to the travel times between shifts (equation 1). The
lower capacity snippets generate critical sections or
bottlenecks that determine the flow capacity of the en-
tire line.
Traffic or flow capacity of a rail section is defi-
ned by the number of trains which may move within a
ICEIS 2017 - 19th International Conference on Enterprise Information Systems
462

given time interval (BRINA, 1982). The author indi-
cates two possibilities of calculation , one through the
actual graphic movement of trains and analytically by
Colson method , according to equation 2.
For this method, (BRINA, 1982) indicates the
need to use a factor that differentiates the rail accor-
ding to its efficiency, ranging from 60% to 80%, ter-
med ”K” factor. Addition of (BRINA, 1982), (Kraft,
1982) mentions that this K factor can vary between
60% and 75%. (Krueger et al., 2000) quoted in (Bar-
ros, 2013), cites that this parameter, the value of the
factor K, is the capacity that can be permanently pro-
vided under normal operating conditions and is ap-
proximately 2/3 of the theoretical capacity.
However , (Krueger et al., 2000) quoted in (Bar-
ros, 2013), uses three different definitions to classify
the types of capacity in evaluating the performance of
a railway system, unlike Brina, as follows: theoretical
capacity, practical and used.
The theoretical capacity is defined by (Krueger
et al., 2000) cited (Barros, 2013) as the number of
trains that travel on a route in a given set period of
time, under ideal conditions, characterized by a vir-
tual scenario in which the trains have movement con-
stant with minimum headway between them. This
parameter expresses the maximum traffic capacity,
whereas the movement of the trains is homogeneous
throughout the day, they are spaced evenly and no in-
terruptions in the system. To be a value obtained by
empirical formula and does not consider the effects
of traffic variation and operations is impossible to be
practiced in real conditions.
The practical capacity is the number of boundary
units that can move on the railway line with a certain
level of reliability. A factor reflecting the conditions
of circulation of different types of trains with distinct
priorities, according to the accumulated traffic and ot-
her system conditions, it is a more realistic measure
of capacity. How is the specific combination of in-
frastructure, traffic and operations to move the maxi-
mum amount of products with a level of service and
predetermined reliability is the most significant media
capacity of the rail system. (Krueger et al., 2000)
The following mathematical formula that expres-
ses the above definition:
C = k ∗
24 − T m
T s + T d
(2)
In this case the Tm means time allowed for the
maintenance of permanent way, Ts rise time or loa-
ding transit, Td fall time or unloading transit and K a
operational efficiency factor.
Table 1: SUBSCRIPTS AND PARAMETERS.
Symbol Definition
C Traffic of flow capacity of a rail section
Tm Time allowed for the maintenance of
permanent way
Ts Rise time or loading transit
Td Fall time or unloading transit
K Operational efficiency factor
6 CASE STUDY: DEFINING BEST
DUPLICATION SEQUENCE OF
SINGLE-TRACK RAILWAYS IN
ORDER TO INCREASE
CAPACITY OF
TRANSPORTATION
Companies have used LAMs to obtain optimal solu-
tions for railways duplication strategy. In this met-
hod, the single-track segments that are prioritized in
an ’optimal’ sequencing. That sequence is the one
which has the lowest ratio between practical capacity
(trains/day) and demand (also trains/day). In the case
shown in table 2 there is a clear imbalance in the ca-
pacities of segments (column 2), which in practice is
very common to happen because different altimetry
profiles pathway, communities near the railway, brid-
ges, viaducts etc.
Table 2: Practical Capacity versus Segment’s Demand
(trains/day).
Segment Practical
Capacity
Demand Balance
0-1 10.0 3.0 7
1-2 12.0 8.5 3.5
2-3 5.0 2.0 3
3-4 20.0 5.0 15
4-5 8.0 4.0 4
Given the results of table 3, the best strategy for
doubling this railway would be:
For the above example with 5 single-track seg-
ments, it is possible to evaluate a combination of 5!
different layouts or 120 possibilities. This complex-
ity tends to increase in railways with large distances.
For example, for a railway with 10 segments is pos-
sible to evaluate a combination of almost four million
different duplication sequences.
It is common practice in companies find difficulty
to duplicate a lot of single-track segments in a short
DOTSIM - A Simulation-based Optimization Methodology for the Optimal Duplication Sequence on Freight Transportation Systems
463
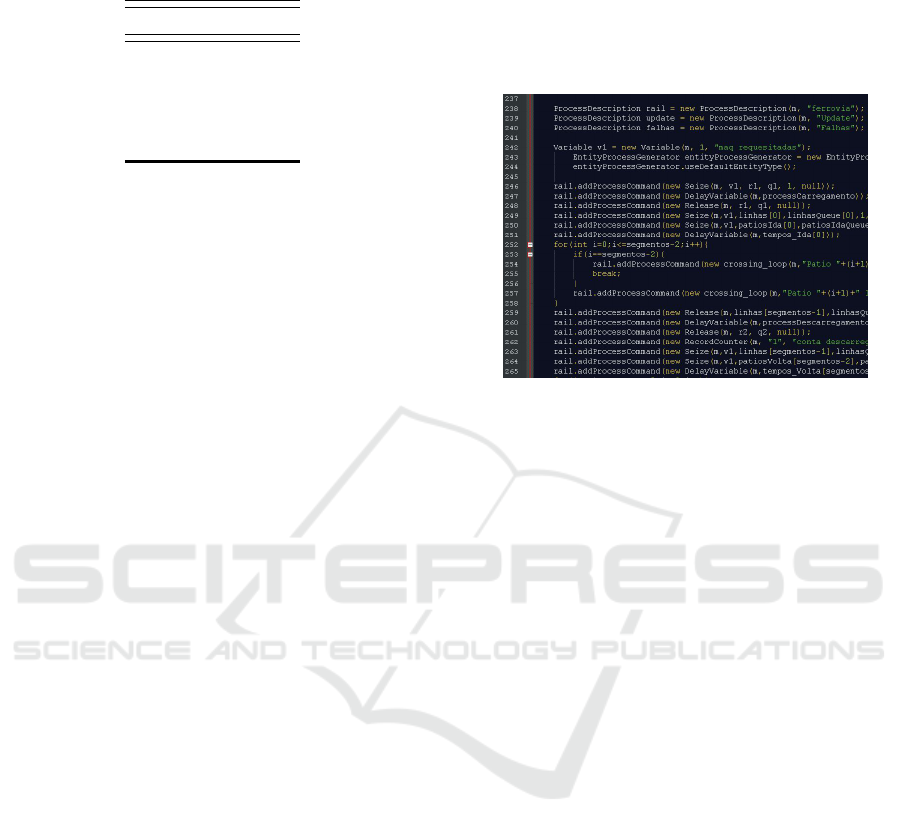
Table 3: Optimal Duplication Sequence by analytical met-
hod.
Segment Priority
0-1 4
1-2 2
2-3 1
3-4 5
4-5 3
space of time, as this often conflicts with hand limi-
tations of skilled labor, large equipment etc. Also the
investments are very aggressive with values that fluc-
tuate between 1.5 and 3.5 million dollars per kilome-
ter of railway line built.
In an attempt to avoid processing a problem with
this level of complexity with linear analytical met-
hods, the DOTSIM is applied in order to identify the
optimal solution to increase the capacity of a single-
track railway.
6.1 Modeling the Problem in JSL
In this paper an ”own-built” model has been used to
have a flexible simulation environment that can be
effectively interfaced with mathematical tool-boxes
for white-box optimization, this means to be flexible
enough to implement optimization algorithms and to
be adapted to the own needs of the user.
The framework used to model the railway is the
JSL. For introduction of modeling a passing loop of
JSL, was adopted a generic, hypothetical example.
Entities (trains) coming into the system and make the
discharge point of control or join a queue if it is busy.
In this problem we have to study a system which
transports a product from the loading point to the un-
loading point, with N passing loops or rail-houses
(RH) following the premises of times and movements
of the logistic system. The values of headway invol-
ved in the computational process were obtained rand-
omly according to specific route and operating cha-
racteristics as well as happens in dynamics complica-
ted systems or heavy-haul railways.
For all instances was adopted a saturation condi-
tion or heavy traffic in the system. For each duplica-
tion was adopted a period of 7 days. In order to ensure
statistical confidence level was defined an amount of
10 replications, based on a tolerance of at least 90%
through of the observation of the moving average fit-
ness, a simulation model output.
The model was developed in JSL generically re-
presenting railways with up to N segments. In other
simulation languages, this is a similar concept to ope-
ning a model building window (creating a model) and
dragging and dropping simulation constructs into the
model (Rossetti, 2008). Figure 4 presents the model
for the railway system proposed. The class ’ferrovia’
represents the entire system and can hold instances of
segments.
Figure 4: Java code based on JSL for a railway model.
Stochastic disturbances were implemented in the
JSL model by using a random routine creating events
that make the segments unavailable or failed (also
randomly). We defined to the railway system stu-
died in this work, random distributions to represent
the time between failures and deterministic time for
the duration of the failure.
The JSL administer inputs data in the three follo-
wing different interacting modules:
- Infrastructure module: Input data required by
this module concern to tracks capacity (single or du-
plicated) as well as the railway duplication strategy
setting up the order of each segment.
- Rolling stock module: Rail vehicles have been
represented in this model by defining the amount of
trains which are in the closed rail system.
- Timetable module: Import and export times be-
tween stations or passing loops with or without train
stop, stay times inside the load and unload points, are
all input data of this module.
The conception of the JSL rail model is based on
(Ara
´
ujo, 2013) which uses licensing rules, a set of ru-
les and procedures to ensure the safe movement of
trains.
6.2 Results
Results obtained for each instance are considered as
the average of simulation results over the 10 different
disturbed scenarios, or replications. The duplication
sequence problem has been solved for all the scena-
rios, considering a comparison with the LAM for this
problem.
ICEIS 2017 - 19th International Conference on Enterprise Information Systems
464
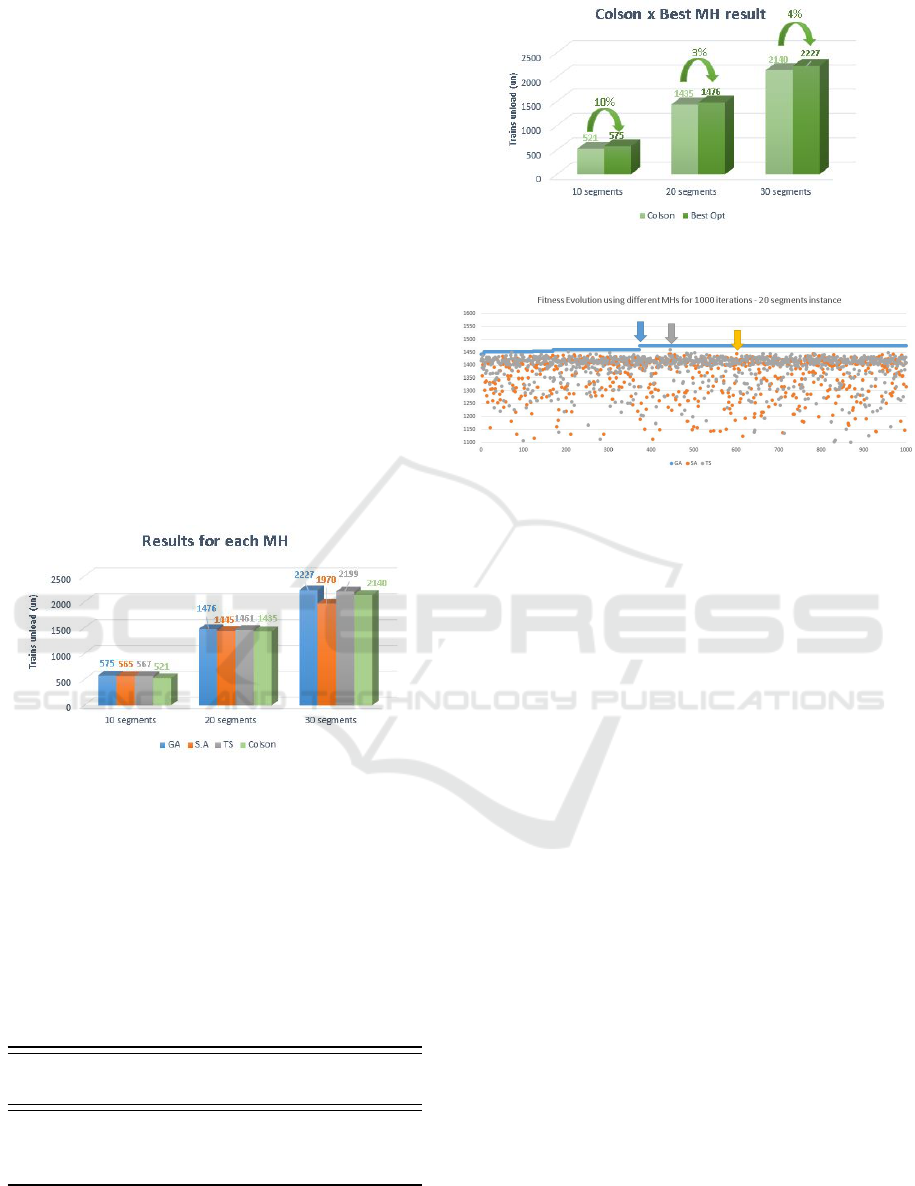
In figures 5 and 6 are shown the evolution curves
of the three MHs for 1000 iterations or generations
in the case of GA. It is possible to achieve a gain of
10% in the first instance. Furthermore, it is possible
to observe a decrease of this gain according to the in-
crease of the amount of segments. This probably hap-
pens because the search space increases exponentially
with more single-tracks in the problem as said in the
section 5.
Figure 5 reports the results for each MH in the 3
instances. The genetic algorithm achieves the best re-
sults unanimously for all the scenarios. We can also
analyze that the best result for the GA is achieved with
almost 400 iterations and after that we see just a con-
stant behavior (Fig. 7); in the figure 7 the blue line
refers to the GA, orange line to SA and gray line to
Tabu-Search.The tabu-search algorithm waits a little
more to achieve its best result as well as the simulated
annealing algorithm. This behavior is also observed
in the other instances, with another conclusion which
it indicates that the SA moves more away of the best
candidates.
Figure 5: Ranking of Meta Heuristics for the railway dupli-
cation sequencing problem.
Another advantage for the GA is the computing
time as shown in the table 4. The SA spent less time
than the GA and Tabu-search but do not achieve the
best candidate comparing with the LAM. The tabu-
search spent a huge computing time to explore the se-
arch space specially in the 30-segments railway sce-
nario.
Table 4: Computing times to solve the optimization pro-
blem (hours).
MH 10 seg-
ments
20 seg-
ments
30 seg-
ments
G.A. 3.7 16.5 40
S.A. 0.2 0.5 1.5
Tabu Search 10.3 45.4 140
Figure 6: Comparison between best MH result and the
LAM (Colson).
Figure 7: Fitness Evolution using different MHs for 1000
iterations - 20 instance segments.
7 CONCLUSIONS
Practitioners strongly need to increase the capacity le-
vel of freight transportation systems in order to meet
growing levels in passengers and freight demand. To
achieve this objective, to duplicate the routes of the
system is sometimes necessary. Duplication sequen-
cing problems are NP-hard optimization problems.
Up to now both in practice and in scientific literature,
companies and existing approaches have used analy-
tical linear methods for a problem which is naturally
complex and non-linear.
To solve this problem a simulation-based optimi-
zation methodology is presented which guides sear-
ching the optimal duplication sequence on routes of
freight transportation systems.
A case study with different instances for railways
is presented with the application of three MHs. The
objective of this study is finding satisfactory soluti-
ons compared with analytical linear methods, which
is relevant because it can help railway companies to
minimize costs and to increase railway productivities.
Furthermore, the duplication strategy in a whole rail-
way can be defined by considering only a single opti-
mization problem.
Results of models in different instances with N
single segments and stochastic factors which maxi-
mize the number of unloaded trains during the con-
struction period and which are also robust with re-
spect to random operation disturbances show the abi-
DOTSIM - A Simulation-based Optimization Methodology for the Optimal Duplication Sequence on Freight Transportation Systems
465

lity of DOTSIM to search global optimal solutions for
supporting duplication strategies in railways.
A comparison with analytical method underlined
that the proposed method strongly increases the rail-
way capacity and consequently decreases investment
costs.
Further research will be addressed to evaluate
more instances, more complex disturbances that can
influence the integrated system, such as several load
and unload points, exchange points etc.
ACKNOWLEDGEMENTS
This research is supported by FAPEMA.
REFERENCES
Ara
´
ujo, H. F. H. (2013). Utilizac¸
˜
ao de ferramentas de
simulac¸
˜
ao para analise de capacidade e dimensiona-
mento material rodante da efc.
Barros, J. (2013). Avaliac¸
˜
ao dos principais m
´
etodos
anal
´
ıticos de c
´
alculo de capacidade de tr
´
afego utiliza-
dos em ferrovia nacional e internacional. PhD thesis,
Dissertac¸
˜
ao de Mestrado–UFMG, Minas Gerais.
BRINA, H. L. (1982). Estradas de ferro, volume i e ii. Rio
de Janeiro, LTC: Livros T
´
ecnicos e Cient
´
ıficos Editora
SA.
Davis, L. (1985). Job shop scheduling with genetic algo-
rithms. In Proceedings of an international conference
on genetic algorithms and their applications, volume
140. Carnegie-Mellon University Pittsburgh, PA.
de Freitas Filho, P. J. (2001). Introduc¸
˜
ao
`
a modelagem e
simulac¸
˜
ao de sistemas: com aplicac¸
˜
oes em Arena. Vi-
sual Books.
Fourman, M. P. (1985). Compaction of symbolic layout
using genetic algorithms. In Proceedings of the 1st
international conference on genetic algorithms, pages
141–153. L. Erlbaum Associates Inc.
Fu, M. C. (1994). Optimization via simulation: A review.
Annals of Operations Research, 53(1):199–247.
Fu, M. C. (2002). Optimization for simulation: The-
ory vs. practice. INFORMS Journal on Computing,
14(3):192–215.
Gendreau, M. and Potvin, J.-Y. (2010). Handbook of meta-
heuristics, volume 2. Springer.
Glover, F. (1986). Future paths for integer programming
and links to artificial intelligence. Computers & ope-
rations research, 13(5):533–549.
Kang, L., Zhu, X., Wu, J., Sun, H., Siriya, S., and Kanok-
vate, T. (2014). Departure time optimization of last
trains in subway networks: mean-variance model and
gsa algorithm. Journal of Computing in Civil Engi-
neering, 29(6):04014081.
Kraft, E. R. (1982). Jam capacity of single track rail lines.
In Proceedings of the Transportation Research Forum,
volume 23.
Kroon, L., Mar
´
oti, G., Helmrich, M. R., Vromans, M., and
Dekker, R. (2008). Stochastic improvement of cyclic
railway timetables. Transportation Research Part B:
Methodological, 42(6):553–570.
Krueger, H., Vaillancourt, E., Drummie, A. M., Vucko, S. J.,
and Bekavac, J. (2000). Simulation within the railroad
environment. In Proceedings of the 32nd conference
on Winter simulation, pages 1191–1200. Society for
Computer Simulation International.
Pegden, C. D., Sadowski, R. P., and Shannon, R. E. (1995).
Introduction to simulation using SIMAN. McGraw-
Hill, Inc.
Rice, J. R. (1976). The algorithm selection problem. Ad-
vances in computers, 15:65–118.
Rossetti, M. D. (2008). Java simulation library (jsl): an
open-source object-oriented library for discrete-event
simulation in java. International Journal of Simula-
tion and Process Modelling, 4(1):69–87.
Wolpert, D. H. and Macready, W. G. (1997). No free lunch
theorems for optimization. IEEE transactions on evo-
lutionary computation, 1(1):67–82.
Wu, J., Kang, L., Sun, H., and Jia, X. (2012). Track allo-
cation optimization in railway station: mean-variance
model and case study. Journal of Transportation En-
gineering, 139(5):540–547.
Zhao, F. and Zeng, X. (2006). Simulated annealing–genetic
algorithm for transit network optimization. Journal of
Computing in Civil Engineering, 20(1):57–68.
ICEIS 2017 - 19th International Conference on Enterprise Information Systems
466
