
GIS-based Evacuation Routing using Capacity Aware Shortest Path
Evacuation Routing Algorithm and Analytic Hierarchy Process
for Flood Prone Communities
Cinmayii Manliguez
1,2
, Zarah Jean Diche
2
, Maria Jezebel Jimenez
1
,
Maureen Agrazamendez
1,2
and Joseph Acosta
1,2
1
Department of Mathematics, Physics, and Computer Science, College of Science and Mathematics,
University of the Philippines Mindanao, Davao City, 8022, Philippines
2
Phil-LiDAR 1.B.13 LiDAR Data Processing and Validation in Mindanao: Davao Region,
College of Science and Mathematics, University of the Philippines Mindanao, Davao City, 8022, Philippines
Keywords: Decision Theory, Flood, Uncertainty, Evacuation Routing.
Abstract: Evacuation routing is one of the fundamental instruments for flood risk mitigation. In this study, features
extracted from LiDAR data are used to create dynamic network composed of buildings and roads. Flood prone
areas identified through flood models from Phil-Lidar 1 Project are considered by Capacity Aware Shortest
Path Evacuation Routing algorithm to determine optimal routes. Road capacity and location of building
features were also considered. Uncertainties among possible paths taken are evaluated through Decision
Theory. Specific DT technique implemented to generate alternative routes for the possibility of detours is the
Analytic Hierarchy Process. This study can help city governance in terms of planning and disaster risk
reduction management.
1 INTRODUCTION
The Philippines experiences an average of 20
typhoons every year making it as one of the most
flood-prone countries in the world (Ortega, 2014).
One of the most destructive typhoons to have ever
been recorded in history, Super Typhoon Yolanda
(Haiyan) entered the Philippine archipelago on 08
November 2013 leaving 6,300 people dead, 28,688
injured, and 1,062 missing (NDRRMC, 2014).
Despite the early warnings issued by the Philippine
Atmospheric Geophysical Astronomical Services
Administration (PAGASA) to the general public,
these were not translated into appropriate actions in
every coastal village in the Central Philippine Region
(Lagmay et al., 2015), which resulted to the loss of
lives by the thousands. This can be prevented if the
warnings were also accompanied by appropriate
information to the people concerning with what to do
in case the signal is raised. Evacuation planning is one
fundamental instrument for risk mitigation that is
taken into focus in this study.
Routing is part of the evacuation planning process
that determines the best routes to relocate the affected
population to the nearest shelters—usually, within the
shortest amount of time possible for an individual.
However, it is not enough for an evacuation routing
problem to just generate the best routes for each
evacuee, it should also be able to adjust to the
dynamic changes that might occur within the road
network while the evacuation process is ongoing.
These dynamic changes can affect the road network
and consequently, the evacuation process. This
uncertainty can be dealt best with decision theory
(DT).
In many real world situations like evacuation
routing, decision can be settled through various
mathematical tools. Decisions based on mathematical
reckoning present a quantified proof on why such
decision was made with the assurance that
subjectivity, bias and rationality of decision maker
and the decision making process itself is not
magnified. DT is used to select the optimal decision
given a set of alternatives to choose from. It also
covers the concepts of negativity and selection of the
worst among choices which can be taken into
consideration in routing process especially if a sudden
change in the road network occurs.
The general aim of this study is to implement a
Manliguez, C., Diche, Z., Jimenez, M., Agrazamendez, M. and Acosta, J.
GIS-based Evacuation Routing using Capacity Aware Shortest Path Evacuation Routing Algorithm and Analytic Hierarchy Process for Flood Prone Communities.
DOI: 10.5220/0006327402370243
In Proceedings of the 3rd International Conference on Geographical Information Systems Theory, Applications and Management (GISTAM 2017), pages 237-243
ISBN: 978-989-758-252-3
Copyright © 2017 by SCITEPRESS – Science and Technology Publications, Lda. All rights reserved
237

decision theory technique to cope with the
uncertainties in the dynamic road network.
Specifically, the study aims to:
1. Introduce the Analytic Hierarchy Process to
the Capacity Aware Shortest Path Evacuation
Routing (CASPER) Algorithm to allow the
algorithm to adjust to the dynamic changes
within the road network; and
2. To apply the proposed CASPER-AHP
algorithm to a dynamic network, composed
of buildings and roads, which was created
using LiDAR data and the ArcGIS Network
Analyst Tool.
As previously mentioned, changes in the road
network are likely to happen at the time of a disaster.
Therefore, it is entirely possible that these changes
could affect some evacuation routes where no other
feasible routes can be achieved at that point,
indicating a dead end and the possibility of a
bottleneck occurring on the affected routes, leaving
the population extremely vulnerable when the
disaster strikes. The proposed algorithm can identify
such bottlenecks. In addition, if a change in the road
network occurs such that the affected roads are those
roads that connect to the destination point, instead of
re-routing the evacuees, this information can aid the
city officials by finding an alternative destination
point for the evacuees in order to minimize
evacuation time. Also, the generation of the optimal
evacuation routes can help in determining which
roads should be made available for the evacuees by
the time the disaster occurs.
This study only concerns the generation of the
optimal evacuation routes for the population residing
near the Lipadas River in Davao City. Their
geographical location, being close to the river
channels, leave them highly susceptible to flood
hazards. The residential areas close to the Talomo
River are considered in this study as a means to test
the effectiveness and the scalability of the proposed
solution.
2 BACKGROUND AND RELATED
LITERATURE
In the face of a natural disaster, evacuation planning
refers to the process of relocating the endangered
population to safer areas as soon as possible. The
study of Shahabi (2015) proposed a new taxonomy to
the evacuation planning problem in which the
problem is divided into three stages: preparation,
evacuation execution, and post-disaster response.
The evacuation execution stage refers to those
actions that are taken immediately, once the nature of
the disaster becomes known, to reallocate the
potentially endangered population to safety. At this
stage the location and time of the disaster is the key
information (Shahabi, 2015). The post-disaster
response stage is characterized by emergency
personnel caring for the affected population, shelter
maintenance, and disaster assessment. For example,
Eguchi et al. (2008) studied post-disaster damage
assessment using integrated GPS sensor network and
GIS. Lue et al. (2014) studied disaster damage
assessment by utilizing geo-tagged videos taken from
the affected areas.
Disasters can either be static or dynamic. Dynamic
disasters are characterized by their changing behavior,
location, or severity. Disasters such as tsunamis and
terrorist attacks are considered as static whereas
hurricanes, wildfires, and flood are dynamic (Shahabi,
2015). These dynamic disasters would evidently add
to the complexity in evacuation planning and has to
be considered in a realistic evacuation solution.
The evacuation routing problem refers to the
process of relocating the potentially affected
population towards safe destination points such as
shelters and hotels. The objective of this problem is
usually to minimize exposure, global evacuation time,
average travel time, or traffic congestion. An
effective routing solution should consider the
characteristics of the transportation network,
available transportation vehicles, as well as the
capacity of the potential destinations (Shahabi, 2015).
2.1 Flood Hazard Maps
Flood hazard maps are designed to identify the areas
that are at a risk of flooding and to increase the
awareness of the likelihood of flooding among the
public. They also encourage the population residing
in flood-prone areas to find out more about the local
flood risk and to take the appropriate action (Linham
and Nicholls, 2010).
To benefit from the flood hazard mapping, it is
important to provide the local community residing in
the flood hazard zone with the appropriate
information about emergency procedures and ways of
reducing the risk of flood, otherwise, presenting the
flood hazard maps may only serve to increase the fear
and anxiety of the residents.
2.2 Application of GIS Techniques
A geographical information system (GIS) is a
computer system that is designed to support the
GISTAM 2017 - 3rd International Conference on Geographical Information Systems Theory, Applications and Management
238

capture, management, manipulation, analysis, and
modeling and display of spatially-referenced data
suitable for solving complex planning and
management problems (Cole et al., 2005).
All stages of the evacuation planning problem
identified by Shahabi (2015) can greatly benefit from
the application of GIS. Gaining access to the
appropriate data is the key. In an emergency, it is
critical to have the right data, at the right time,
displayed logically, to respond and take the
appropriate action. By utilizing GIS, this data can be
shared throughout different agencies or departments
with the use of spatial databases held in one central
location. GIS provides a mechanism to centralize and
visually display critical information in the midst of an
emergency (Cole et al., 2005).
With regards to preparation, GIS can be used to
provide answers to particular questions such as
identifying the safest location for the critical facilities,
selecting of evacuation routes based on the
anticipated or actual flood, or determining whether
the transportation network can handle the sudden
increase in traffic flow.
Lastly, in the post-disaster response stage, GIS
can play a role in the disaster damage assessment and
information management. With the use of GPS and
telecommunication devices, assessments of the
damages can be geo-referenced and transmitted back
to the emergency headquarters for real-time update of
the recovery (Cole et al., 2005).
2.3 Evacuation Routing Methods
The existing evacuation routing methods can be
divided into the following classifications: simulation,
network flow, and heuristic methods (Shekhar et al.,
2012).
2.3.1 Simulation Methods
Simulation methods are solutions that visually
simulate an emergency situation. It tries to visualize
what could possibly happen as realistically as
possible. Flow-based modeling, agent-based
modeling, and cellular automaton modeling are just
some of the methods that would fall into this category
(Santos and Aguirre, 2004). These tend to focus more
on the individual evacuees' movements and their
interaction with one another (Mahmassani et al.,
2004).
2.3.2 Network Flow Methods
Many research works have been done to model the
evacuation problem as a network flow problem and to
find the optimal solution using the linear
programming (LP) methods. Hamacher and Tjandra
(2002) gave an extensive literature review on the
models and algorithms used in these linear
programming methods. It initially models the
evacuation network into a network graph (denoted by
G), then it requires the user to enter an estimated
upper bound T of the evacuation egress time. Second,
it converts the network graph G into a time-expanded
network (denoted by GT), by duplicating the
evacuation network G for each discrete time unit t =
0, 1, 2, ..., T. Then, it defines the evacuation problem
as a minimum cost network flow problem (Ford and
Fulkerson, 1962) on GT. Lastly, it feeds the GT to the
minimum cost network flow solvers, such as
NETFLO (Kennington and Helgason, 1980), to
obtain the optimal solution.
2.3.3 Heuristic Methods
Unfortunately, in a real-world urban evacuation
scenario, the evacuation demand can easily
overwhelm the capacity of the evacuation routes,
resulting to traffic congestion (Bish et al., 2013).
Congestion is not only inconvenient, but can also
cause potentially dangerous situations because it
discourages evacuation from potentially affected
areas and it can leave the evacuees extremely
vulnerable if they are trapped in the affected areas and
it can leave the evacuees extremely vulnerable if they
are trapped in the affected roadways when the disaster
strikes. Furthermore, congestion can make the entire
evacuation process itself hazardous (Bish et al., 2013).
One of the limitations of CCRP is that it assumes that
the maximum capacity of an edge does not depend on
the traffic flow amount on the edge (Lu et al., 2005).
In other words, it does not consider the traffic
congestion realistically.
2.3.4 Casper Algorithm
The Capacity Aware Shortest Path Evacuation
Routing (CASPER) algorithm is a heuristic
evacuation routing method that connects each source
node (evacuee) to its nearest destination while taking
into account the capacity of the transportation
network and the traffic flow in order to minimize
traffic congestion and system-wide transportation
times (Shahabi and Wilson, 2014). The algorithm first
sorts the evacuees based on their distance from the
closest destination area. Then, starting from the
evacuee with the longest distance, it finds the shortest
path and assigns the evacuee to that path. It iteratively
continues this process until there are no more
evacuees left, indicating that the affected population
GIS-based Evacuation Routing using Capacity Aware Shortest Path Evacuation Routing Algorithm and Analytic Hierarchy Process for
Flood Prone Communities
239

has successfully been removed from the hazard area.
During the analysis, CASPER dynamically updates
the edge travel costs based on the number of assigned
evacuees and the capacity of the edge (Shahabi, 2012).
Each source point s is metered (interval(s)) so it
will generate a different flow on each edge. For
example, evacuees leaving from a source point at 20s
intervals have interval(s) = 20. Each source point also
has only one path P
s
assigned to them. A path P
s
is an
ordered set of edges that will guide all the population
from source point s to safety (t). From here, the total
flow on edge e can be calculated by summing up all
flows of all paths that pass through e (Shahabi and
Wilson, 2014).
Traffic Model. The traffic model is defined as a
function with two parameters T(f,c). The traffic model
predicts the congestion on an edge based on its
capacity and total flow. From there, the cost of
traversing an edge, and consequently the cost of
traversing a path, can be calculated (Equation 1 and
2).
(1)
(2)
The main objective here is to minimize the cost of
the path with the highest cost.
(3)
The calculation in Equation 3 considers both the
previously reserved paths and the new population
flow (i.e. flow(s,e)) so there is a need to record all the
reserved paths. Lastly, the costs of all the paths are re-
calculated. This step is important since the record of
the reserved paths is not complete during the path
finding process and therefore the costs are just a lower
bound. Once all the paths are reserved, their costs
need to be re- calculated to find the most accurate
global evacuation time (Shahabi, 2015).
2.4 Dynamic Evacuation Routing
Problem
The dynamic evacuation routing problem describes
the problem of generating as well as maintaining
evacuation routes in a dynamic environment. In a
realistic evacuation scenario, unpredictable situations
can occur within the environment whilst the
evacuation process is still ongoing. For example,
changes in the road network such as road blockages,
car accidents, and flooded underpass can affect the
road network and consequently the evacuation
process. If a change in the transportation network
occurs, the evacuation routing system should be able
to detect that change, inform those evacuees whose
routes might be affected from the change, and update
these routes in a timely manner (Shahabi, 2015).
2.5 Analytic Hierarchy Process (AHP)
The Analytic Hierarchy Process (AHP) method was
developed by Saaty (2008) and has been widely used
to solve multi-criteria decision making problems.
Some examples of multi-criteria decision making
problems are: choosing a telecommunication system,
choosing a product marketing strategy, etc.
(González-Prida et al., 2012). These decision
problems are decomposed into a hierarchy of criteria
and alternatives.
In AHP, values like price, weight, or time, or
even subjective opinions such as feelings, preference,
or satisfaction, can be translated into measurable
numerical relations. The core of AHP is that it does
comparison of pairs instead of sorting (ranking),
voting (e.g. assigning points), or free assignment of
priorities. Individuals and groups use the AHP
preference scale to formulate the comparison
matrices (Alexander, 2012)).
Saaty (2008) provided a measure of consistency,
called the Consistency Index (CI), as a degree of
consistency. Once the consistency index is calculated,
its value is compared with the appropriate one. The
appropriate consistency index is called the Random
Consistency Index (RI) which was obtained from
associated random matrices of order n to compute the
error due to inconsistency (Nieto et al., 2015). This
comparison of values is called the Consistency Ratio
(CR).
If the value of the Consistency Ratio is smaller
than or equal to 0.10, then the inconsistency is
considered acceptable, otherwise, it must be reviewed
to improve its consistency (González-Prida et al.,
2012).
3 METHODOLOGY
In this study, the Analytic Hierarchy Process will be
introduced to the Capacity Aware Shortest Path
Evacuation Routing (CASPER) algorithm. This
proposed algorithm will be applied to the road
networks along Lipadas River. The results will be
compared to those results obtained from using
previous evacuation methods.
GISTAM 2017 - 3rd International Conference on Geographical Information Systems Theory, Applications and Management
240
3.1 Benchmark Data Sets
The flood hazard maps of Lipadas and Talomo will
be used in this study to identify the areas within the
road network that are at a risk of flooding. Road
networks and building features will also be used for
the dynamic network. All data were generated
through the use of LiDAR data obtained from the
Phil-LiDAR 1 Office of the University of the
Philippines Mindanao.
3.2 Road Network
In this study, the ArcGIS Network Analyst Tool will
be used to build the road network. It provides
network-based spatial analysis including point-to-
point routing, travel directions, closest facility, and
service area analysis. By using an advanced network
data model, networks from their geographic
information system (GIS) data are built. It enables
users to dynamically model realistic network
conditions (i.e. turn restrictions, speed limits, traffic
conditions) at different times of the day (ESRI, 2014).
3.3 Source Points and Destination Points
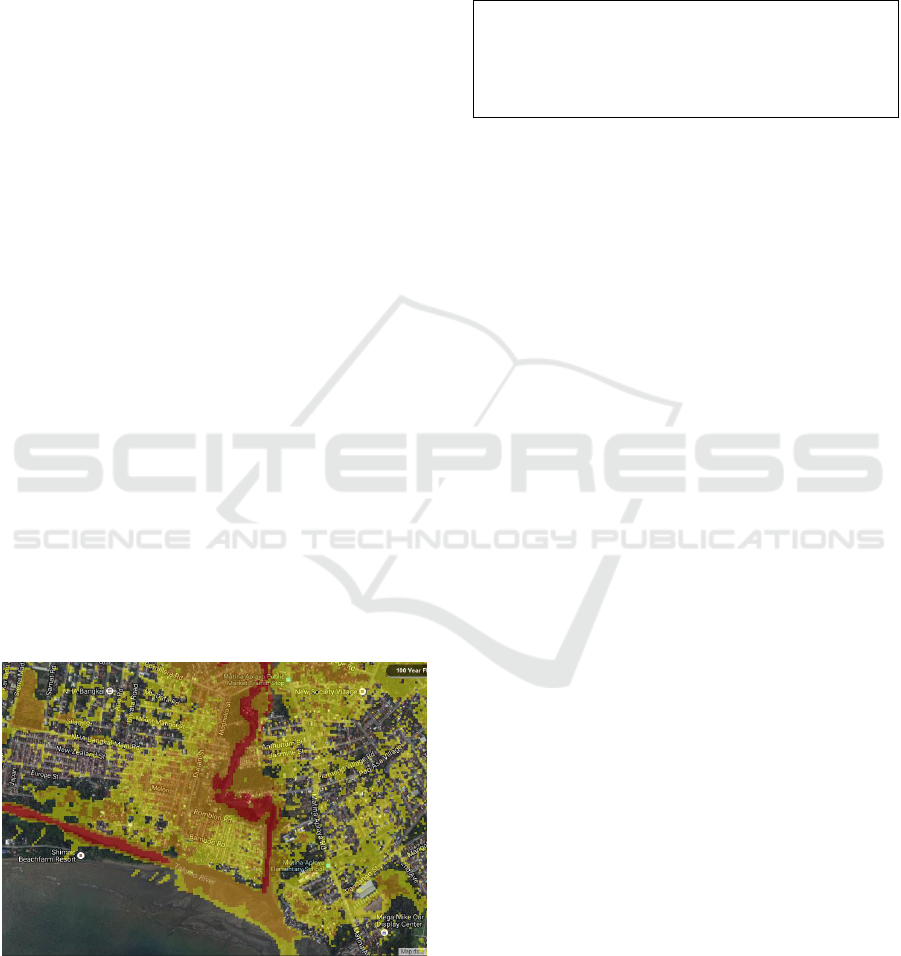
The flood hazard maps of Lipadas and Talomo will
be used in this study to identify those areas within the
road network that are at a risk of flooding. Areas that
are marked red indicate a high flood hazard (>1.5m).
Those that are marked orange indicate a moderate
flood hazard (0.5 – 1.5m). Areas that are marked
yellow indicate a low flood hazard (<0.5m). Figure 1
shows the 100-year return period flood hazard map of
the Talomo area (Project NOAH, 2016).
Figure 1: 100 Year Flood Hazard Map of Talomo (Project
NOAH, 2016).
3.4 Evacuation Framework
The evacuation framework is initially specified which
includes all the discussed requirements. It will also
include some steps needed for the experimental
evaluations. The pseudo-code, as shown in Figure 2,
outlines the overall system.
input: G(V,E), S, t, T(f,c)
P ← GetEvcRoutes(G, S, t, T )
EvcTime ← max{P
s
| P
s
P}
SimTime ← Simulation(G, S, P )
return P, EvcTime, and SimTime
Figure 2: Evacuation Framework.
The system inputs the road network in the form
of a directed graph G. Let set S be the source
population with their intervals interval(s). The
function T denotes the chosen traffic model. The
GetEvcRoutes function processes the inputs to
generate one evacuation route for each source point.
All the paths end at vertex t, which serves as the
destination point for all the source points. The
EvcTime variable serves as the predicted global
evacuation time based on the routes generated for the
source population. Based on the lengths of the
generated paths and the traffic predictions, it takes
EvcTime time to get everyone to the destination point
(safety). SimTime, on the other hand, is the simulated
global evacuation time. This is only included for
evaluation purposes. The Simulate function takes the
graph, source points, and the generated paths as
inputs. Instead of predicting the time, it simulates
every person (vehicle) moving from s to t on the road
map (graph) whilst taking into account the
interactions between evacuees (vehicles). SimTime is
recorded time for the last evacuee to reach his or her
destination. The accuracy of the traffic model is
measured by comparing the two times (Shahabi and
Wilson, 2014).
3.5 CASPER-AHP Algorithm
The CASPER algorithm will be hybrid with the
Analytic Hierarchy Process to allow the evacuation
routing algorithm to adjust to the dynamic changes
that might occur within the road network whilst the
evacuation is still ongoing. The changes to the road
network are not initially known; hence, the algorithm
can only adjust once it learns about them. In this study,
road blocks will be introduced to the road network
during evacuation. The selection of the paths in which
the road blocks occur will be done at random.
The AHP will be embedded into the CASPER
algorithm once a change has been detected in the road
GIS-based Evacuation Routing using Capacity Aware Shortest Path Evacuation Routing Algorithm and Analytic Hierarchy Process for
Flood Prone Communities
241

network. As mentioned earlier, each edge e has a
positive nonnegative impedance (imp) and road
capacity (cap) associated to it. Neither of these values
are constant since the road network can change during
evacuation. In other words, the graph edges are
allowed to change their values at some time after the
evacuation starts.
Once a road block is introduced on the edge, the
edge becomes no longer accessible. When this
happens, the algorithm should be able to backtrack to
the previous edge. The embedded AHP will decide
which alternate path the evacuees should take
(detours). This study will implement a two-level
hierarchy AHP. The first level deals with the factors
to consider in choosing the alternative route for the
evacuees whose original path is affected by the road
block. The second level deals with the alternative
routes.
The steps in formulating the solution to the
decision problem using AHP as summarized by
Goepel (2013) are answered as follows:
1. Define the goal of the decision — the purpose
of this decision is to have the evacuees adjust
to the changes within the road network by
selecting the best alternative route to them.
2. Model the decision problem into a hierarchy
— the following criteria are considered in
deciding the best alternative route for the
evacuees: road capacity, road type, road status
(in terms of flood risk), and the traffic
congestion on that road.
3. Pair comparison of criteria in each category —
In level, there will be one comparison matrix
corresponding to the pair-wise comparisons
between the four criteria with respect to the
goal. Thus, the comparison matrix of level 1
has a size of 4 by 4. Since each choice is
connected to each factor, then there is a total of
four comparison matrices at level 2. The size
of the matrices on that level depends on the
number of choices.
4. Calculate the priorities and consistency index
— Use the Consistency Index (CI) and the
Consistency Ratio (CR) to check for the
consistency of the comparisons. The Random
Consistency Index (RI) value in this case is
0.90.
5. Evaluate alternatives according to the
calculated priorities — Compute the overall
weight of each alternative choice based on
the weight of level 1 and level 2. The overall
weight is the normalization of linear
combination of multiplication between
weight and priority vector.
In the proposed CASPER-AHP algorithm, it is
assumed that the changes in the road network are not
initially known. Therefore, the beginning steps are
similar to that of the CASPER algorithm with a static
problem. It loops over all the evacuee source points.
The algorithm finds the shortest path to the
destination point and is assigned to the source point.
The changes in the road network are known once a
path has already been assigned to the source point.
The changes in the road network are known once a
path has already been assigned to the source point.
The selection of the edge to where the road block is
introduced done at random. As previously mentioned,
once a road block is placed on the edge, that edge
becomes no longer accessible, so it is logical to
remove that edge from the road network. If the
selected edge is part of the reserved path for source
point s, the AHP function is called to allow the
evacuees at that source point to backtrack to the
previous edge (remember that a path P
s
is defined as
an ordered set of edges that will guide all the
population from s to safety). From there, the AHP
function will decide which alternate path the evacuees
should take from that edge. This allows the algorithm
to adjust to the dynamic changes within the road
network.
4 EXPECTED RESULTS AND
FUTURE DIRECTION
The proposed combined algorithm is expected to be
used during the flood event given that there is already
a flood hazard map downloaded in a specific device.
In the future, this proposed method will be optimized
so that it can be integrated into an application that can
be used on any devices that is portable during flood
event such as smartphones, tablets, etc.
ACKNOWLEDGEMENTS
This study is under the Phil-Lidar 1.B.13 research
project of the University of the Philippines Mindanao
that is funded by the Department of Science and
Technology (DOST) and the Philippine Council of
Industry, Energy and Emerging Technology Research
and Development (PCIEERD) of the Philippines.
GISTAM 2017 - 3rd International Conference on Geographical Information Systems Theory, Applications and Management
242

REFERENCES
Alexander, M., 2012. Decision-Making using the Analytic
Hierarchy Process (AHP) and SAS/IML. SESUG-2012.
1-12.
Bish, D., Sherali, H. and Hobeika, A., 2013. Optimal
evacuation planning using staging and routing. Journal
of the Operational Research Society. 65(1), 124-140.
doi:10.1057/jors.2013.3.
Caldara, F. R., Garcia, R. G., Almeida Paz, I. C. L., Nääs, I.
A., Santos, R. K. S. and Foppa, L., 2013. Assessing the
most suitable floor system for growing finishing
piggery under tropical conditions using the analytic
hierarchy process. Italian Journal of Animal Science.
13(1), 136-141. doi: 10.4081/ijas.2014.2830.
Cole, J. W., Sabel, C. E., Blumenthal, E., Finnis, K., Dantas,
A., Barnards, S. and Johnston, D. M., 2005. GIS-based
Emergency and Evacuation Planning for Volcanic
Hazards in New Zealand. Bulletin of the New Zealand
Society for Earthquake Engineering. 38(3), 149-164.
Eguchi, R. T., Huyck, C. K., Ghosh, S. and Adams, B. J.,
2008. The Application of Remote Sensing
Technologies for Disaster Management, in: The 14th
World Conference on Earthquake Engineering, Beijing,
China.
ESRI, 2014. What is GIS? [WWW Document].
Environmental Systems Research Institute. URL
https://www.esri.com/what-is-gis/overview (accessed
10.06.16).
Ford, F. R. and Fulkerson, D. R., 1962. Flows in networks.
Princeton University Press, Princeton, New Jersey.
Georgiadou, P. S., Papazoglu, I. A., Kiranoudis, C. T. and
Markatos, N. C., 2007. Modeling Emergency
Evacuation for Major Hazards and Industrial Sites.
Reliability Engineering and System Safety. 92(10),
1388-1402.
González-Prida, V., Barberá, L., Viveros, P. and Crespo, A.,
2012. Dynamic analytic hierarchy process: AHP
method adapted to a changing environment. IFAC
Proceedings Volumes (IFAC-PapersOnline). 25–29.
doi: 10.3182/20121122-2-ES-4026.00005.
Hamacher, H. W. and Tjandra, S. A., 2002. Mathematical
Modeling of Evacuation Problems: A State of the Art,
in: Pedestrain and Evacuation Dynamics. Springer
Berlin Heidelberg, pp. 227-266.
Hart, P. E., Nilsson, N. and Raphael, B., 1968. A formal
basis for the heuristic determination of minimum cost
paths. IEEE Transactions on Systems Science and
Cybernetics. 4(2), 100–107. doi:
10.1109/TSSC.1968.300136.
Kennington, J. L. and Helgason, R. V., 1980. Algorithms
for Network Programming in: Networks. Wiley and
Sons, New York, 12, 87-88.
doi:10.1002/net.3230120107.
Lagmay, A. M. F., Agaton, R. P., Bahala, M. A. C., Briones,
J. B. L. T., Cabacaba, K. M., Caro, C. V. C., Dasallas,
L. L., Gonzalo, L. A. L., Ladiero, C. N., Lapidez, J. P.,
Mungcal, M. T. F., Puno, J. V. R., Ramos, M. M. A. C.,
Santiago, J., Suarez, J. K. and Tablazon, J. P., 2015.
Devastating storm surges of Typhoon Haiyan.
International Journal of Disaster Risk Reduction. 11, 1-
12. doi: 10.1016/j.ijdrr.2014.10.006.
Linham, M. M. and Nicholls, R. J., 2010. Flood hazard
mapping [WWW Document]. ClimateTechWiki. URL
http://www.climatetechwiki.org/content/flood-hazard-
mapping (accessed 10.01.16).
Lu, Q., George, B. and Shekhar, S., 2005. Capacity
Constrained Routing Algorithms for Evacuation
Planning: A Summary of Results, in: Advances in
Spatial and Temporal Databases. Springer Berlin
Heidelberg, 3633, 291-307. doi:10.1007/ 11535331_17
Lue, E., Wilson, J. P. and Curtis, A., 2014. Conducting
Disaster Damage Assessments with Spatial Video,
Experts, and Citizens. Applied Geography 52. Elsevier
Ltd: 46-54. doi:10.1016/j.apgeog.2014.04.014.
Mahmassani, H. S., Sbayti, H. and Zhou, X., 2004.
DYNASMART-P Version 1.0 User's Guide. Maryland
Transportation Initiative, College Park, Maryland.
NDRRMC. 2014. National Disaster Risk Reduction
Management Council. Philippines. URL
www.ndrrmc.gov.ph (accessed 09.04.16)
Nieto, V. M. O. S., Caldara, F. R., Nääs, I. A., Moi, M.,
Almeida Paz, I. C., Garcia, R. G., Seno, L. O. and
Santos, L. S., 2015. Applying multicriteria analysis for
choosing the best marination for pork. Revista MVZ
Cordoba. 20(1), 4396-4405.
Ortega, A., 2014. Philippines' Country Report 2014 [WWW
Document]. Country Report, Asian Disaster Reduction
Center (ADRC). URL http://www.adrc.asia/
countryreport/PHL/2014/PHL_CR2014B.pdf
(accessed 10.31.16).
Project NOAH, 2016. DOST - Nationwide Operational
Assessment of Hazards. URL http://noah.dost.gov.ph/
(accessed 09.04.16)
Saaty, T. L., 2008. Decision making with the Analytic
Hierarchy Process. International Journal of Services
Sciences. 1(1), 83-98.
Santos, G. and Aguirre, B. E., 2004. A Critical Review of
Emergency Evacuation Simulation Models, in:
Building Occupant Movement During Fire
Emergencies. Disaster Research Center, University of
Delaware.
Shahabi, K., 2012. Out of Harm’s Way: Enabling
Intelligent Location-Based Evacuation Routing
[WWW Document]. ArcUSER. URL
http://www.esri.com/news/ arcuser/0612/out-of-harms-
way.html (accessed 10.02.16).
Shahabi, K. and Wilson, J. P., 2014. CASPER: Intelligent
capacity-aware evacuation routing. Computers,
Environment and Urban Systems. 46, 12-24. doi:
10.1016/ j.compenvurbsys.2014.03.004
Shahabi, K., 2015. Scalable Evacuation Routing in
Dynamic Environments. University of Southern
California.
Zeng, M. and Wang, C., 2009. Evacuation Route Planning
Algorithm: Longer Route Preferential, in: Advances in
Neural Networks – ISNN 2009. Springer Berlin
Heidelberg. 5551, 1062–1071. doi: 10.1007/978-3-642-
01507-6_119.
GIS-based Evacuation Routing using Capacity Aware Shortest Path Evacuation Routing Algorithm and Analytic Hierarchy Process for
Flood Prone Communities
243
