
Towards Computer-based Exams in CS1
Vesa Lappalainen
1
, Antti-Jussi Lakanen
1
and Harri H
¨
ogmander
2
1
Faculty of Information Technology, University of Jyv
¨
askyl
¨
a, 40014, Jyv
¨
askyl
¨
a, Finland
2
Department of Mathematics and Statistics, University of Jyv
¨
askyl
¨
a, 40014, Jyv
¨
askyl
¨
a, Finland
Keywords:
CS1, Computer-based Exam, Rainfall, Paper Vs. Computer, Novice Programmers.
Abstract:
Even though IDEs are often a central tool when learning to program in CS1, many teachers still lean on paper-
based exams. In this study, we examine the “test mode effect” in CS1 exams using the Rainfall problem.
The test mode was two-phased. Half of the participants started working on the problem with pen and paper,
while the other half had access to an IDE. After submitting their solution, all students could rework their
solution on an IDE. The experiment was repeated twice during subsequent course instances. The results were
mixed. From the marking perspective, there was no statistically significant difference resulting from the mode.
However, the students starting with the paper-based part tended to make more errors in their code, but after
the computer-based reworking phase, they matched or exceeded the level of the students who started with the
computer-based phase. We also discuss the reliability of automatic assessment that is based on a unit test suite
that was developed for the purposes of this study.
1 INTRODUCTION
Working with integrated development environment
(IDE) and its advantages such as with debugging,
rapid visual feedback, and automatic unit testing can
be considered a part of a natural workflow in an in-
troductory programming course. Besides these ben-
efits from the student’s point of view, practical pro-
gramming in computer-based environment provides
teachers a way of evaluating students’ application and
problem-solving skills in a semi- or fully automatic
fashion (computer-based or computer aided assess-
ment, see, Carter et al., 2003; Russell et al., 2003).
Yet, final exams in CS1 are often conducted with pen-
and-paper. In the authors’ local context, computer-
based exams have long been wished for by the stu-
dents. In this study, we investigate the test mode
effect of a two-phased CS1 final exam. A half of
students starts working with the exam with pen-and-
paper, while the other half starts working with com-
puters.
One of the obvious challenges of arranging a
computer-based exam on a mass course is the need
for numerous computers and classrooms to serve all
the participants. In a typical course of ours, there are
around 250 students, but only 96 computers available
in the computer labs. In a setting where students do
the same exam at the same time, dividing students to
groups and scheduling computer time is practically
the only option.
Even though a typical CS1 incorporates other
practical parts – such as weekly assignments or a big-
ger project – that contribute to student’s final grade,
course assessment that is solely based on project work
or weekly assignments can be problematic for at least
two reasons. First, students often collaborate with
peers and teaching assistants while working on the as-
signments. While we encourage students to ask ques-
tions and collaborate, it is difficult point out which
part of the code a student has figured out himself
and which part he or she could not have completed
without help from the peers or teachers (Carter et al.,
2003). For these reasons, an exam, an open-book
exam in our case, can be seen as a reasonably reliable
way to assess a CS exam.
The objectives for this work were (1) to investigate
if the opportunity to use computers in exams helps in
achieving less erroneous code, (2) to inspect to what
extent students are able to rework their initial solution
(regardless whether it was developed using pen and
paper or on an IDE) after giving them a test suite, and
(3) to explore how reliable automated assessment is
compared to manual, human-made assessment.
Lappalainen, V., Lakanen, A-J. and Högmander, H.
Towards Computer-based Exams in CS1.
DOI: 10.5220/0006323501250136
In Proceedings of the 9th International Conference on Computer Supported Education (CSEDU 2017) - Volume 2, pages 125-136
ISBN: 978-989-758-240-0
Copyright © 2017 by SCITEPRESS – Science and Technology Publications, Lda. All rights reserved
125

2 RELATED WORK
The test mode effect was investigated extensively dur-
ing the 1980s and ever since the computers became
more common in educational settings. Even though
a few decades ago reading text from screen typically
took a little longer than reading from the paper, this
effect of speededness is largely negated by today’s
advanced screen technology, such as increased screen
resolution (Leeson, 2006). Earlier studies that have
compared the use of paper-based exam (PBE) and
computer-based exam (CBE) have been concentrat-
ing in computerized versions of multiple choice ques-
tions (MCQs) or assignments that require plain writ-
ing (
¨
Ozalp-Yaman and C¸ agıltay, 2010; Bodmann and
Robinson, 2004). Less research has been focused
on the test content and the process of switching be-
tween test modes. At the very least, computerized
testing produces a qualitatively different experience
from pencil-and-paper testing for the test-taker (Mc-
Donald, 2002). Obviously, IDEs provide many tools,
such as debugging and automated testing, that are not
available in PBE. The question is, how beneficial are
these tools for the test-taker in an exam situation? In
our literature retrieval, we only found one study that
discusses the benefits of an IDE over pen-and-paper
coding: Grissom et al. (2016) investigated recursive
binary tree algorithms, and did a goal-plan analysis
as well as error inspections on student solutions. They
found that the students who took the computer-based
exam succeeded more often in writing fully correct
solutions and also made less errors than those who
took the paper-based exam. Switching between dif-
ferent modes was not studied, however, which acts as
motivation for this study.
Regarding the question about CBE vs PBE, the
Rainfall problem can be considered a good reference
point for such study settings. The problem is widely
known in computer science education literature and
has often been used in programming exams (Sepp
¨
al
¨
a
et al., 2015). An interesting characteristic of the prob-
lem is that although the problem seems easy at first
glance, it soon proves to be quite tricky for many CS1
students (Venables et al., 2009). One of the earliest
studies of Rainfall was conducted by Soloway (1986),
and later by Ebrahimi (1994). During the 21st cen-
tury, new vantage points—including functional pro-
gramming (Fisler, 2014), particularly “bad scenarios”
(Simon, 2013), and how to link Rainfall to other exam
assignments—(Lakanen et al., 2015) have emerged.
In this study, we use the Rainfall problem to identify
differences between test modes. In particular, we in-
spect which subgoals (that is, smaller tasks within the
problem itself, see Soloway, 1986) the students stum-
ble to, and also recognize errors based on unit test
suite.
3 METHODS
3.1 Participants and Context
Students from two CS1 exams were included: 109
participants took the Spring 2015 exam, and 254 par-
ticipants took the Autumn 2015 exam. The students
consisted of both computer science majors as well as
minors. The content and structure of the different
course instances were close to identical. The weekly
routines consisted of two lectures, lab sessions, vol-
untary support sessions, assignments and their re-
views. Furthermore, in both courses a similar peda-
gogical approach was adopted, and included, for ex-
ample, demonstrations during the lectures using live
programming and interactive clicker sessions.
This 11-week course is a traditional procedural
CS1, starting with variables, operators, selection, and
functions, carrying on to repetition, arrays, and so
on. The concept of array, one of the key points
of the Rainfall problem, is introduced briefly during
the first course week, and more thoroughly from the
fourth week onwards. During the course, the con-
tent is brought into context with a “game theme,”
where a part of the examples and exercises relate
to games each week. To improve code quality, stu-
dents were introduced to the test-driven development
(TDD) approach, and were encouraged to write unit
tests with the ComTest tool (Isom
¨
ott
¨
onen and Lap-
palainen, 2012). While writing tests first and then
using them to develop programs is highly recom-
mended, it was not obligatory. However, students
who write unit tests in the weekly assignments and
in the final exam are credited with extra points. In the
light of the present study, it was hypothesized that stu-
dents writing tests would benefit from the convention
of thinking over and writing down the examples of
function inputs and outputs before writing the func-
tion implementation.
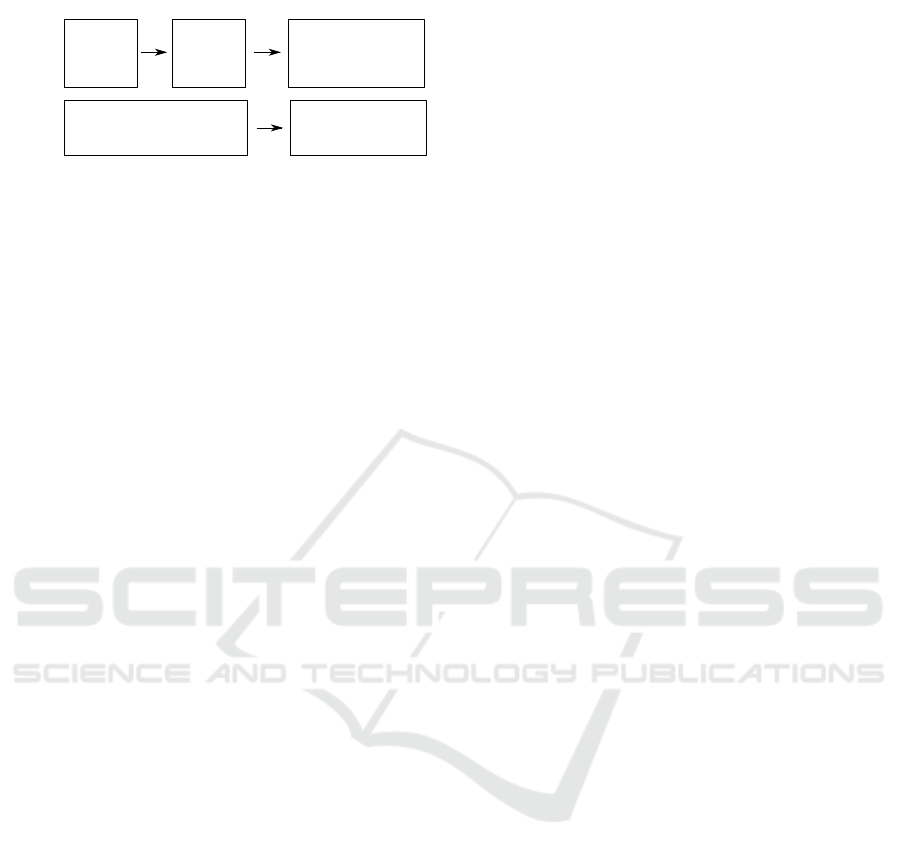
3.2 Study Design
The study design was composed of two final exam as-
signments: a regular Rainfall problem (Assignment
1), and an additional part (Assignment 2), where stu-
dents were given a ready-made collection of unit tests
after they had submitted their solutions for Assign-
ment 1. In Assignment 2, the students were allowed
to take their Assignment 1 solution and improve it so
CSEDU 2017 - 9th International Conference on Computer Supported Education
126
Assignment 1
Assignment 2
{
RF
(paper-
based)
Rework RF
w/ own tests
(computer-
based)
Continue RF w/ test suite
(computer-based)
Group P
(started
w
ith
Paper)
Group C
(started
w
ith
Computer)
RF w/ own tests
(computer-based)
Continue RF w/ test suite
(computer-based)
Figure 1: Study design. (RF = Rainfall).
that it fulfills the given unit test suite, and then sub-
mit this as their Assignment 2 solution. Students,
were divided into two groups: Group P, which started
the exam with a paper-based part and then moved on
to the computer-based part, whereas Group C worked
with computers for both the assignments 1 and 2.
Both groups worked simultaneously. While work-
ing on the computer, students were only allowed to
use the IDE in addition to the online submission sys-
tem. The total duration of the exam was limited
to a maximum of four hours. The paper-based and
computer-based phases were located in physically dif-
ferent classrooms, so the students had to walk a short
distance during the exam when switching the phase.
We divided the participants into homogeneous
groups in order reduce disturbing random variation
within Groups P and C. To this end, the students were
first divided into four groups based on their major:
computer science, information systems, physics, and
others. This division was tested with analysis of vari-
ance (ANOVA) to reveal differences in previous au-
tumns’ final exam scores. For example, the scores
of students who majored in information systems were
at least 3.2 points (out of 24) lower. After this pre-
division, students were randomly divided into Group
P and Group C.
3.3 Assignment 1: Rainfall Problem
The first assignment for each group was the Rainfall
problem. The Group P started with pen and paper.
After submitting this phase of the assignment, they
moved the a computer class and copied their solution
to a computer verbatim (this was done for data collec-
tion purposes and to prepare the students for Assign-
ment 2). Furthermore, they were given the opportu-
nity to use an IDE, and rework on their Rainfall prob-
lem as well as to write their own unit tests (see Sec-
tion 3.4) before moving onto Assignment 2 (see Sec-
tion 3.5). However, the students did not know about
this possibility before submitting their pen and paper
solutions.
On their part, the Group C started working on the
same problem with the computers, and were allowed
to write and run their own test cases.
The same question was used on both Spring and
Autumn courses; however, the wording was slightly
modified to prevent, or at least reduce, direct copy-
pasting of previous exam solutions. While the Spring
2015 version (see Listing 1) used traditional Rain-
fall phrasing, in the Autumn 2015 version the idea of
falling rain was replaced with an analogous idea of a
teacher throwing candies to students during lectures.
Other changes included replacing a floating point ar-
ray with an integer array. The sample content was
also replaced with new numbers. Further, one exam-
ple unit test was provided to the students.
Listing 1: Our Spring 2015 version of the Rainfall problem.
/* Imp le me nt the ‘Avera ge ’ funct ion ,
which ta kes the am ou nt s of ra in fa ll
as an array and ret ur ns the avera ge
of th e arra y . N ot ic e that if the
value of an ele me nt is le ss than or
equal to 0 ( ‘ lower Lim it ’) , it is
dis car ded , an d if it is g reate r
tha n or equ al to 999 ( ‘ sentine l ’) ,
sto p ite ratin g ( the sen ti ne l val ue
is no t cou nt ed in the av er ag e ) and
re turn the ave ra ge of c ou nt ed
va lues . */
pu blic cla ss Ra in fa ll {
pu blic stati c void Mai n () {
do uble [] rai nf all s = new d ou ble []
{ 12 , 0, 42 , 14 , 999 , 12 , 55 };
do uble avg = A ve ra ge ( r ain fal ls , 0 ,
999 ) ;
Sy stem . C on sol e . W ri te Li ne ( avg ) ;
}
pu blic stati c dou bl e Ave ra ge (
do uble [] ar ray , d ou ble lowe rLi mit ,
do uble se nt in el ) {
// W ri te im p le me n ta ti o n here
}
}
/* B on us : Writ e unit te sts . */
Even though the changes between the Spring and
Autumn experiments were intended to be ever so sub-
tle, some notable consequences occurred. First, it ap-
peared that in the Autumn exam many students inter-
preted “stopping the iteration” as skipping the sentinel
value and then continued with counting the average.
Unfortunately, the resulting output produced with the
skipping method (26/5 = 5.2) was very close to the
desired result of the provided example unit test, which
is displayed in Listing 2.
Listing 2: Unit test provided in the Autumn 2015 exam.
INPUT dat a : { 3, 0, 7 , 6, 5, 99 , 5 }
lo we rLi mi t : 0 , u pp er Li mi t : 99
Towards Computer-based Exams in CS1
127

OU TPUT 5.25
This unintentional proximity of the two very dif-
ferent approaches clearly confused students, and as
many as 12% of the Group P students and 5% of the
Group C students, whose solutions were more or less
fine in other respects, eventually submitted their so-
lution using the skipping method. We looked for this
interpretation error in the Spring exam as well, and
found none, which suggests that the problem word-
ing was more exact in this case. Therefore, the im-
plementations of the Sentinel subgoal (see Table 2)
originated from other difficulties.
Second, it is possible to make an error with the di-
vision when operating with integers (Autumn exam)
that does not occur when handling floating point num-
bers or variables (Spring exam). Third, the consider-
ing of corner cases was generally encouraged in the
Autumn exam, but not in the Spring exam. Fourth, in
both exams, it was expected to use lower and upper
limits as parameters instead of constant zero or 999
in the function implementation. However, this gener-
alization was particularly instructed only in the Au-
tumn exam. Such ambiguities in the wording of the
problem and the subtle changes in the assignments are
taken into account for the analyses done in this study.
3.4 Assignment 1 Rework RF
(Voluntary Bonus)
In this phase, Group P students were offered the op-
portunity to rework on their Rainfall solution (see Fig-
ure 1). In the Autumn exam, students gained some
bonus marks from this phase contrary to the Spring
exam. Further, the wording of the Autumn exam in
general was reconsidered to make this part more at-
tractive to students. In the Spring exam, 31 of the
51 students (61%) submitted a solution in this phase,
while in the Autumn exam, 101 of 125 (81%) stu-
dents, respectively, did so. Regarding this study, if a
student did not submit a solution in this phase of As-
signment 1, his or her solution to the paper-based part
(possibly with some manual corrections made by the
researchers; see Section 3.6) was used as a solution.
3.5 Assignment 2: Rework With the
Test Suite
In this assignment, students were given a collection of
test cases. They copy-pasted their Assignment 1 so-
lution (or their Assignment 1 Rework solution, if they
had one), and checked if their code passed the tests in
the submission system. Then, students were allowed
to rework their code as much as they wished to satisfy
as many test cases as possible. After moving on to
this assignment, it was no longer possible to rework
on the previous assignment anymore. Again, minor
differences between the two experiments emerged. In
the Spring exam, only the first failed test was shown
to students, while in the Autumn exam, students were
additionally given the number of tests that they have
yet to pass.
3.6 Analysis Procedure
Two different types of analyses were made to reveal
the mode differences in students’ problem solving
process: a subgoal analysis and a test-based analysis.
Subgoal Analysis: Students’ solutions for Assign-
ment 1 and Assignment 2 (see 1) were manually
searched for errors in the source code according to
error categorization found in Lakanen et al. (2015).
After the error coding procedure, each error code was
associated with the acknowledged subgoals (or tasks),
as per the classification made by Fisler (2014) with
the addition of a Return plan. The subgoals were:
• Sentinel: Ignore inputs after the sentinel
• Negative: Ignore invalid inputs
• Sum: Sum the inputs
• Count: Count the inputs
• DivZero: Guard against division by zero
• Average: Compute the average
• Return: Return the average from the function
Further, each error code was classified as Incorrect
or Missing. Thus, if a student’s solution did not in-
clude, for example, any error codes suggesting Miss-
ing or Incorrect DivZero, then that particular sub-
goal was accomplished correctly. The programs were
coded by the head teaching assistant, who also graded
the answers.
Regarding the Sentinel subgoal, all values equal
to and above the sentinel should end summing. As
the value of the sentinel was a parameter, using a con-
stant value (such as 999) was counted as an incorrect
Sentinel plan. Respectively, omitting the parameter
value for the lower limit induced an incorrect Count
plan.
Since determining the correct and incorrect sub-
goals (and error codes) manually was highly demand-
ing in terms of workload, the subgoal analysis was
done for the Spring 2015 experiment, but it was not
repeated in the Autumn 2015 experiment. In the Au-
tumn exam the marking process was based on the sub-
goal schema with some emphasis on loop structure
comprehension.
Unit Test Analysis: Students’ solutions for Assign-
ments 1 and 2 were automatically analyzed with 32
CSEDU 2017 - 9th International Conference on Computer Supported Education
128

unit tests. The tests are presented in Appendix A.
The first 11 test cases were developed for the Spring
2015 final exam and given to students in Assignment
2. These eleven tests were designed to verify the basic
functionality and also reveal errors produced by omit-
ting the corner cases, such as DivZero. Further, they
were also used for marking Assignment 2. During the
assessment process and while conducting this study,
however, we found solutions that satisfied the origi-
nal 11 tests, and yet were flawed in some way based
on the marking. These solutions were then manually
inspected, and more tests emerged to observe errors
that were previously left unnoticed. Finally, after sev-
eral iterations, 21 more tests were discovered,
1
thus,
the total number of the tests of this “extended set” was
32.
The coverage of the tests was checked with ran-
domly generated tests. The random tests did not yield
any new failed tests for those solutions that passed all
of our tests. At the same time, the same random tests
were run on the solutions that passed the original 11
tests (given in the final exam), but did not pass the ex-
tended set of 32 tests; this resulted in the same group
of solutions that were discovered by our tests. Mu-
tation testing could have enhanced the validity of the
tests, but we chose to leave this for the future studies.
Manually Correcting the Solutions That Do Not
Compile: Only 22% (Spring) and 35% (Autumn) of
Group P succeeded in writing a compiling solution in
their paper-based submission. Comparing a solution
that does not compile (later, “not-compiling”) in As-
signment 1 to a compiling solution in Assignment 2
would yield biased results in terms of how much stu-
dents can improve their solution. Besides, it would
not reveal the underlying issues and also make it dif-
ficult to compare the test passing rates of Group P and
Group C. Therefore, for the purpose of this research,
the authors manually modified those submissions that
only required trivial or cosmetic changes to compile,
such as a missing semicolon, typing errors in variable
names, or minor scoping errors. Changes that resulted
in modifying the algorithm were not made. After the
manual corrections, the percentages of the compiling
solutions were 84% (Spring) and 90% (Autumn). Fur-
ther, some students did not submit a solution at all
to the computer-based part of Group P’s Assignment
1. For these students, the previously corrected paper-
based version was used at this stage.
Group C students’ not compiling solutions were
not corrected manually, but if the student did not sub-
mit a solution at all to the Assignment 2, his or her
1
Thus, all the 32 tests found different errors except the tests
T6 and T22, which appear to be redundant for the studied
students.
Assignment 1 solution was used for this study.
3.7 Trustworthiness of the Study
Regarding the subgoal analysis, only one researcher
coded all the solutions for the missing and incorrect
plans. Some students whose exam marks and error
coding seemed to be conflicting (for instance, good
marks, but “too many” error codes, or vice versa)
were checked, and possibly reanalyzed, by another
researcher. Overall, analyzing missing or incorrect
subgoals proved to be quite difficult. In the Au-
tumn exam, as we mentioned, the marking was based
roughly on the subgoal scheme, and even when the
marking was done by two different reviewers, there
were some differences. For instance, when one re-
viewer marked the DivZero subgoal fully correct for
65.1% students, another reviewer gave full marks for
59.7% of the students. Then again, for some other
subgoals, the difference in marks could be the other
way around. Regardless of these differences, in the
Autumn exam, marks added up quite uniformly for
each student between the two reviewers.
There were downsides as well to the unit test-
based analysis. First, it was possible to write a pro-
gram that passes the entire test suite by writing an
if block for each test input and fitting return clauses.
Obviously, this is not a correct solution. In this study,
this was not an issue since all solutions were investi-
gated manually. In the future, if using fully automated
assessment, using both randomly generated and pre-
pared tests would help in preventing these types of in-
correct solutions. Second, finding an optimal weight
coefficient for each test based on the test’s importance
relative to the course’s learning goals might highlight
the solutions’ characteristics more accurately. Fur-
ther, it could yield a more sensible marking scheme
since the Rainfall problem, at least our version of it,
consists of quite a few corner cases. In this study,
we hand-picked five tests that we believe are the most
valuable for the computing education community, and
we present these in Section 4.3.
4 RESULTS
4.1 Overall Performance
The marks from reviewing the student solutions are
given in Table 1. In both experiments, Group C was
marginally better on average, but the difference was
not statistically significant (independent samples t-
test; Spring: t = 0.309,d f = 106.8, p = 0.76; Au-
tumn: t = −0.638,d f = 242.8, p = 0.52). The Spring
Towards Computer-based Exams in CS1
129

exam showed lower percentages, because the overall
marks were based on the Assignment 1 answer, while
in the Autumn exam the marking was based on the
Assignment 2 answer. Even though the results were
not fully comparable between the two experiments, it
was easy to see that the differences between the two
study groups, Group P and Group C, were minimal.
Note, that the Group P marks in the Spring exam were
based on the paper-based answer, and yet there was a
surprisingly low difference between the two groups.
Both study groups were marked with same “mindset,”
in that the reviewers aimed to form an overall picture
of the students’ skills, and concentrate less on irrele-
vant spelling mistakes or minor blunders. In particu-
lar, Group C answers were not reviewed more strictly
just because they worked on a computer.
Table 1: Overall marks for the Rainfall problem.
Group P Group C Diff
Spring 63% (n = 51) 65% (n = 58) 1.5%
Autumn 71% (n = 125) 73% (n = 129) 2.3%
4.2 Subgoal Analysis
Table 2 presents the percentages of the missing and
incorrect subgoals for the Spring exam. The analy-
sis was only done for the Spring exam. There were
some differences worth noting between the Groups P
and C. First, Group P made more errors in DivZero
and Count subgoals than Group C did, but their per-
formance improved so that in Assignment 2 Group
P made less errors than Group C in these subgoals.
Also, Group P ended up with much less Sentinel
errors after the Assignment 2 phase.
When comparing the overall number of plan er-
rors committed (numbers for individual students are
not shown here due to space limitations), it seems that
there were no big differences between Group P and
Group C, which is in line with the marking results. In
Assignment 1, differences in marking were not sta-
tistically significant. However, looking at the pure
percentages in the Assignment 1 column, the Group
P has fewer errors in four out of seven subgoals, and
in the Assignment 2 column, the Group P has lower
error count in five out of seven subgoals.
4.3 Test Case Analysis
The test suite is displayed in Appendix A. We have
separated both experiments (Spring/Autumn) as well
as each group (Group P/Group C) with the experi-
ments.
Table 2: Subgoals and percentages of missing and incorrect
(M+I) plans in Assignment 1 (A1) and Assignment 2 (A2),
Spring 2015.
Subgoal A1
M+I %
A2
M+I %
Group P
(n=51)
DivZero 70.6 37.3
Neg 5.9 3.9
Sentinel 33.3 19.6
Count 54.9 35.3
Sum 27.5 19.6
Average 15.7 17.6
Return 13.7 9.8
Group C
(n=58)
DivZero 69.0 44.8
Neg 17.2 5.2
Sentinel 39.7 34.5
Count 44.8 39.7
Sum 37.9 17.2
Average 13.8 6.9
Return 15.5 10.3
4.3.1 It’s Better to Start with Pen and
Paper. . . or Maybe on a Computer!
Overall, Group P did better in the Spring experiment,
while the difference was nonexistent in the Autumn
experiment. In the Spring exam, the overall test pass
rates suggested that it was better for the students to
start the exam with pen and paper. On average, Group
P passed 5.7%-points more tests in the test suite com-
pared to Group C, gaining better results in 28 of the
32 test cases (sign test, p < 0.001). Also, the differ-
ences in individual tests were quite broad (difference
min = −14.9%-points in test T5; max = 4.9%-points
in test T25; negative result stands for Group P’s ad-
vantage, positive result Group C’s advantage). Fur-
ther, a slightly bigger proportion of Group P’s solu-
tions passed the test suite (11 test cases) given in the
exam (50.9% vs 46.5%). We conjectured that students
who started with pen and paper formed a more thor-
ough picture of the problem as they were not “dis-
tracted” by compiler errors, or other noise produced
by the IDE or the operating system. After forming
the initial solution, we assumed that the students had
better chances to know what to fix and how to fix it
with the help of the IDE and the test suite.
However, in the Autumn exam, this turned out not
to be the case, as both Group P and Group C got
practically identical test passing rates; Group C had a
slight advantage on average (0.4%-points better pass
rate) but the differences were very small (difference
min = −4.1%-points in test T5; max = 5.6%-points
in test T9; negative result stands for Group P’s ad-
CSEDU 2017 - 9th International Conference on Computer Supported Education
130

vantage, positive result Group C’s advantage) and the
“win rate” (Group P: 12, Group C: 20) was not sta-
tistically significant (sign test, p = 0.22). Further,
the proportion of solutions that passed all of the 11
tests given in the exam was practically equal for both
groups (Group P: 54.4%, Group C: 56.5%). Even
after a rigorous investigation, we were not able to
figure out a reason for the different behaviors be-
tween the Spring and Autumn experiments. Obvi-
ously, as the two course instances had different teach-
ers, there may have been some differences in teaching
emphases. However, despite lengthy discussions be-
tween the teachers, no clear causes were found.
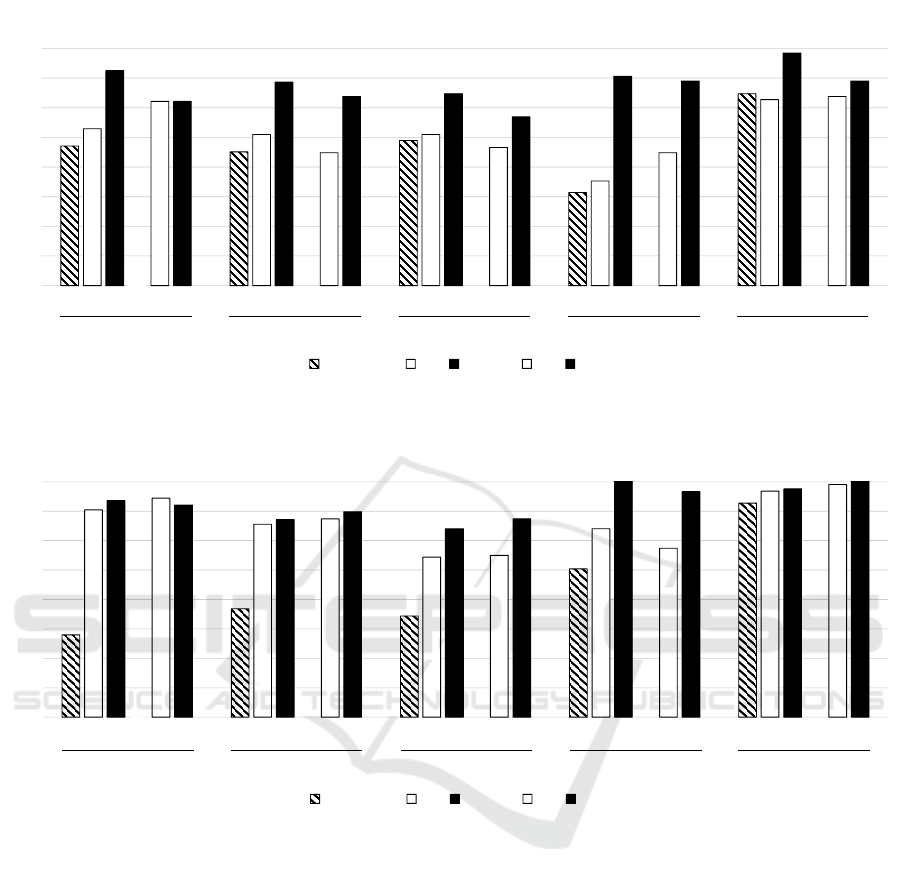
4.3.2 Solutions Get Better after Switching on to
the Computer
In an earlier Rainfall study by Lakanen et al. (2015),
it was hypothesized that if the students had the op-
portunity to write their code using the computer, they
would be less prone to certain errors. In Figures 2 and
3, the success rates for the selected five tests (tests T1,
T2, T3, T5, and T31), are displayed. These five tests
stress on the important features of the problem. Four
out of the five tests were presented to the students in
the exam, while the fifth test (T31) was a “regular”
average The purpose of these bar charts is to high-
light how each group (Group P, Group C) succeeded
in the process
2
of moving from Assignment 1 to As-
signment 2. The striped bar presents the test success
rate for the paper-based phase of Assignment 1. The
white bars in each column present the pass rates af-
ter finishing the computer-based part of Assignment
1, and the black bars in each group present the pass
rates after completing Assignment 2.
As anticipated, the solutions written on paper
pass the fewest number of tests almost in each
group. Then, the pass rates increased—with some
rare exceptions—while reworking the solution on the
computer and using the test suite. Note, that the two
white bars in each column represent a similar situa-
tion after Assignment 1 from the students’ point of
view, and are, therefore, comparable between Group
P and Group C. The black bars are correspondingly
comparable. The two experiments are separated due
to the previous disparity in test passing rates and some
changes in the study setup (see Section 3.2). Again,
that the computer-based phase for Assignment 1 was
better justified in the Autumn exam, which unavoid-
ably improved the passing rates in the Autumn exam.
Further, the figures only display an average increase
(or decrease), but not how many students improved
2
Note that percentages cannot be higher than the total num-
ber of compiling solutions for each group.
and how many “worsen” their solution. Under almost
every test there were students who had reworked their
solution so that it did not pass a test in A2 that it
passed in A1, which in most cases was because A2
specified that in the case of zero rainfall the lower
limit should be returned. In its worst, this was the
case for 25% of the students in the test T11. Yet, while
even more students succeeded in passing the test, the
total difference in passing rate remains positive.
It is also somewhat surprising that providing the
test suite produced only a moderate increase in the
success rate. On average, Group P solutions for As-
signment 2 (A2) passed 15.7%-points (Spring) and
4.8%-points (Autumn) more tests compared to the
computer-based phase of Assignment 1, A1c. Like-
wise, on average, Group C’s test passing rates for
A2 increased 10.0%-points (Spring) and 7.5%-points
compared to A1c. Thus, writing own tests produced
nearly as good solutions as the test suite provided by
the teachers.
Some of the potential increase was diminished by
the slight change in the assignment text: A1 did not
define the return value in the case of zero count in
rainfall days (i.e., empty array), and while exceptions
were not a central learning objective, many students
returned a constant zero in their solution, which was
an acceptable return value according to our test suite.
In earlier Rainfall empirical studies, not defining what
to do in this corner case seemed to be more of a rule
than an exception. However, in A2, students were
specifically instructed to return the value of the lower
limit parameter in this corner case, which was also
tested by our test suite. Still, many students did not
pay heed to this instruction, which resulted in a dete-
rioration of the test cases that were related to corner
cases, such as zero-day count.
4.3.3 Detailed Analysis of the Five Selected Tests
Next, we take a look at the five selected tests in more
detail. Test T1 was based on the example data pre-
sented in the Spring exam. Group P in the Spring
exam managed to pass many more tests than Group
P in the Autumn exam. This is explained, at least
partly, by the change in the type of data input, which
was changed from double array to int array. Thus, in
the Spring exam, it was a natural choice to sum the
input into a floating point variable. However, in the
Autumn exam, many summed the input into an int
variable, and made the division without casting the
variables (sum or count) into a floating point. As stu-
dents proceeded to the computer-based phase, this er-
ror was mostly noticed and corrected.
In tests T2 and T3, the lower and upper limits were
changed, so the students had to take into account the
Towards Computer-based Exams in CS1
131
0
10
20
30
40
50
60
70
80
%
Spring2015
A1(paper) A1 A2 A1 A2
Group P
T1
Group C Group P
T2
GroupC GroupP
T3
GroupC GroupP
T5
Group C Group P
T31
GroupC
Figure 2: Spring exam test success in selected tests.
0
10
20
30
40
50
60
70
80
%
Autumn2015
A1(paper) A1 A2 A1 A2
GroupP
T1
Group C GroupP
T2
GroupC GroupP
T3
GroupC GroupP
T5
GroupC Group P
T31
GroupC
Figure 3: Autumn exam test success in selected tests.
parameter values because the test did not pass if con-
stant values were used. Again, the possible integer
division error is visible in the Autumn Group P. Test
T5 was based on the corner case of an empty ar-
ray, where both the Autumn groups clearly beat the
Spring groups in Assignment 1. This was probably
due to the slight change in the wording of the Au-
tumn exam problem, where the considering of corner
cases was particularly encouraged. However, since
the way to deal with this particular corner case was
not specified, we assume that the Spring test-takers in
Group P might have suffered more on this occasion
(de Raadt, 2009). The big difference between white
(student’s own tests) and black (our test suite) bars in-
deed suggests that the students did not concider this
particular corner case.
Finally, test T31 was based on a regular average so
that the whole input array was within the given lim-
its. The output is also an integer, thus preventing the
int division error. The students performed well on
this test in both the Spring and Autumn exams. The
slight drop in Group P’s average score in the Spring
exam is explained by the fact that for a small num-
ber of students the manually corrected version (on the
paper-based phase; the manual corrections were made
by the authors) was “better” than the student’s own
solution in the computer-based phase. For example,
one student’s array.Count, which does not compile
in C# but is conceptually correct, was corrected by
the authors to array.Length. However, during the
computer-based phase, the student had “fixed” his so-
lution by replacing the abovementioned count with a
CSEDU 2017 - 9th International Conference on Computer Supported Education
132
constant 7 in that same position. Whether he was not
able to figure out the array Length property in the
IDE, or he was simply in a hurry to move on to the
other paper-based assignments, we do not know.
4.3.4 Challenges of the Test Suite Approach
We used ComTest to simplify student’s test writing
while producing de facto industry standard xUnit test
cases. We discovered that one challenge with the
xUnit-like test suite is that runtime errors print merely
the exception output without the input data. One of
such errors is IndexOutOfBounds, which is a com-
mon error while solving Rainfall (Lakanen et al.,
2015). We contemplate that if the examinee could see
the input that caused the test to fail, locating the is-
sue would be easier. This challenge occurs when the
source code for the tests is hidden, as in our case. In
the future, we will advance the test framework to pro-
vide better context-dependent error messages.
4.4 Number of Submissions
Within the given time frame, students could work on
their solution for as long as they liked and submit their
solution to the submission system. The system also
produced compilation outputs for the students. The
average number of submissions are given in Table 3.
Table 3: Average of student submissions to the online sys-
tem. A1c = Assignment 1, computer-based; A2 = Assign-
ment 2.
A1c A2
Group P
Spring 5.1 10.3
Autumn 11.5 5.4
Group C
Spring 10.3 6.0
Autumn 9.9 4.9
The number of solutions was not restricted by the
system, but we found that the maximum number of
submissions for a single student was 100. The low
number in the A1c column in the Spring rows high-
lights the difference in motivating students to submit a
solution in the computer-based phase of Assignment
1. Thus, the submission number is “moved” to As-
signment 2. The submission number must be treated
with caution, as students could work and compile
their solution in the IDE or in the online system. Both
these methods were used during the course. We did
not have a mechanism to count the number of compi-
lations in the IDE. On average, Group P students used
50 minutes on the computer-based phase of A1 after
transferring the pen-and-paper solution to a computer.
Likewise, Group C used 1 hour and 18 minutes on A1
from the start of the exam.
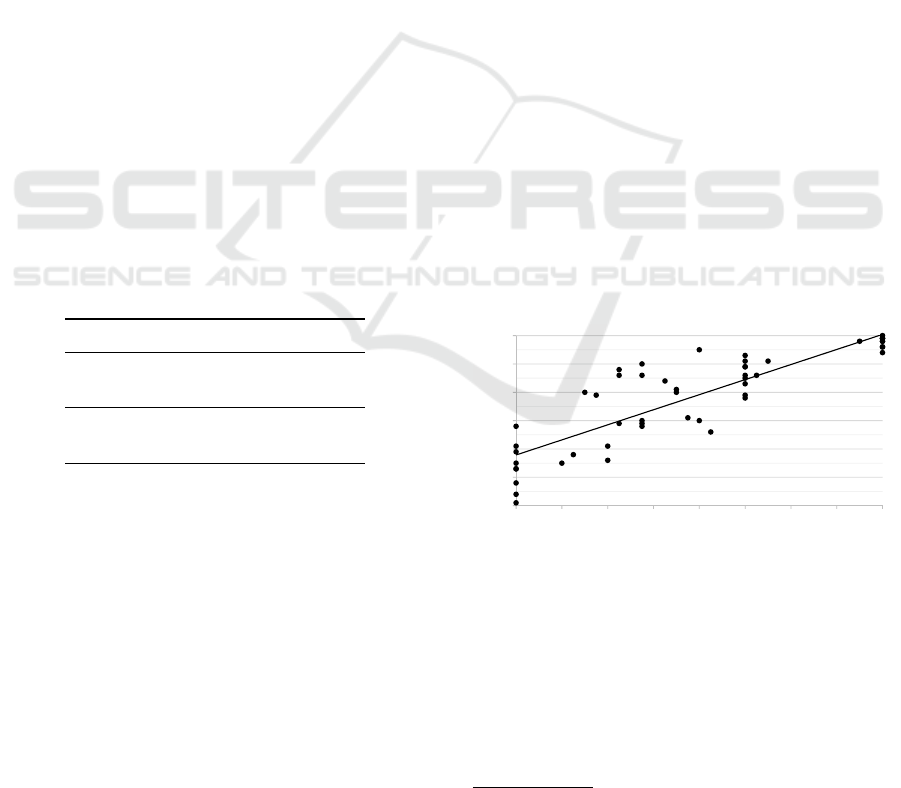
4.5 Human Assessment Vs. Automated
Assessment
In this subsection, we discuss how reliable automated
assessment (based on a test suite) is compared to man-
ual assessing. Figures 4 and 5 present the marks from
the manual assessment in Assignment 1 (paper-based
phase) as a function of the number of passed test
cases in Assignments 1 and 2, respectively
3
. First,
in Figure 4, the correlation is quite high (r = 0.865),
and the success rate in the given test explains 75%
(R
2
= 0.748) of the variation of the marks in Assign-
ment 1. The cluster in the 20 test boundary is ex-
plained by the DivZero error; if everything else was
fine but DivZero was committed, 12 test cases failed.
There are quite a few cases above the linear re-
gression line where the exam score is higher than the
“expected” number of passed tests. Overall, in the
midfield of Figure 4, where only a part of the tests
pass, the deviation in the human-given marks seems
the widest. This is natural, since an experienced re-
viewer can “sniff out” tinges of a correct answer even
when a test case would fail. Humans can more easily
distinguish between conceptual errors and typing er-
rors. Often times reviewers give (at least some) marks
for the correct train of thought, even though the stu-
dent did not express his or her thoughts entirely cor-
rect in the paper.
y=0,133x+1,7892
R²=0,7424
0
1
2
3
4
5
6
0 4 8 121620242832
MarksinAssigment1(paper)
TestspassedinAssignment1(paper)
Figure 4: The number of passed tests in Assignment 1 (auto-
matic assessment) compared to Assignment 1 marks (man-
ual assessment).
In Figure 5, many students have “glided” to the
right, meaning they passed more tests, resulting in a
higher correlation (r = 0.898) and, therefore, a higher
coefficient of determination for Assignment 2 (R
2
=
0.81). By placing more weight on some key tests and
less weight on some corner cases, the explanation rate
3
Note that both of these figures correspond to Group P of
the Spring exam.
Towards Computer-based Exams in CS1
133
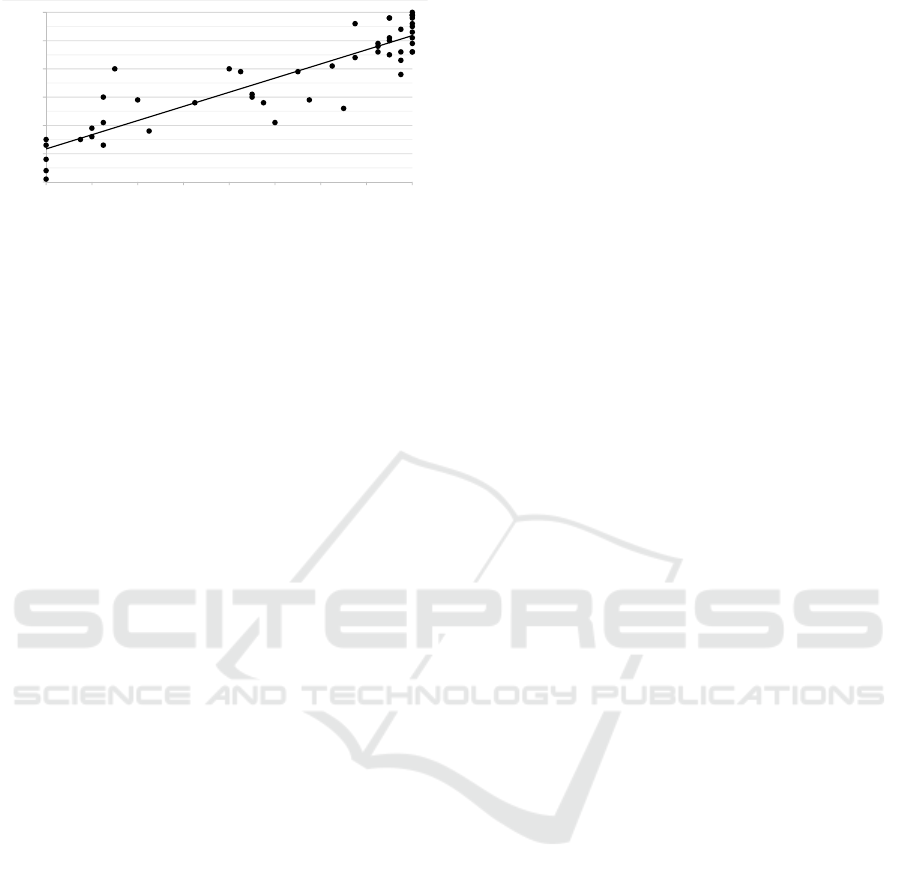
y=0,1253x+1,1689
R²=0,8049
0
1
2
3
4
5
6
0 4 8 12 16 20 24 28 32
MarksinAssigment1(paper)
TestspassedinAssignment2
Figure 5: The number of passed tests in Assignment 2 (auto-
matic assessment) compared to Assignment 1 marks (man-
ual assessment).
could be even higher. Here, we consider that the re-
viewer has successfully interpreted the student’s po-
tential in fixing the solution. A typical example in the
paper-based part is that a student muddles up compar-
ison operators <= and >=. Using a wrong operator,
even mistakenly, results in failing nearly all the tests.
However, this kind of a mistake is—presumably—
quickly noted and corrected by the student. There-
fore, while the reduction in human-given marks was
agreed to be minimal, the test-based assessment gives
nearly a zero score for an idea that is very close to cor-
rect. From this premise, an even higher correlation in
Figure 5 (r = 0.898) was anticipated.
Below the linear regression line in Figure 5, there
were some students who improved their A2 solutions
more than what would have been expected by the A1
(manual assessment) marks. While the underlying
reasons for this remained unresolved, one possible ex-
planation is that the switch between the paper-based
and the computer-based phases gave them a natural
break from the cognitive load. While physically mov-
ing from a classroom to another, they came up with
ideas that they did not think about before. Below
the regression line, there were also a handful of cases
where an incorrect, trivial solution, such as return
lowerlimit, passed many tests. Again, note that
there were many test cases that specifically pinpointed
different corner cases.
With regard to Group C, as well as both of the Au-
tumn groups, the marking was based on either the sit-
uation after the computer-based phase (A1c) or the
test suite phase (A2). Therefore, the correlation coef-
ficients cannot be directly compared to the ones pre-
sented above. However, by using selected weight co-
efficients, R
2
values ranging from 0.835 to 0.862 were
reached.
To summarize, the results of test-based automatic
assessment seems to be comparable to human-made
assessment with a reasonable reliability.
5 DISCUSSION
In this study, we inspected the differences of paper-
based and computer-based exams from several per-
spectives. First, in a relatively simple problem, such
as Rainfall in this study, it is hard to say which is bet-
ter for the student in terms of overall score or error-
tendency: a paper-based exam or a computer-based
exam. By a simple problem we mean that students can
be reasonably expected to work out a solution with-
out a debugger or advanced features of an IDE. Then,
when the assignment gets harder in that using debug-
ging tools or other features becomes a more natural
way of solving the problem, students can benefit more
from a computer-based exam. Our exam actually in-
cluded another assignment, that was a Rainfall-like
problem, but was a harder problem in general. Due to
the space limitations, we will report the full results of
this 2x2 crossover study in later studies, but as a gen-
eral observation, the group using the computer had
a clear advantage over the pen-and-paper group with
the average scores of 60% vs 39%. The difference
was statistically significant. It is interesting, though,
that the average score in A3 for the computer-users
was quite near to the Group C Rainfall average score,
which was 64%.
With regard to our second objective, we found,
as anticipated, that students produced less erroneous
code on a computer and with the help of an IDE when
compared to pen-and-paper code. Further, if we com-
pare the Groups P and C, there were not big differ-
ences in terms of passed tests that would have been
caused by the switch in the mode (from the paper-
based phase to the computer-based phase).
Third, it seems that with the Rainfall problem, au-
tomated assessment of computer-based exams gives
quite reliable results when compared to manual as-
sessment. However, this area clearly still needs more
research.
The opportunities for automated assessment
have fascinated scholars and researchers to arrange
computer-based exams in computing education. In
this study, we followed that direction. Even though
manual assessment brings out qualitatively different
nuances in student-written programs, interpreting the
programs can be tricky. In our exams, we used two re-
viewers for each assignments that required code writ-
ing, and different interpretations still existed despite
a fine-grained set of specifications for marking. In
CSEDU 2017 - 9th International Conference on Computer Supported Education
134

this regard, computer-based assessment should not
be abandoned only because the assessment result can
lead to a discourse; whether assessing students manu-
ally or automatically always leaves room for dissent-
ing opinions and interpretation. Working with com-
puters is also a working mode that is typically prac-
ticed throughout a CS1 course, thus a natural way to
complete the exam. Based on this study, we believe
that automated assessment could be comparable to
manual assessment from a score / marking perspec-
tive. An important challenge, is however, to figure
out a comprehensive and sufficient, yet appropriate
test suite that is based on the CS1 learning goals and
also the characteristics specific to the teaching con-
text. Earlier Rainfall studies as well as our own exper-
iments from several earlier course exams did greatly
help in generating the test suite that was utilized in
this study. How to generalize this into other types of
assignments as well, remains a future topic.
REFERENCES
Bodmann, S. M. and Robinson, D. H. (2004). Speed and
performance differences among Computer-Based and
Paper-Pencil tests. Journal of Educational Computing
Research, 31(1):51–60.
Carter, J., Mutka, K. A., Fuller, U., Dick, M., English, J.,
Fone, W., and Sheard, J. (2003). How shall we assess
this? SIGCSE Bull., 35(4):107–123.
de Raadt, M. (2009). Teaching Programming Strategies
Explicitly to Novice Programmers: Can the Way We
Teach Strategies Improve Novice Outcomes? VDM
Verlag, Saarbrücken, Germany, Germany.
Ebrahimi, A. (1994). Novice programmer errors: language
constructs and plan composition. International Jour-
nal of Human-Computer Studies, 41(4):457–480.
Fisler, K. (2014). The recurring rainfall problem. In Pro-
ceedings of the Tenth Annual Conference on Inter-
national Computing Education Research, ICER ’14,
pages 35–42, New York, NY, USA. ACM.
Grissom, S., Murphy, L., McCauley, R., and Fitzgerald, S.
(2016). Paper vs. computer-based exams: A study of
errors in recursive binary tree algorithms. In Proceed-
ings of the 47th ACM Technical Symposium on Com-
puting Science Education, SIGCSE ’16, pages 6–11,
New York, NY, USA. ACM.
Isom
¨
ott
¨
onen, V. and Lappalainen, V. (2012). CSI with
games and an emphasis on TDD and unit testing: pil-
ing a trend upon a trend. ACM Inroads, 3(3):62–68.
Lakanen, A. J., Lappalainen, V., and Isom
¨
ott
¨
onen, V.
(2015). Revisiting rainfall to explore exam questions
and performance on CS1. In Proceedings of the 15th
Koli Calling Conference on Computing Education Re-
search, Koli Calling ’15, pages 40–49, New York, NY,
USA. ACM.
Leeson, H. V. (2006). The mode effect: A literature re-
view of human and technological issues in computer-
ized testing. International Journal of Testing, 6(1):1–
24.
McDonald, A. S. (2002). The impact of individual dif-
ferences on the equivalence of computer-based and
paper-and-pencil educational assessments. Comput-
ers & Education, 39(3):299–312.
¨
Ozalp-Yaman, S. and C¸ agıltay, N. E. (2010). Paper-based
versus computer-based testing in engineering educa-
tion. In IEEE EDUCON Education Engineering.
IEEE.
Russell, M., Goldberg, A., and O’connor, K. (2003).
Computer-based testing and validity: a look back into
the future. Assessment in Education: Principles, Pol-
icy & Practice, 10(3):279–293.
Sepp
¨
al
¨
a, O., Ihantola, P., Isohanni, E., Sorva, J., and Vi-
havainen, A. (2015). Do we know how difficult the
rainfall problem is? In Proceedings of the 15th
Koli Calling Conference on Computing Education Re-
search, Koli Calling ’15, pages 87–96, New York, NY,
USA. ACM.
Simon (2013). Soloway’s rainfall problem has become
harder. In Learning and Teaching in Computing and
Engineering (LaTiCE), 2013, pages 130–135. IEEE.
Soloway, E. (1986). Learning to program= learning to con-
struct mechanisms and explanations. Communications
of the ACM, 29(9):850–858.
Venables, A., Tan, G., and Lister, R. (2009). A closer look
at tracing, explaining and code writing skills in the
novice programmer. In Proceedings of the Fifth Inter-
national Workshop on Computing Education Research
Workshop, ICER ’09, pages 117–128, New York, NY,
USA. ACM.
Towards Computer-based Exams in CS1
135

A TEST SUITE AND TEST PASSING RATES
Table 4: Test suite and passing rates for each test. All the numbers below Spring 2015 and Autumn 2015 columns are
percentages.
Spring 2015 Autumn 2015
Group P
(n=51)
Group C
(n=58)
Group P
(n=125)
Group C
(n=129)
Id Input (data, lower & upper limit) Output A1p A1c A2 A1c A2 A1p A1c A2 A1c A2
1 {12, 0, 42, 14, S, 12, 55}, 0, S 22.667 47 53 73 62 62 28 70 74 74 72
2 {12, 0, 42, 14, S, 12, 55}, 1, 42 12 45 51 69 45 64 37 66 67 67 70
3 {12, 0, 42, 14, S+1, 12, 55}, -1, 41 6 49 51 65 47 57 34 54 64 55 67
4 {12, 0, 42, 14, S, 12, 55}, 0, 0 0 41 45 80 36 66 46 57 75 50 76
5 {}, 0, S 0 31 35 71 47 69 50 64 81 57 77
6 {0, 10}, 0, S 10 51 55 71 53 60 56 74 74 72 75
7 {12, 5, 42, 14, S-1, 12, 55}, 0, S 34 65 65 76 64 69 73 78 78 78 80
8 {-1, -2, 0, 0, S}, 0, S 0 43 49 65 50 55 42 54 70 50 76
9 {-1, -2, S, 1}, 0, S 0 31 41 65 40 53 44 54 71 48 74
10 {12, 0, 42, 14, S, 12, 55}, S, 0 99 41 43 55 41 53 50 57 62 55 66
11 {12, 0, 42, 14, S, 12, 55}, 98, 0 98 43 47 55 40 53 50 58 62 54 66
12 {-5}, -5, S -5 37 41 49 47 50 50 57 62 56 60
13 {}, -10, S -10 31 35 49 47 53 50 64 54 57 56
14 {-1, 0, 1}, -10, S 0 61 57 65 64 64 72 71 70 67 67
15 {10}, -10, S 10 71 67 78 66 74 76 79 78 81 81
16 {1000, 2000}, -10, 3000 1500 63 57 76 57 67 67 75 74 73 76
17 {10, 1000, 2000}, 10, 3000 1500 39 43 63 43 57 44 62 64 60 64
18 {-10, -20, -30, -2}, -30, 3000 -10.667 41 45 61 45 59 22 50 58 50 56
19 {1, 2, 3, -2}, -2, 10 2 49 49 61 40 52 50 65 69 64 66
20 {1, 2, 3, 0}, -2, 10 1.5 61 57 75 57 67 32 60 68 61 69
21 {-5, -6 }, -5, S -5 29 35 43 41 47 43 52 60 49 57
22 {0, 2}, 0, S 2 51 55 71 53 60 56 74 74 72 75
23 {0, 2, 3, 4, 5}, 4, S 5 45 45 63 34 55 42 58 60 56 61
24 {S, 2, 3, 4, 5}, 4, S 4 39 45 49 43 48 50 61 59 50 60
25 {4, 5, 3, 4, 5}, 4, 5 4 43 47 45 43 50 47 54 60 49 58
26 {2, S+1, S+1}, 0, S 2 59 61 67 57 66 51 68 72 70 75
27 {-1, S, 2}, 0, S 0 39 47 69 48 55 54 61 74 52 74
28 {-1, 0, 0, 5}, -10, S 1 59 55 78 57 69 64 67 70 61 67
29 {1, 2, S,-1,-2, 2, 3, 1, S+1}, -2, S+1 15.286 39 43 65 47 59 17 54 61 53 57
30 {12, 0, 42, 14, S, 12, 55}, 0, S+1 39 45 51 71 52 62 50 72 73 66 69
31 {12, 14, 16}, 0, S 14 65 63 78 64 69 73 77 78 79 81
32 {3, 0, 7, 6, 5, S, 5}, 0, S 5.25 47 53 71 59 60 24 70 74 77 74
Notes: (i) S = Sentinel value. In the Spring 2015 experiment the value was 999, and in the Autumn 2015
experiment the value was 99. (ii) The Output column presents the values with the value 99 for Sentinel. (iii)
The floating point values in the Output column are rounded for the sake of readability. (iv) A1p = Assignment 1,
paper-based; A1c = Assignment 1, computer based.
CSEDU 2017 - 9th International Conference on Computer Supported Education
136
