
Geographical Information System Applications for Pipeline Right of
Way Aerial Surveillance
Sergiy Sadovnychiy
1
, Edgar A. Canul
1
, Juan M. López
1
, Andriy Sadovnychyy
2
and Marco A. Hernandez
1
1
Mexican Petroleum Institute, Eje Central Lazaro Cardenas Nte.152 Col. San Bartolo Atepehuacan,
07730, Mexico City, Mexico
2
Mexican Metropolitan Autonomous University, Cuajimalpa Campus, Av. Vasco de Quiroga 4871,
Col. Santa Fe Cuajimalpa, 05348, Mexico City, Mexico
Keywords: GIS, Infrared, Thermal Analysis, Oil, Gas, Pipeline, GPS, Inspection.
Abstract: This article deals with a Geographical Information System (GIS) module which complements a video-infrared
integrated application system for pipeline leakage detection inspection. This system is based on the theory
that under pressure, leakage can occur and part of the product goes from liquid to gas state. In the leaking
vicinity (over the land surface or in the waters) the temperature will change allowing appreciate a thermal
difference that can be registered by the video-infrared equipment resulting in thermal contrast over the land,
so that the infrared (IR) equipment can be used successfully for detecting and determining pollution due to
petroleum. Similar arguments follow for the gas case. The system is designed to receive data from various
electronic devices which operate in different frequency ranges. Data validation must be carried with suitable
formulas to get the best final yield. Three types of information sensors form the major part of equipment: an
infrared camera, a video camera and global positional system (GPS). Equipment, software and some
inspection results using this system are presented. Tests show that the flight conditions (120-140 km/h,
altitude of 400-500 m) are suitable for inspection services.
1 INTRODUCTION
Terrestrial oil and gas transport pipelines are exposed
to integrity loss due to physical (corrosion, erosion,
etc.) and human activities (digging, building, among
others) factors. Because of this, pipeline inspection
is fundamental to find anomalies and damage to take
the corresponding measures to fix them before they
reach a dangerous condition.
Product loss as liquid petroleum, gas or basic
petrochemicals can be a serious problem if no
appropriate methods are used to detect promptly leaks
in pipelines. During the operation processes such as
transportation, distribution and merchandising, they
can bring about drawbacks due to the product loss,
caused by inner corrosion, bumps to the installations
from thirds or underground terminals. Pollution is
one of the main effects that these phenomena can
cause, contamination to the water bodies, water
mantles, air quality disturbance and atmosphere
damage.
Traditional inspection methods present several
difficulties from inaccessible locations for pedestrian
inspection over the pipeline to little accurate pipeline
paths in aerial surveillance so that new technologies
are required, particularly for aerial inspection.
Technologies more accurate and reliable over the
detected incidents while inspection coverage is
increased, could be those of remote detection,
thermography, geographical information systems,
image processing and the like. They have allowed the
development of methods based on the anomaly’s
thermal trace such as leakage, excavations,
landslides, machinery function, exposed pipelines,
buildings, among others.
For better accuracy the above issues can be
identified in the thermal spectra using IR cameras and
GPS for positioning system.
The convergence of these technologies allows the
creation of sophisticated techniques and methods for
potential danger, leakage and illegal tapping on
transport pipelines.
26
Sadovnychiy, S., Canul, E., Lopez, J., Sadovnychyy, A. and Hernandez, M.
Geographical Information System Applications for Pipeline Right of Way Aerial Surveillance.
DOI: 10.5220/0006306700260034
In Proceedings of the 3rd International Conference on Geographical Information Systems Theory, Applications and Management (GISTAM 2017), pages 26-34
ISBN: 978-989-758-252-3
Copyright © 2017 by SCITEPRESS – Science and Technology Publications, Lda. All rights reserved
The inspection with aerial photography in the
visual band of frequency has been explained but to
detect the details related with failure of pipelines is
important to use the infrared image system in the
thermal band of the frequency. This system can detect
texture temperature with resolution near or better than
0.1 °K. It can generate the following information:
control of land texture above the pipeline; estimation
of soil erosion related with the subsurface layer
process; gas leakage locations in gas pipelines;
thermal mapping areas of the pipeline to be measured,
heat leakage information from subsurface layer.
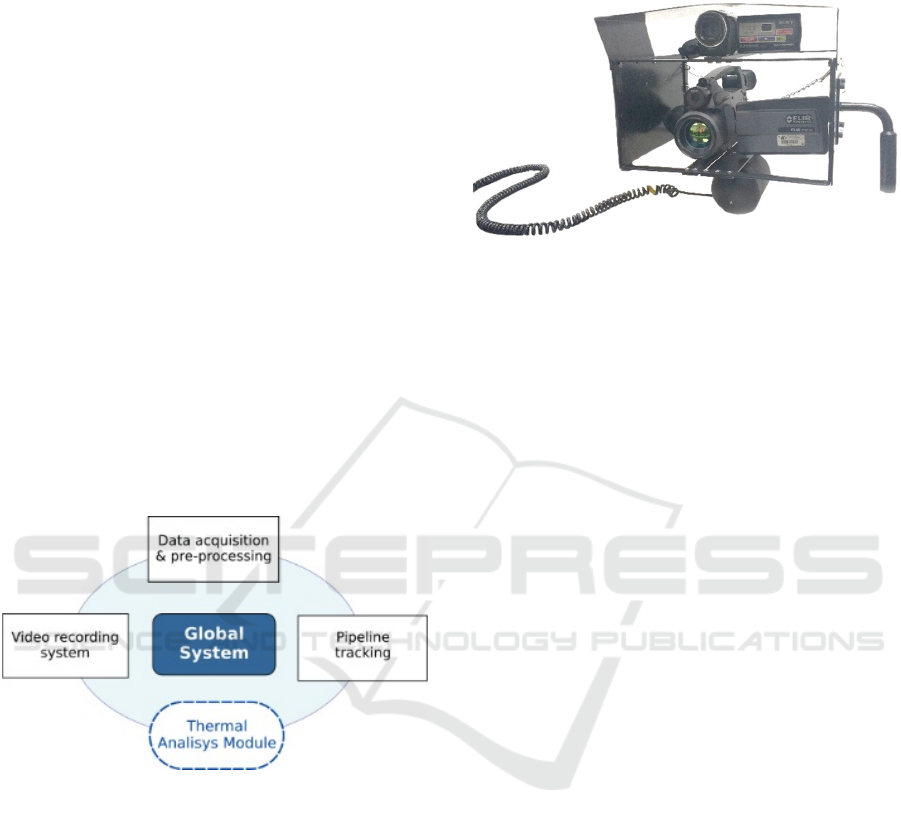
2 SYSTEM DESCRIPTION
Four basic modules conform the system: the operator
airborne equipment for recording the pipeline path in
infrared and video range, the airborne equipment of
data registration and pre-processing, the airborne
equipment for pipeline tracking and the in-office
equipment for analysis, evaluation and report
generation. Figure 1 shows the schema of the overall
System.
Figure 1: Application software for pipeline tracking.
2.1 Recording Video Equipment
A specific-purpose mechanical frame was designed to
mount two cameras, one for the high definition (HD)
and the other for the infrared (IR) video recordings.
The cameras must be oriented and adjusted in their
zoom parameters to make their scenes to match. In
addition to this a gyroscope is installed in order to
achieve a better stability control on the position when
recording. Figure 2 shows the details of this frame.
A fundamental component of the system is an
infrared camera (Sadovnychiy et al., 2004) which
detects the thermal anomalies that are caused by gas
and oil leakages.
There are three basic physical principles in which
the detection on the surface of temperature anomalies
caused by oil spills can be based. (Sadovnychiy,
2001)
Figure 2: IR and HD video cameras recording frame.
The first principle of temperature anomalies is
based on the supposed theory that according to Joule-
Thomson effect, the liquid that flow out under
pressure from a crack, is converted to a gas phase and
lowers temperature of the environment (surface over
the pipeline). Thus around the leaking place (over the
land surface or in the waters) the local sites will make
up with a least temperature, that can be registered by
the IR equipment. Visually such leaks are impossible
to be detected. A similar mechanism is presented in
the gas pipes.
The second principle. There is an IR camera that
can produce images at two bands: one in the
absorption band of ethane and the other were ethane
is nearly transparent.
The third principle is based on the phenomenon of
thermal contrast of superficial petroleum stains which
leaked from the pipeline. Temperature of petroleum
in the pipeline is usually close to temperature of
environmental ground. Hence, superficial
temperature of petroleum mass which outflowed from
the pipeline and which appeared on ground or water
surface is determined by conditions of its heat
exchange with the environment. The change of
temperature is influenced by parameters such as
wind, solar radiation, intensity of vaporization,
geometrical parameters of petroleum stain.
As shown in (Sadovnychiy, 2001), a difference of
temperatures T between a petroleum film (film
thickness h 0.1 mm) and water surface during
daylight hours can get to 0 5° K. For thick films
(film thickness h 0.1mm) this difference grows up
to 3 8° K. The reason of this temperature contrast is
that a petroleum film is heated up by the Sun radiation
more than the water, but it evaporates less.
If the petroleum get up to ground surface, the
temperature difference will be a little bit less at the
expense of vaporization of petroleum and therefore,
Geographical Information System Applications for Pipeline Right of Way Aerial Surveillance
27
at the expense of cooling the top layer of petroleum.
In this case, the difference of temperatures will be
greater (from -2 up to + 7 K).
The sensitivity of the camera is equal or less than
0.1 K and the three above mentioned principles of
leak appearance will form temperature anomalies
which have sufficient temperature contrast and
geometrical sizes for being detected by an IR camera.
The detected thermal anomalies are not always
associated with leakages since these can be generated
by means of the atmospheric thermal anomalies, there
could be false alarms. Therefore an HD camera is
used to compare with the infrared scene to have a
more precise knowledge about a specific anomaly.
2.2 Data Acquisition
The GPS receiver provides the position data to the
system. This additional equipment help the operator
to detect the site of the leakages accurately. The
received information is recorded into an electronic
memory of an on-board computer.
The principle of leakage detection is based on the
analysis of the thermal anomalies, processing of the
surface IR and video images and coordinate
determination. The co-processing of the mentioned
data permits to detect and locate pipeline leaks. The
high resolution of the system permits to detect
leakage at the time break itself.
A GPS device on board acquires the global
position of the system while performing the
inspection flight. The sampling rate is of two seconds
and the coordinates, speed, height and timestamp are
stored in the National Marine Electronics Association
(NMEA 0183) format to an on-board computer for
later analysis in search of anomalies. In figure 3, the
left PC record the IR camera video in .avi format.
GPS coordinates are also stored on this computer.
The GPS is a GPSMap76S Model. The GPS
performance is based on a receiver which
continuously tracks and uses up to 12 satellites to
compute and update the position. The update rate is
of 1 second. It has an accuracy in position < 15 m and
velocity < 0.05 m/s. Configuring the GPSMap76S to
use the interface as NMEA allowed to output the data
to a PC and use any NMEA compliant GPS
application on devices to use the GPS data feed from
the Garmin handheld. The baud rate is automatically
set to 4800 and cannot be changed so that the NMEA
transmitted data by serial connection is acquired
every 2 seconds.
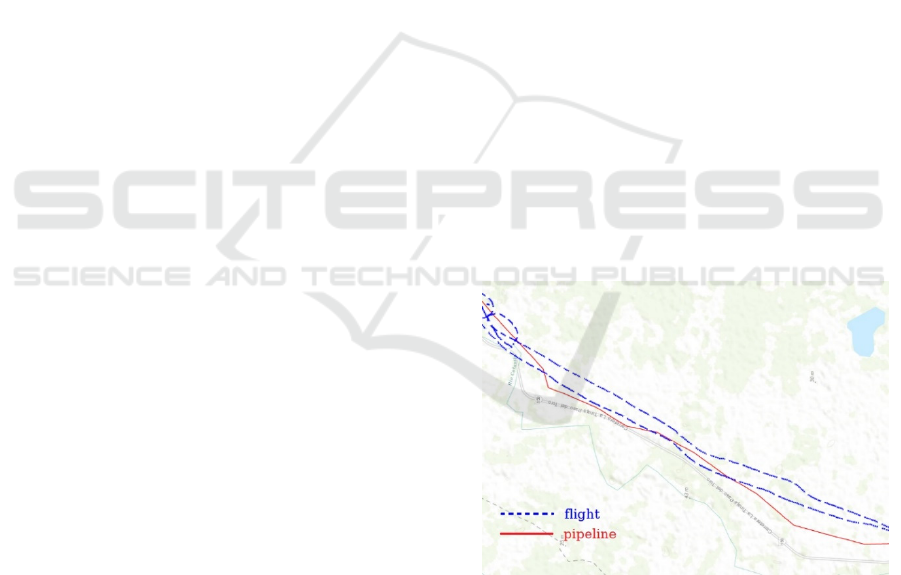
2.3 Pipeline Tracking
Oftentimes when performing the inspection flight the
pilot or personnel in charge don’t have the certainty
about the pipeline path, sometimes the terrain has
changed and the guide get confused or simply doesn’t
precisely remember the pipe trajectory. When this
occurs the flight path becomes erratic and repetitive
trying to find and follow the pipeline.
When such inspections take place the analysis and
evaluation phase becomes difficult to perform so, a
tracking module has been developed in order to get an
accurate tracking of the pipeline. This module is
composed by a GPS and an on-board computer,
which receives the position from the GPS and provide
it to an own-design software application which in turn
uses a geographical information system to display the
correct position respect to a preloaded pipeline path.
In this way, it is possible to have a better and almost
perfect pipeline tracking since now the reference
trajectory is completely known, even though the
person in charge doesn’t accurately know the path to
follow. An alarm algorithm is implemented in the
software application to warn when the helicopter is
getting to far from the path to track. A maximum
distance can be specified as an uncertainty tolerance
around the pipeline. Figures 3 and 4 show a flight
trajectory with and without the use of this tracking
module respectively. In the latter the average distance
to the pipeline was 150 m.
Figure 3: Inaccurate flight without pipeline tracking.
GISTAM 2017 - 3rd International Conference on Geographical Information Systems Theory, Applications and Management
28
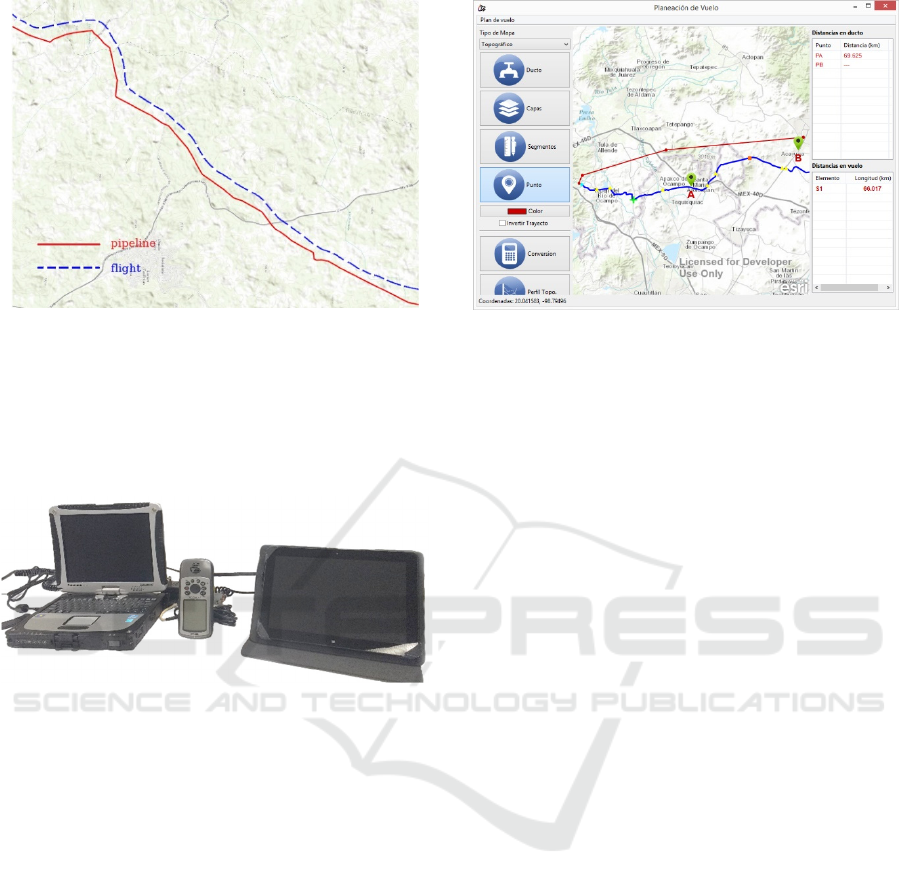
Figure 4: Flight with pipeline tracking.
In Figure 5 the tablet on the right performs the
pipeline tracking. It receives GPS coordinates
information and the tracking application software
updates the helicopter position against the pipeline
path.
Figure 5: Acquisition and tracking equipment.
There is also a flight-planning module based on
GIS that can be used to trace the flight plan over the
pipeline. With this module it is possible to load and
visualize the pipe trajectory, build the flight route,
perform geodesic length measurements to estimate
the time or velocity for the flight, query coordinates
elevation over the sea level to generate a topographic
profile of the pipe and with this establish a height
control of the helicopter or plane over the pipeline. It
counts also with complementary tools such as
individual and batch coordinates conversion between
NMEA format and WGS84 and Web Mercator
geographic references. It also has optimization
algorithms for the pipeline coordinates (when there
are repeated points or the geographic sequence is not
correct). Finally, the generation of compatible
formats of geographic features such as comma
separated values (csv), key-hole mark-up language
(kml), Esri Shape (shp) and GPS exchange format
(gpx) is possible. Figure 6 show the graphical user
interface of this module.
Figure 6: Flight planning module.
2.4 Thermal Analysis Module
Once the inspection flight has been completed it’s
necessary to analyse all collected information to
determine unusual temperature variations, conditions
which point to potential leakage or illegal tapping.
For the determination of variations on monitored
right of way (ROW) surface a special application
software has been designed. The core function of this
software consists on the comparison of IR and HD
terrain video images around the same instant time or
different time. For the same time mode,
synchronization of the above images with GPS
coordinates is required which in turn permits to know
the exact location to be displayed on the GIS
visualization.
The program was developed in Java 8 language
making use of the following APIs for the core
functions:
vlcj (Lee, 2015) and ffmpeg (FFmpeg, 2000) for
video recordings visualization and control, video
segments extraction, screenshots extraction,
image filtering adjustment and video recordings
information and parameter querying.
ArcGis (Esri, 2016) as geographical information
system (GIS) for visualization, distance
estimation and mark annotations on the pipeline
and flight paths.
Google Elevation (Google, 2016) for terrain
elevation queries to Google servers.
Eclipse SWT (Eclipse, 2016) for native operating
system graphical user interface.
JAK (Micromata Labs, 2016) and GeoKarambola
(Santos, 2016) for gpx and kml files parsing and
formatting.
OpenCV (OpenCV, 2016) for image manipulation
and temperature estimation.
Geographical Information System Applications for Pipeline Right of Way Aerial Surveillance
29
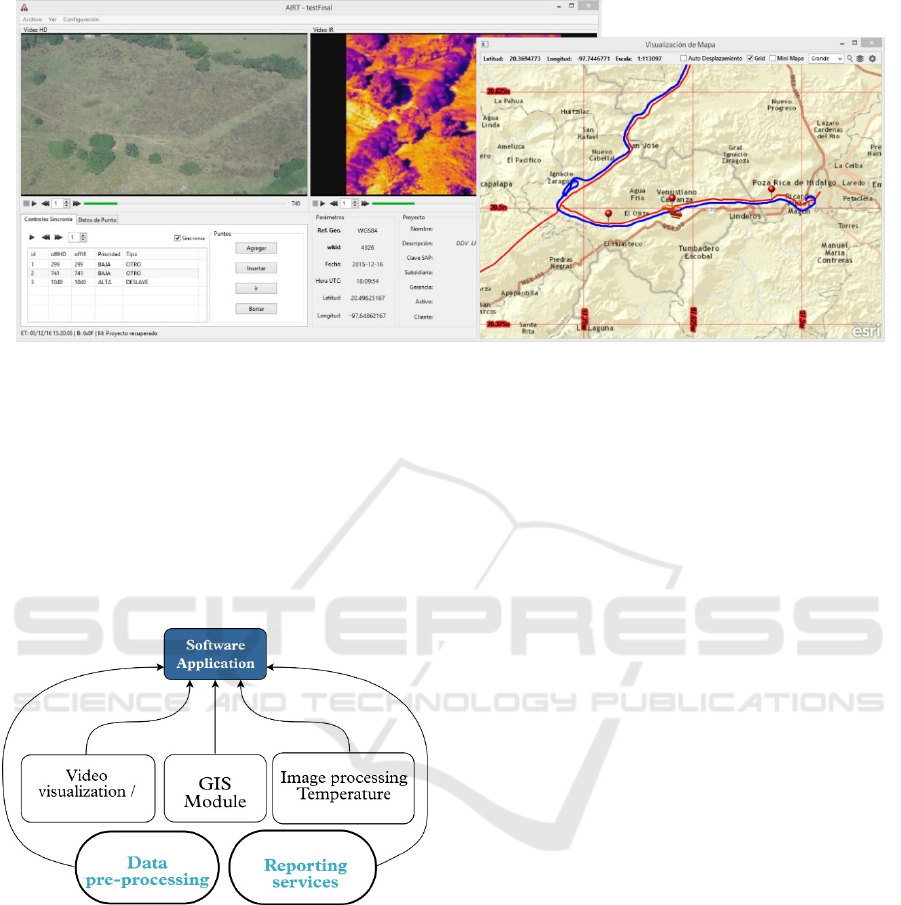
Figure 7: Thermal analysis application software.
JasperReports (TIBCO Software, 2016) for
reporting services.
The layout of data mapping windows and control
buttons are shown in Figure 7. The software
application counts with five core functional modules
(see Figure 8).
A pre-processing stage must be carried out on the
collected data (Sadovnychiy et al., 2004) for
compatibility and synchronization purposes.
Figure 8: Thermal application core modules.
The GPS route coordinates and timestamp have to
be bound to the simultaneous video films
reproduction in order to have accurate geographic
positions for each specific instant on the video
recordings. Such scheme of parameter registration
allows receiving identification of image location
every second. The information about coordinates that
are obtained from the GPS receiver is recorded in the
waypoint format. This format is practically supported
by any program of GPS navigation and control. The
designed special pre-processing module checks the
regularity of the database structure by a quantum of 1
second and, if it is necessary, completes the missing
data by means of interpolation.
For each GPS sampled and interpolated point
there is an elevation information request to Google’s
servers through its Google Elevation API. The
retrieved elevation is in meters over sea level. The
final dataset from the pre-processing module is
presented in comma separated values.
Video visualization control module is in charge of
simultaneous playing of HD and IR video recordings.
Videos reproduction has to be synchronized each
other and with GPS coordinates so that for every
instant, videos screenshots and position in map
match. Video format compression is not necessary for
the HD film since the video API’s can directly handle
the reproduction of the common .mp4 and .mts
formats and the storage demand can be conveniently
bounded to a 32 GB storage device.
The comparison of the images is carried out by the
operator through visual observation. If the operator
detects some anomaly on the pipeline right-of-way he
fixes the coordinates of this object in the report. All
main function modes of a video player are accessible
for work: rewind - forwards, pause, full screen output
etc. Video filters adjustment is also available for both
videos reproduction (Figure 9).
The GIS module loads the pipeline and flight
trajectories for the corresponding visualization. It also
receives timestamp and coordinates from the pre-
processing module every second of videos playing
thus, it can update a marker position according to a
video specific instant. It can get distances between
points and load several detail layers. The layer files
are QGIS and ArcGIS compatible. It is also possible
to generate .kml files for Google Earth compatibility.
Algorithms for pipelines length estimation and offsets
compensation have been implemented in order to
GISTAM 2017 - 3rd International Conference on Geographical Information Systems Theory, Applications and Management
30
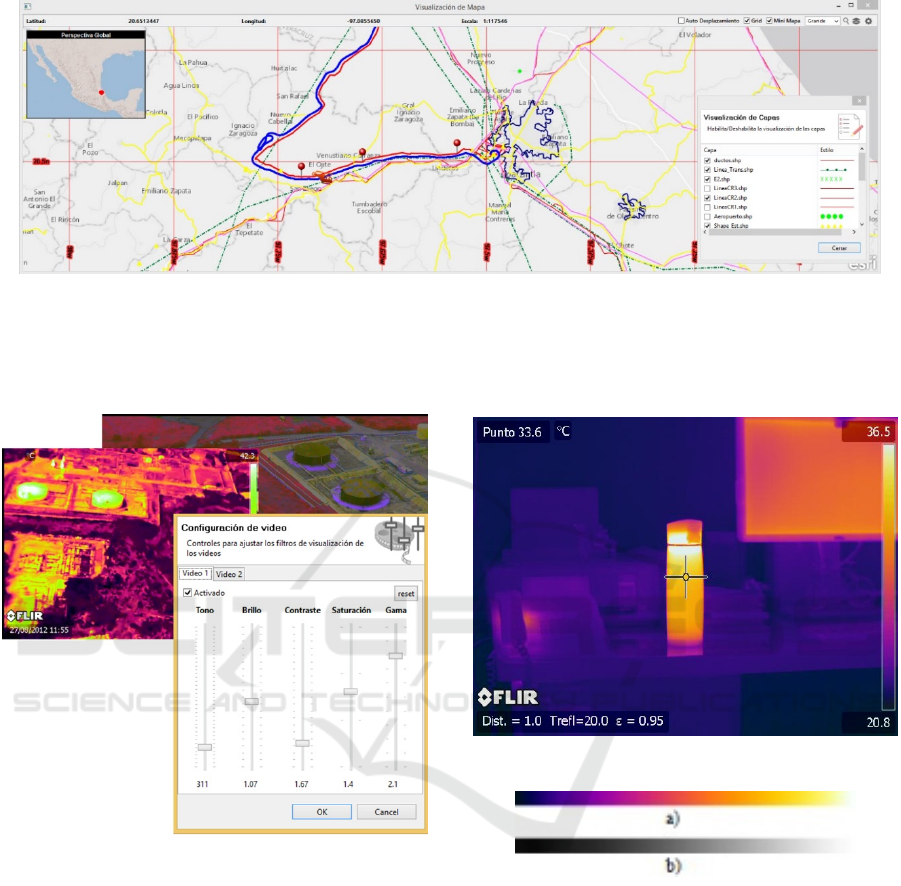
Figure 10: Graphical interface to the GIS module.
match the absolute distance of a reported point with
the nominal distances in the pipes. Figure 10 show the
graphical interface of this module.
Figure 9: Video filter adjustment.
2.5 Temperature Estimation
The employed IR camera can provide radiometric
information just on static images (IR photograph) but
not on video recording so that, thermal measurements
are not available therefore, temperature estimation is
needed in order to know the temperature of a pixel in
the image.
Since the only available image information for the
system are RGB images and temperature limits
(Figure 11) the above estimation has to be estimated
through linear interpolation among the pixel value
and temperature limits.
This step is easy when the used colour palette can
be converted into a linear grayscale palette such as
Iron palette, a very common palette in the
thermographic area. Figure 12 shows the iron palette
and its grayscale equivalent counterpart.
Figure 11: Temperature limits are known parameters.
Figure 12: a) Iron colour palette, b) Iron grayscale palette.
In this scenario, the RBG image is converted into
a grayscale image yielding in a one-value-per-pixel
image which together with temperature limits it is
possible to estimate a temperature value for each
pixel value. There are several conversion algorithms
if a more precise control channel ponderation is
required (Parker, 2011)
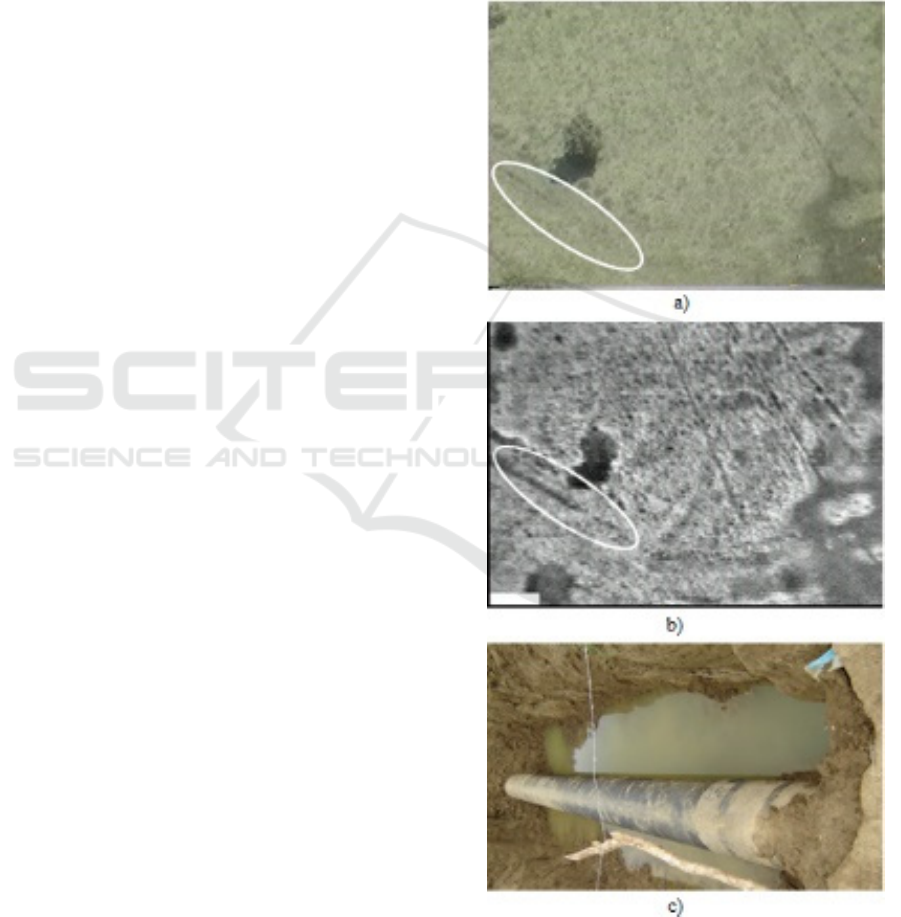
But, when the colour palette, such as Rainbow
palette doesn’t have a linear equivalent grayscale
(Figure 13) when converted, it’s not possible to apply
a direct linear interpolation estimation.
Geographical Information System Applications for Pipeline Right of Way Aerial Surveillance
31
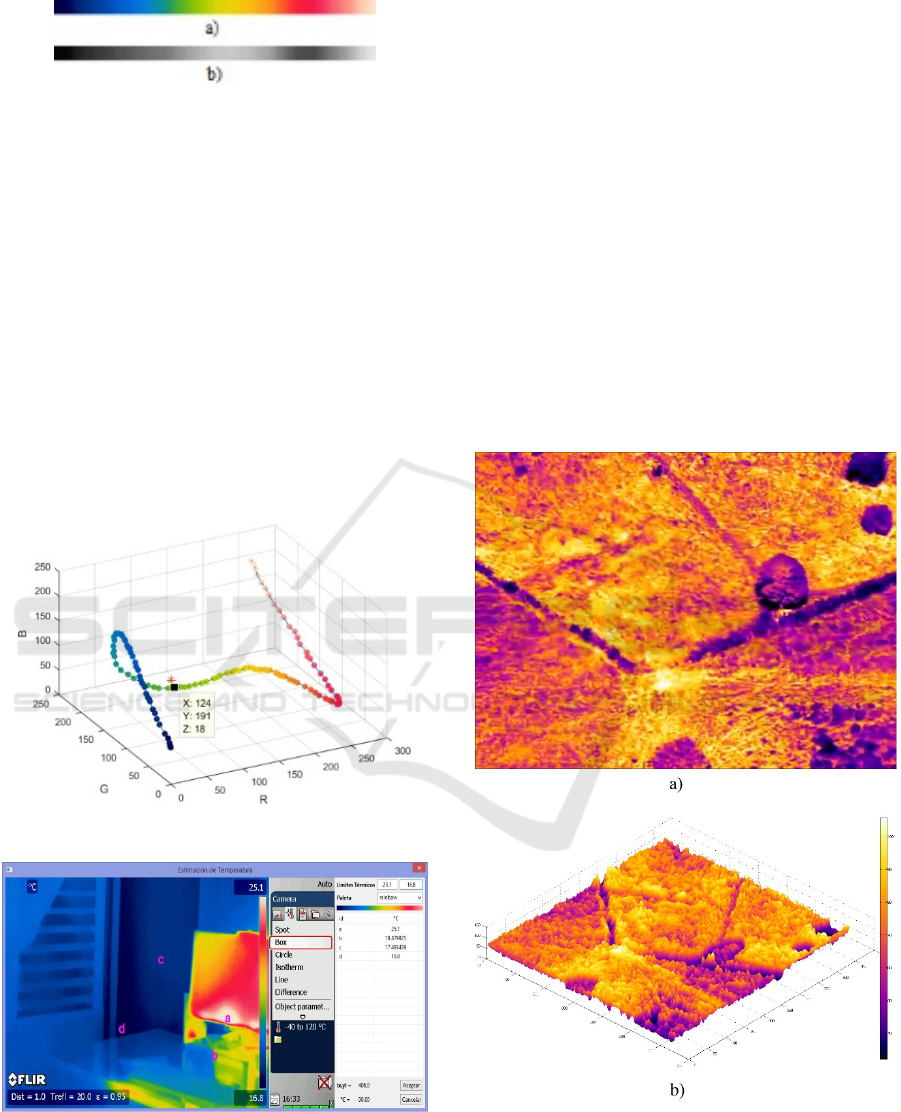
Figure 13: a) Rainbow colour palette b) Rainbow grayscale
palette.
Under this scenario there are three values per pixel
to estimate the temperature of such pixel. For this, an
estimation algorithm based on the minimum
Euclidean distance to the 3D palette trajectory in the
colour space (see Figure 14) was developed to
estimate the temperature for each pixel.
The above algorithm has proven to be effective
also with colour palettes whose grayscale equivalent
is linear such as Iron palette so, it can be used when
such an image conversion is to be avoided.
In Figure 15 the temperature estimation tool is
shown. Setting temperature limits is needed to
proceed with the estimation so that one must be
careful to set the IR camera parameters to show this
data.
Figure 14: 3D rainbow colour space.
Figure 15: Temperature estimation of an IR image.
A heat map is a 3D surface generated from the
thermal image where the height is represented by the
temperature estimated for each pixel (Raymond,
2015). Sometimes this visualization tool is necessary
to represent the IR screenshot image in order to have
an easy and more intuitive visualization. When used,
this resource allows to count with a 3D visual
representation which can be zoomed, translated and
rotated in a manner such that the user can have several
perspectives thus facilitating detection points which
otherwise couldn’t be appreciated. In Figure 16 it is
shown an IR screenshot and its corresponding heat
map respectively.
Any colour palette can be used for the 3D
visualization in Figure 16. The height parameter for
temperature can be inverted resulting in an inverted
relief. Heat map is showed in Tessellation/Surface
representation but can be wire framed or scatter
points.
All functions of the heat map tool can be reached
under Matlab, OpenGL or Point Cloud Data
implementation technologies, among others.
Figure 16: a) Screenshot of a thermal record specific instant
b) Heat map of the screenshot.
The overall application was developed and
executed on a workstation with Windows 8.1
Enterprise 64 bits OS and an Intel Xeon CPU E5-
GISTAM 2017 - 3rd International Conference on Geographical Information Systems Theory, Applications and Management
32
2650 @2.3 GHz processor with 32 GB RAM. The
most demanding power processor task has to be with
the simultaneous and synchronized video playing
(one of them is a High Density format), the
processing performance was tested with four High
Density simultaneous videos and the application was
executed very well. The actual requirements just
impose the simultaneous playing of a High Density
video and a normal video. The pre-processing and
report generation and persistence stages are not
concurrent operations.
2.6 Reporting
For each reported find during the inspection there
exists a generated data point with relevant
information such as the nature of the finding, the
priority, a detailed description, HD, IR and Map
screenshots, video fragments, timestamp, coordinates
and temperature estimation points. Every inspection
service is composed of several data points, 50 and
even more than 100 data points is possible. To
manage all the above information the reporting
services module was developed.
This module makes possible to organize and
accommodate the information of all the data points in
a visually attractive and understandable report to be
consulted by the interested parts.
This report is generated in html and pdf formats.
Comma separated values (csv) and .kml files of the
reported events are also generated in order to be
visualized as layers in any commercial GIS software.
3 TEST RESULTS
The system test was held on an aerial inspection of
the right of way (ROW). The flight was carried out
over an unknown (for the inspection team) region
above an obscure ROW. Only one condition was
required as initial information for the test: the
helicopter will fly above the pipeline route.
The data were recorded for the 100 km ROW
section. The speed of helicopter was about 120 km /
hour and altitude of flight was about 400 meters.
After data processing and analysis from surveyed
ROW route, 14 places with appearance of a pipeline
on a surface were detected. They were caused by
reasons such as: landslides, degradation by water,
excavation for maintenance functions, emersion of a
tube in marshland etc. Besides it were detected 9
thermal anomalies.
One month after aerial inspection the ground-level
check on 4 places (which ones had an opportunity of
access) with the brightest thermal abnormalities was
held. Availability of GPS coordinates and images of
anomalies permitted to find them very quickly.
Besides, in this period the operator had carried out
independent inspection of the same ROW section by
means of the special device working inside a tube -
intelligent "pig".
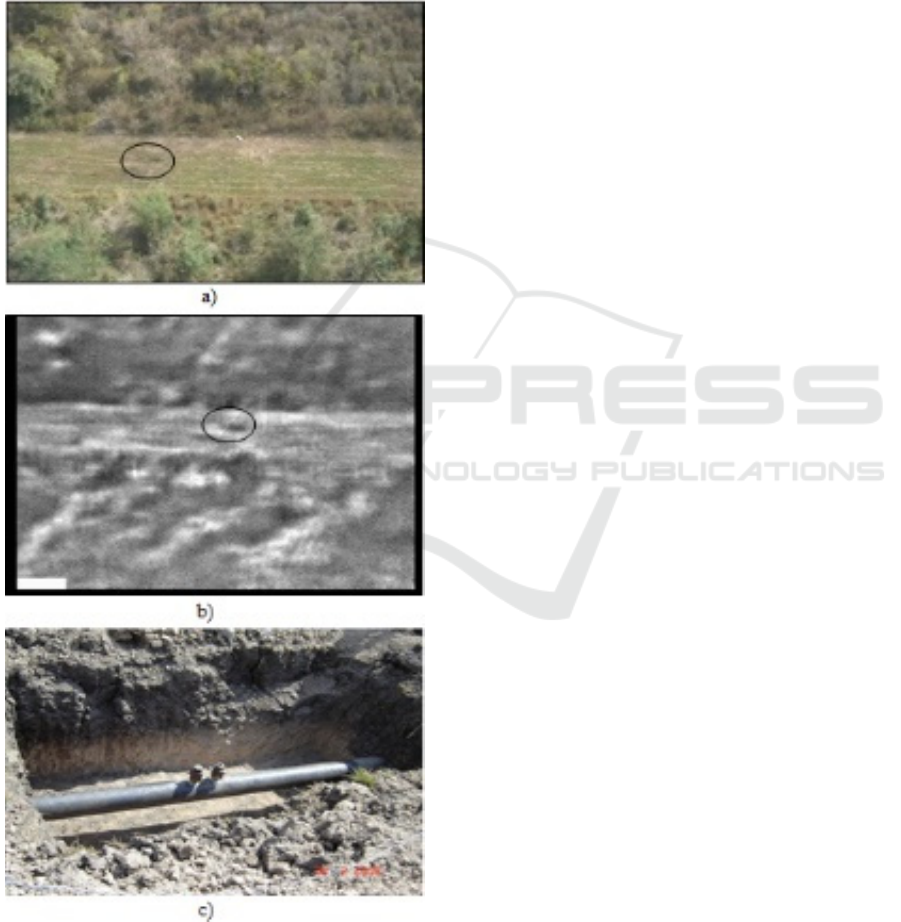
Figures 17 and 18 show two finds on pipeline
firstly detected by aerial inspection and subsequently
corroborated by means of intelligent “pig”.
Figure 17: Place that was determined as pipeline with
severe problems (loss of insulation covering) by means of
aerial inspection and intelligent "pig". a) HD screenshot b)
IR screenshot c) Verification photograph.
Geographical Information System Applications for Pipeline Right of Way Aerial Surveillance
33
4 CONCLUSIONS
The designed remote inspection system allows
fulfilling the monitoring of the oil and gas pipeline
right-of-way. The special software considerably
lightens the work of operator and raises the service
quality and integrity. The system allows to document
the inspection results and store important issues on a
database.
Figure 18: Place that was determined as pipeline with
severe problems (illegal tapping) by means of aerial
inspection and intelligent pig. a) HD Screenshot b) IR
Screenshot c) Verification photograph.
The importance of the GIS implemented modules
is foundational for the inspection system since several
functions rely on this characteristic which greatly
improves precision over location, visualization and
reporting on finds over the pipeline.
REFERENCES
Sadovnychiy, S., Ramírez, A., López, M. and Solís, N.,
2004. Pipeline leakage remote detection system.
Journal WSEAS Transactions on Systems. Issue 5, V. 3.
July 2004, pp. 1988-1992.
Sadovnychiy, S., Bulgakov, I. and Subramaniam, V., 2004.
Pipeline right-of-way remote inspection system.
Journal WSEAS Transactions on Circuits and Systems.
Issue 4, V. 3. June 2004, pp. 805-809.
Parker, J., 2011. Algorithms for Image Processing and
Computer Vision. Wiley. USA, 2
nd
edition.
Raymond, C. H. Lo, William, C. Y. Lo, 2015. OpenGL
Data Visualization Cookbook. Packt. UK.
Sergiy, Sadovnychiy, Tomas Ramirez, “Theoretical Base
for Pipeline Leakage Detection by Means of IR
Camera”, Proceed. of SPIE International Society for
Optical Engineering, Thermosense XXIII Conference-
2001, pp. 177 - 183. Orlando, FL, U.S.A., April 16-19,
2001.
Lee, M. 2015. Caprica Software Limited. [ONLINE]
Available at: http://capricasoftware.co.uk/#/. [Accessed
7 December 2016].
FFmpeg. 2000. FFmpeg.org. [ONLINE] Available at:
https://ffmpeg.org/. [Accessed 7 December 2016].
Esri. 2016. ArcGis for Developers. [ONLINE] Available at:
https://developers.arcgis.com/java/.
[Accessed 7 December 2016].
Google. 2016. Google Maps Elevation API. [ONLINE]
Available at:
https://developers.google.com/maps/documentation/elevati
on/intro?hl=es-419. [Accessed 7 December 2016].
Eclipse. 2016. Swt: The Standard Widget Toolkit.
[ONLINE] Available at: https://www.eclipse.org/swt/.
[Accessed 7 December 2016].
Micromata Labs. 2016. JAK - Java API for KML.
[ONLINE] Available at:
https://labs.micromata.de/projects/jak.html. [Accessed 7
December 2016].
Santos, A. 2016. GeoKarambola - Google+. [ONLINE]
Available at: https://plus.google.com/u/0/communities/
110606810455751902142. [Accessed 7 December
2016].
OpenCV. 2016. OpenCV. [ONLINE] Available at:
http://opencv.org/. [Accessed 7 December 2016].
TIBCO Software. 2016. Jasper Reports Library. [ONLINE]
Available at: http://community.jaspersoft.com/project/
jasperreports-library. [Accessed 7 December 2016].
GISTAM 2017 - 3rd International Conference on Geographical Information Systems Theory, Applications and Management
34
