
A Stochastic Approach for Optimizing Green Energy Consumption in
Distributed Clouds
Benjamin Camus
1
, Fanny Dufoss
´
e
2
and Anne-C
´
ecile Orgerie
3
1
Inria, IRISA, Rennes, France
2
Inria, CRIStAL, Lille, France
3
CNRS, IRISA, Rennes, France
Keywords:
Data Centers, Distributed Clouds, Energy Efficiency, Renewable Energy, Scheduling, On/off Techniques.
Abstract:
The energy drawn by Cloud data centers is reaching worrying levels, thus inciting providers to install on-site
green energy producers, such as photovoltaic panels. Considering distributed Clouds, workload managers need
to geographically allocate virtual machines according to the green production in order not to waste energy. In
this paper, we propose SAGITTA: a Stochastic Approach for Green consumption In disTributed daTA centers.
We show that compared to the optimal solution, SAGITTA consumes 4% more brown energy, and wastes only
3.14% of the available green energy, while a traditional round-robin solution consumes 14.4% more energy
overall than optimum, and wastes 28.83% of the available green energy.
1 INTRODUCTION
The rapid increase of demand for Internet services
leads Cloud providers to build more and more data
centers for hosting these services. The data cen-
ters that constitute the Cloud infrastructures are usu-
ally geographically distributed for security reasons or
to offer lower latency for their clients. This infras-
tructure increase comes with a dramatic growth of
the power consumption globally drawn by data cen-
ters. As an example, in 2014, data centers in the
U.S. consumed an estimated 70 billion kWh, repre-
senting about 1.8% of total U.S. electricity consump-
tion (Shehabi et al., 2016).
To reduce this impact, Cloud providers resort to
renewable energy sources which are either on-site or
off-site (Tripathi et al., 2016). Such energy sources
are mostly intermittent by nature (wind, sun, etc.)
with high variations, and periods of time without any
production (during night for instance for photovoltaic
panels). Energy storage devices can help to over-
come this issue. But, they constitute a costly invest-
ment and they intrinsically lose part of the energy
stored (Wang et al., 2012). Thus, without storage, re-
newable energy has to be consumed upon production
or it is wasted. In this context, optimizing renewable
energy consumption requires to know local availabil-
ity for the distributed cloud infrastructure, in order to
adequately allocate computing resources to incoming
user requests. The goal is to geographically distribute
the workload among the data centers so that, it fits at
best the on-site renewable energy production, which
is variable and not known in advance.
In this paper, we consider the problem of schedul-
ing workload across multiple data centers for min-
imizing renewable energy loss. To solve this is-
sue, we propose SAGITTA: a Stochastic Approach
for Green consumption In disTributed daTA centers.
SAGITTA uses a stochastic approach for estimating
renewable energy production, and a greedy heuris-
tic for allocating resources to the incoming user re-
quests. Our simulation-based results show the effi-
ciency of SAGITTA compared to classical allocation
approaches. Indeed, compared to the optimal solu-
tion, SAGITTA consumes 4% more energy overall,
and wastes only 3.14% of the available green en-
ergy, while a classical round-robin solution consumes
14.4% more energy overall than optimum, and wastes
28.83% of the available green energy.
The remainder of the paper is structured as fol-
lows. Related work is presented in Section 2. Sec-
tion 3 details the SAGITTA approach. A simulation-
based evaluation is conducted, simulation conditions
are described in Section 4 and results are provided in
Section 5. Future work is discussed in Section 6.
Camus, B., Dufossé, F. and Orgerie, A-C.
A Stochastic Approach for Optimizing Green Energy Consumption in Distributed Clouds.
DOI: 10.5220/0006306500470059
In Proceedings of the 6th International Conference on Smart Cities and Green ICT Systems (SMARTGREENS 2017), pages 47-59
ISBN: 978-989-758-241-7
Copyright © 2017 by SCITEPRESS – Science and Technology Publications, Lda. All rights reserved
47

2 RELATED WORK
Cloud infrastructures consist in geographically dis-
tributed data centers which are linked through com-
munication networks (Wang et al., 2008). With the
emergence of the Future Internet and the dawning of
new IT models such as cloud computing, the usage of
data centers, and consequently their power consump-
tion, increases dramatically. As an example, for 2010,
Google used 900,000 servers which consumed 1.9 bil-
lion kWh of electricity (Koomey, 2011). Other major
Cloud companies present similar figures and similar
issues (Katz, 2009).
Virtualization technology and its ability to pool re-
sources through transparent sharing should have min-
imized worldwide data center consumption. But, the
energy consumption of state-of-the-art servers grows
inexorably as they embed more and more powerful
cores and advanced features and technologies. Con-
sequently, the global data center consumption keeps
increasing rapidly (Shehabi et al., 2016). This situa-
tion raises major environmental, economic and social
concerns.
The first way to save energy at a data center level
consists in locating it close to where the electricity
is generated, hence minimizing transmission losses.
For example, Western North Carolina, USA, attracts
data centers with its low electricity prices due to abun-
dant capacity of coal and nuclear power following the
departure of the region’s textile and furniture manu-
facturing (Greenpeace, 2011). This region has three
super-size data centers from Google, Apple and Face-
book with respective power demands of 60 to 100
MW, 100 MW and 40 MW (Greenpeace, 2011).
Other companies opt for greener sources of en-
ergy. For example, Quincy (Washington, USA) sup-
plies electricity to data facilities from Yahoo, Mi-
crosoft, Dell and Amazon with its low-cost hydro-
electrics left behind following the shutting down of
the region’s aluminum industry (Greenpeace, 2011).
Several renewable energy sources like wind power,
solar energy, hydro-power, bio-energy, geothermal
power and marine power can be considered to power
up super-sized facilities.
In spite of these approaches, numerous data facil-
ities have already been built and cannot be moved.
Cloud infrastructures, on the other hand, can still take
advantage of multiple locations to use green sources
of energy with approaches such as follow-the-sun and
follow-the-wind (Figuerola et al., 2009). As sun and
wind provide renewable sources of energy whose ca-
pacity fluctuates over time, the rationale is to place
computing jobs on resources using renewable energy,
and migrate jobs as renewable energy becomes avail-
able on resources in other locations. However, the mi-
gration cost, in terms of both energy and performance,
may be prohibitive (Callau-Zori et al., 2016).
Within the data center itself, a range of tech-
nologies can be utilized to make cloud computing
infrastructures more energy efficient, including bet-
ter cooling technologies, temperature-aware schedul-
ing (Fan et al., 2007), Dynamic Voltage and Fre-
quency Scaling (DVFS) (Snowdon et al., 2005), and
resource virtualization (Talaber et al., 2009). The
use of Virtual Machines (Barham et al., 2003) brings
several benefits including environment and perfor-
mance isolation; improved resource utilization by en-
abling workload consolidation; and resource provi-
sioning on demand. Nevertheless, such technologies
should be analyzed and used carefully for actually
improving the energy-efficiency of computing infras-
tructures (Miyoshi et al., 2002).
Concerning green energy integration, Ren et al.
have proposed an online scheduling algorithm which
optimizes the energy cost and fairness among dif-
ferent data centers subject to queuing delay con-
straints (Ren et al., 2012). While their work is based
on a distributed Cloud model similar to ours, they aim
at minimizing the cost of the consumed electricity,
instead of the wasted renewable energy in our case.
Tripathi et al. have presented a mixed integer linear
programming formulation for capacity planning while
minimizing the total cost of ownership (Tripathi et al.,
2016). Their model schedules demand considering
the availability of green energy and its price variation
to lower the total cost of ownership. Finally, a liter-
ature review of renewable energy integration in data
centers can be found in (Deng et al., 2014).
3 SAGITTA
In this section, we present our approach named
SAGITTA: a Stochastic Approach for Green con-
sumption In disTributed daTA centers. First, the
Cloud model and assumptions are described in Sec-
tion 3.1. Then, Section 3.2 proposes the problem
formulation. The details for computing the expected
green and brown consumption are provided in Sec-
tion 3.3. Finally, SAGITTA’s algorithms are pre-
sented in Section 3.4.
3.1 Cloud Model
We consider a distributed Cloud infrastructure com-
prising several data centers geographically distributed
and powered by the regular electrical grid on one side
and on-site photovoltaic panels (PV) on the other side.
SMARTGREENS 2017 - 6th International Conference on Smart Cities and Green ICT Systems
48
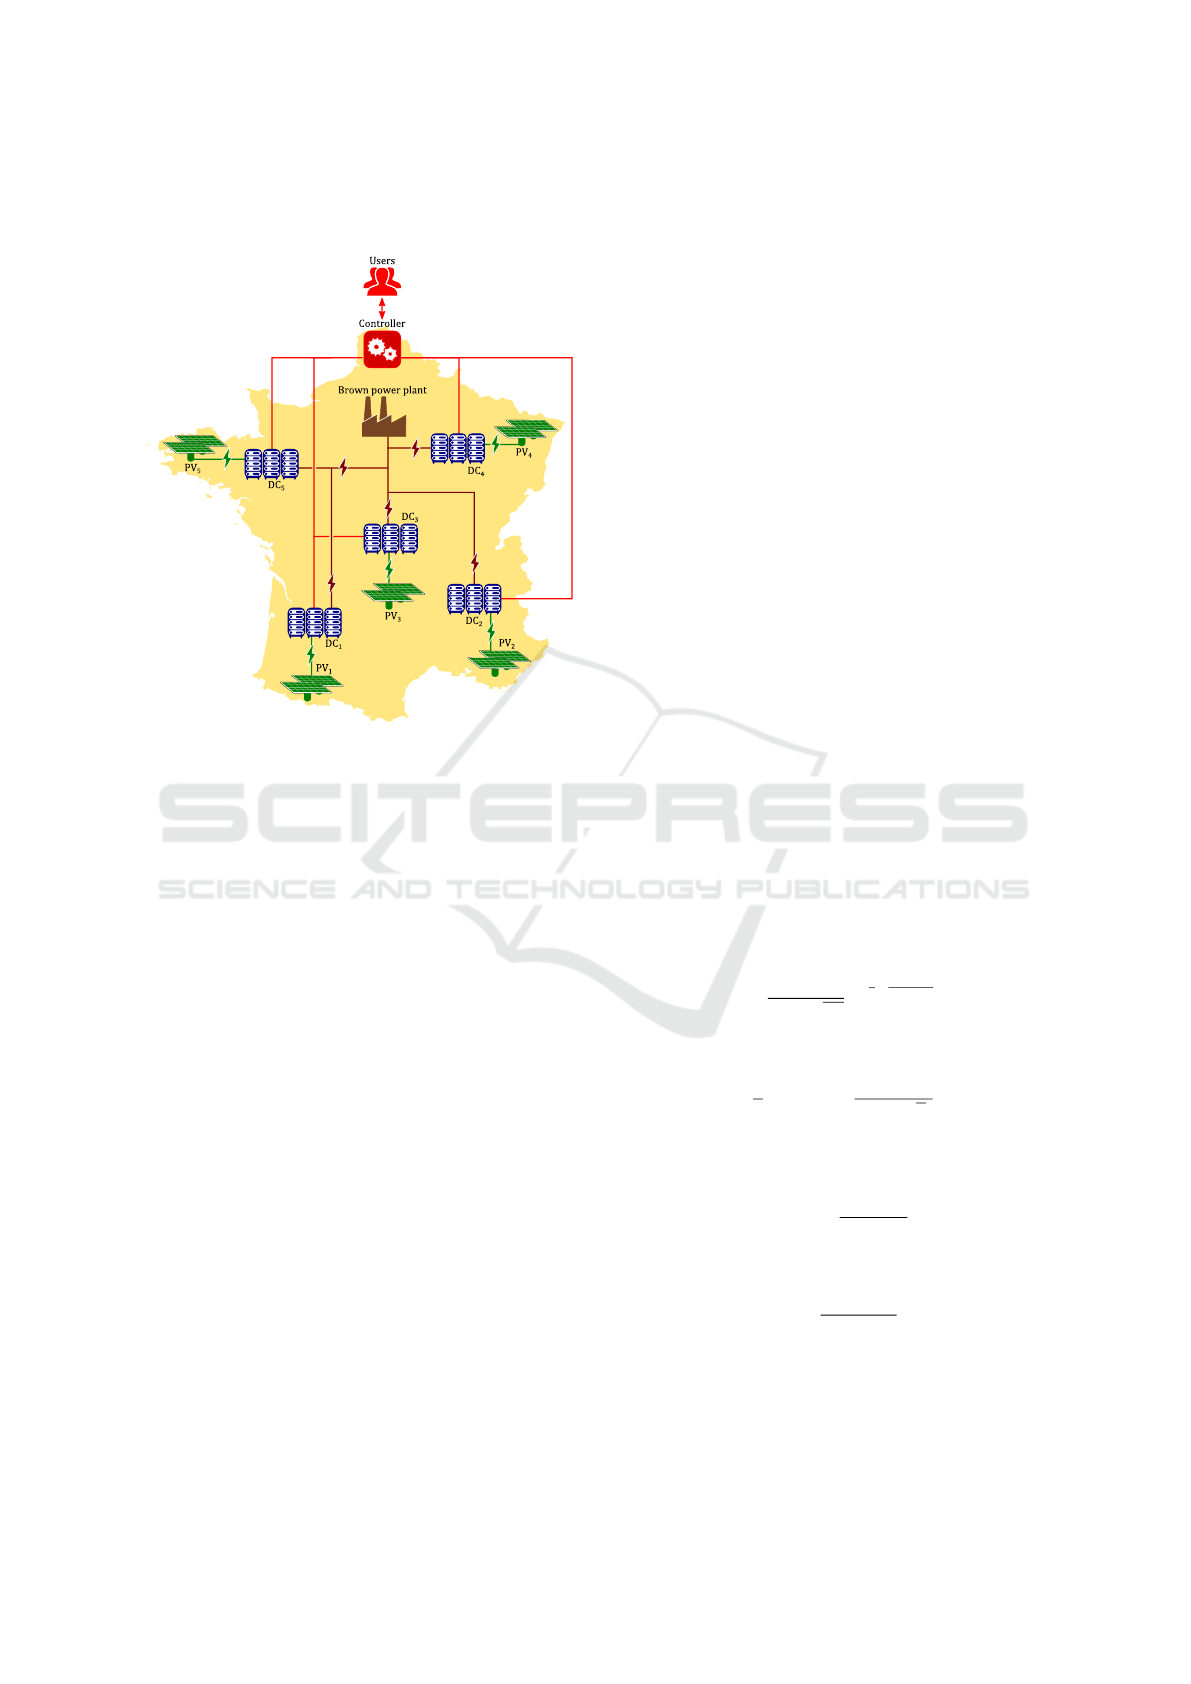
The user management of the Cloud is assumed to be
centralized. This Cloud model is shown on Figure 1.
Figure 1: Considered cloud model.
Incoming users requests can arrive at any time.
Each request requires to be computed by a virtual ma-
chine (VM) located on any of the data centers. Each
data center hosts a given amount of homogeneous
servers.
3.2 Problem Formulation
We consider a system of M data centers spread over
a large area. A data center DC
i
is characterized by
its number S
i
of servers. Servers are considered ho-
mogeneous over the different data centers, in term of
computing capabilities and energy consumption.
As for the application model, we consider identi-
cal VMs submitted at unpredictable rate. The VMs
are supposed to be executable in less than one time
slot. We can thus describe both computing and mem-
ory requirement of VMs by the number C of VMs that
a server can complete in a single time slot. We con-
sider that a server consumes at full capacity a power
of P
s
.
Finally, the energy consumption of a data center
DC
i
is proportional to its number of servers ON at
current time slot t, U
i
(t). The total power consumed
by the system is thus
M
∑
i=1
P
s
×U
i
(t).
This power requirement is to be compared with
the green power produced at each data center. We
model the green power available at time slot t in data
center DC
i
as a random variable G
i
(t) that follows
a truncated normal distribution of mean Eg
i
(t) and
standard deviation p
i
(t), with lower limit 0. Thus, the
brown power consumed at time slot t in DC
i
is equal
to
max(P
s
×U
i
(t) −G
i
(t), 0).
Our problem consists in allocating VMs to data
centers, in order to minimize the consumption of
brown energy. VMs are allocated by time slots. Then,
our objective is to turn ON the adequate number of
servers on the better locations for this criteria. We
denote N(t) the number of waiting VMs at time slot
t. We thus need to have enough servers ON for all
waiting VMs at time slot t:
M
∑
i=1
U
i
(t) ≥ N(t)/C.
All these notations are summarized in Table 1.
3.3 Expected Green and Brown
Consumption
We now evaluate the expected brown power consump-
tion of data center DC
i
at time t with n
S
servers ON,
Ec
i
(n
S
,t). We first evaluate the density function of
the random variable of the green power generation of
DC
i
at time t G
i
(t).
Let X be a random variable following a normal
distribution of parameters Eg
i
(t) and p
i
(t), density
function
φ(t) =
1
p
i
(t)
√
2π
e
−
1
2
t−Eg
i
(t )
p
i
(t )
2
and distributive function
Φ(t) =
1
2
1 + erf
t −Eg
i
(t)
p
i
(t)
√
2
.
Then, for x > 0,
P(G
i
(t) < x) = P(X < x|X > 0)
=
P(0<X<x)
P(X>0)
and the density function of G
i
(t) equals
φ
i
(t) =
φ(t)
P(X > 0)
.
Let B
i
(t) be the random variable of the brown con-
sumption of DC
i
at time slot t. For the sake of sim-
plicity, we denote P = n
S
×P
s
the power consumed by
DC
i
at time t. Then,
A Stochastic Approach for Optimizing Green Energy Consumption in Distributed Clouds
49
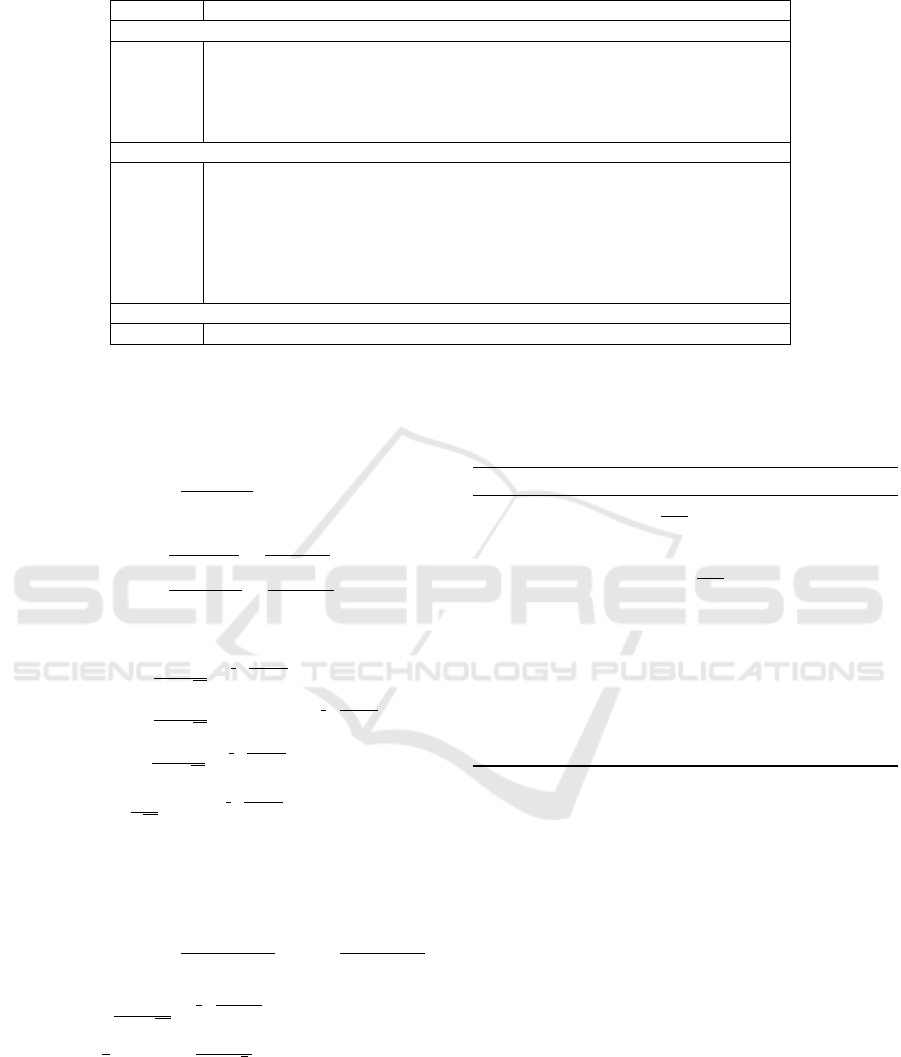
Table 1: Table of Notations.
Notation Definition
Constants
M Number of data centers
DC
i
Data center number i
S
i
Number of servers in data center i
C Maximum number of VMs in parallel on a server
P
s
Maximum power consumption of a server
Variables
N(t) Number of incoming VMs for time slot t (input)
U
i
(t) Number of machines ON at current time slot on data center i (output)
G
i
(t) Random variable of the green power produced at time slot t
Eg
i
(t) Expected green power generation at data center i during time slot t (input)
p
i
(t) Standard deviation of green power generation on data center i (input)
w Workload portion (number of VM): 0 < w ≤ N(t) (input)
Ec
i
(n
S
,t) Expected brown consumption of data center i with n
S
servers ON at time slot t
Parameters
Z Constraint for reallocation
Ec
i
(n
S
,t) = E(B
i
(t)|G
i
(t) ≥ P)P(G
i
(t) ≥ P)
+E(B
i
(t)|G
i
(t) < P)P(G
i
(t) < P)
= E(B
i
(t)|G
i
(t) < P) ×P(G
i
(t) < P)
=
P −
R
P
0
xφ
i
(x)dx
P(G
i
(t)<P)
×P(G
i
(t) < P)
= P ×P(G
i
(t) < P) −
R
P
0
xφ
i
(x)dx
= P ×
P(0<X<P)
P(X>0)
−
R
P
0
xφ(x)dx
P(X>0)
= P ×
Φ(P)−Φ(0)
1−Φ(0)
−
R
P
0
xφ(x)dx
P(X>0)
We now compute this integral:
R
P
0
xφ(x)dx =
R
P
0
x
p
i
(t)
√
2π
e
−
1
2
x−Eg
i
(t)
p
i
(t)
2
dx
=
R
P
0
1
p
i
(t)
√
2π
(x −Eg
i
(t))e
−
1
2
x−Eg
i
(t)
p
i
(t)
2
dx
+
R
P
0
Eg
i
(t)
p
i
(t)
√
2π
e
−
1
2
x−Eg
i
(t)
p
i
(t)
2
dx
=
p
i
(t)
√
2π
−
"
e
−
1
2
x−Eg
i
(t)
p
i
(t)
2
#
P
0
+Eg
i
(t)P(0 < X < P)
= p
i
(t)
2
(φ(0) −φ(P)) + Eg
i
(t)(Φ(P) −Φ(0))
Finally, we obtain:
Ec
i
(n
S
,t) = (P−Eg
i
(t))
Φ(P) −Φ(0)
1 −Φ(0)
−p
i
(t)
2
φ(0) −φ(P)
1 −Φ(0)
,
with φ(x) =
1
p
i
(t)
√
2π
e
−
1
2
x−Eg
i
(t )
p
i
(t )
2
, P = n
S
×P
s
and Φ(x) =
1
2
1 + erf
x−Eg
i
(t)
p
i
(t)
√
2
.
3.4 Algorithms Description
Our SAGITTA approach uses several algorithms to
take decisions and allocate VMs to physical servers.
These algorithms are designed to determine at any
time slot on which data center to turn ON and OFF
servers. At each time slot, our constraint is to turn
ON the minimum number of servers that allows for
executing all requested VMs, that is dN(t)/C e.
Algorithm 1: General algorithm.
if
∑
1≤i≤M
U
i
(t) < d
N(t)
C
e then
Switch on decision; (Algorithm 2)
else if
∑
1≤i≤M
U
i
(t) > d
N(t)
C
e then
Switch off decision; (Algorithm 3)
end if
Transfer decision; (Algorithm 4)
for 1 ≤ i ≤ M do
Let U
i
(t) servers on and fill them,
switch off the rest;
end for
The general algorithm (Algorithm 1) is designed
as follows. It first determines if the number of servers
available is under or over the requested number. If
there is not enough servers ON, Algorithm 2 de-
termines the location of servers to switch on. If
some servers are unnecessary, Algorithm 3 deter-
mines where servers should be shut down. These de-
cisions are done regarding the expected green energy
production in the different data centers. More pre-
cisely, Algorithm 2 compares the expected extra cost
in brown energy consumption c
i
induced by an addi-
tional server ON on any datacenters, and selects the
data center with minimum expected extra cost. The
variable U
i
(t) is then incremented, but the servers are
only switched on at end of Algorithm 1, when all de-
cisions are taken on any data centers. The same way,
Algorithm 3 selects one by one the servers to switch
OFF to maximize the expected gain.
Finally, Algorithm 4 evaluates if the brown power
SMARTGREENS 2017 - 6th International Conference on Smart Cities and Green ICT Systems
50

Algorithm 2: Switch on decision.
for 1 ≤ i ≤ M do
if U
i
(t) < S
i
then
Compute c
i
= Ec
i
(U
i
(t) + 1) −Ec
i
(U
i
(t));
else
c
i
= C ×P
s
+ 1;
end if
end for
while
∑
1≤i≤M
U
i
(t) < d
N(t)
C
e do
Find j such that c
j
= min
1≤i≤M
c
i
;
U
j
(t) + +;
Recompute c
j
;
end while
Algorithm 3: Switch off decision.
for 1 ≤ i ≤ M do
if U
i
(t) > 0 then
Compute g
i
= Ec
i
(U
i
(t)) −Ec
i
(U
i
(t) −1);
else
g
i
= −1;
end if
end for
while
∑
1≤i≤M
U
i
(t) > d
N(t)
C
e do
Find j such that g
j
= max
1≤i≤M
g
i
;
U
j
(t) −−;
Recompute g
j
;
end while
consumption could be reduced by transferring the
available processing power from one data center to
another. More precisely, the algorithm determines
some location where a fixed number of servers is
turned off, and a new location where the same num-
ber of servers is turned on. One server is selected for
switch OFF on the data center of maximum gain and
another one to switch ON on the data center of min-
imum cost, if the gain on the first data center exceed
the cost on the second one. However, an excessive
turnover of workload between data centers could de-
grade the quality of the proposed solution. To avoid
this, an additional criteria Z is added. Varying cases
for this criterion are tested in Section 5.3.
After running Algorithm 4, general Algorithm 1
applies all these decisions. The selected number of
servers are turned ON and OFF and all VMs are allo-
cated to available servers.
Algorithm 4: Transfer decision
for 1 ≤ i ≤ M do
Compute g
i
;
Compute c
i
;
end for
while Z and max
1≤i≤M
g
i
> min
1≤j≤M
c
j
do
Find k such that g
k
= max
1≤i≤M
g
i
;
Find l such that c
l
= min
1≤j≤M
c
j
;
U
k
(t) −−;
U
l
(t) + +;
Recompute g
k
;
Recompute c
l
;
end while
4 VALIDATION FRAMEWORK
We evaluate our algorithm through a modeling and
simulation (M&S) process. In the following, we first
give an overview of the whole cloud implementation
model (Section 4.1). We then detail our implemen-
tation of the data centers (Section 4.2), of the green
power production (Section 4.3), of the cloud work-
load (Section 4.4), of the algorithm implementation
(Section 4.5), and the different simulations performed
(Section 4.6).
4.1 Simulation Overview
The whole cloud implementation model is described
in Figure 2. We simulate data centers using the
DCSim (Data Center Simulator) discrete-event M&S
tool (Tighe et al., 2012). This simulator provides the
power consumption of each data center as a function
of time.
We implement our algorithm in an ad-hoc way
using the Java language into a simulated cloud con-
troller. This simulator receives as inputs the green
power production for each data center as well as the
cloud workload (i.e. the number of VMs to deploy on
the cloud for each time slot). Based on these inputs
and on SAGITTA’s algorithms, the controller gener-
ates for each server the VM allocation and the instruc-
tions which are directly sent to the simulated data cen-
ter manager.
Note that we do not explicitly model the brown
power production as we assume it to be infinite (at
the scale of the cloud). We also ignore the telecom-
munication network as we assume it to have negligi-
ble impact on the system functioning (we assume net-
work to be oversized for our scenario), and an almost
constant power consumption over time if no energy-
A Stochastic Approach for Optimizing Green Energy Consumption in Distributed Clouds
51
saving technique is applied (Orgerie et al., 2014). Fi-
nally, we do not take into account here the energy con-
sumed by the data centers’ cooling systems.
In order to perform the simulations, we connect
all these heterogeneous models using the MECSYCO
(Multi-agent Environment for Complex-SYstem-CO-
simulation) M&S platform (Camus et al., 2016a;
Camus et al., 2016b) which is based on the
DEVS (Discrete-EVent System specification) formal-
ism (Zeigler et al., 2000). We have defined a
DEVS interface for DCSim, and implemented it in
MECSYCO.
Figure 2: Bloc diagram view of the cloud model.
4.2 Data Center Simulation
Our cloud consists in five homogeneous data centers
composed of five clusters. Each of these clusters con-
tains 80 homogeneous nodes, so overall, the cloud
comprises a total of 400 servers. The characteristics
of each server are based on the Taurus servers of the
French experimental testbed Grid’5000
1
. These Tau-
rus servers are equipped with 2 Intel Xeon E5-2630
CPU with 6 cores each, 32GB memory, 598GB stor-
age and a 10 Gigabit Ethernet interface. In order to
determine the power consumption of each node, we
implement the power model of (Li et al., 2015), which
is based on real measurements made on Taurus nodes.
These measurements notably state that a Taurus server
consumes 8W when powered OFF, 97W when idle,
and 220W at 100% CPU load (i.e. P
s
= 220W for our
algorithm).
Within this cloud, we deploy homogeneous VMs
that are equivalent to the Amazon EC2 ”large” flavor
2
- i.e. each VM requires 4 CPU cores, 8GB memory
and 80GB storage. Hence, three VMs can be simul-
taneously running on one node. For the sake of sim-
plicity, we assume that, when deployed, a VM always
1
https://www.grid5000.fr
2
https://aws.amazon.com/ec2/
works at full capacity. In the same way, we neglect
the delays for the VM to start/stop. All the VMs are
automatically deleted at the end of each time slot. A
time slot lasts five minutes in our simulations.
4.3 Green Power Production
In order to feed the controller during the simulation,
we use real recordings of green power production and
real workload traces. We get the former from the Pho-
tovolta project
3
of the University of Nantes. These
recordings correspond to the power produced by a sin-
gle Sanyo HIP-240-HDE4 photovoltaic panel updated
every five minutes over one week. In order to have
heterogeneous trajectories between data centers (and
thus to represent solar irradiance differences between
sites spread across a country), we select recordings
starting at different dates, namely: 4th of September
2016, 2nd of February 2014, 8th of June 2014, 22nd
of June 2015 and 21st of December 2014. We con-
sider here that 30 photovoltaic panels (for a surface of
165.6m
2
) are installed at each data center. Then we
scale these photovoltaic signals accordingly.
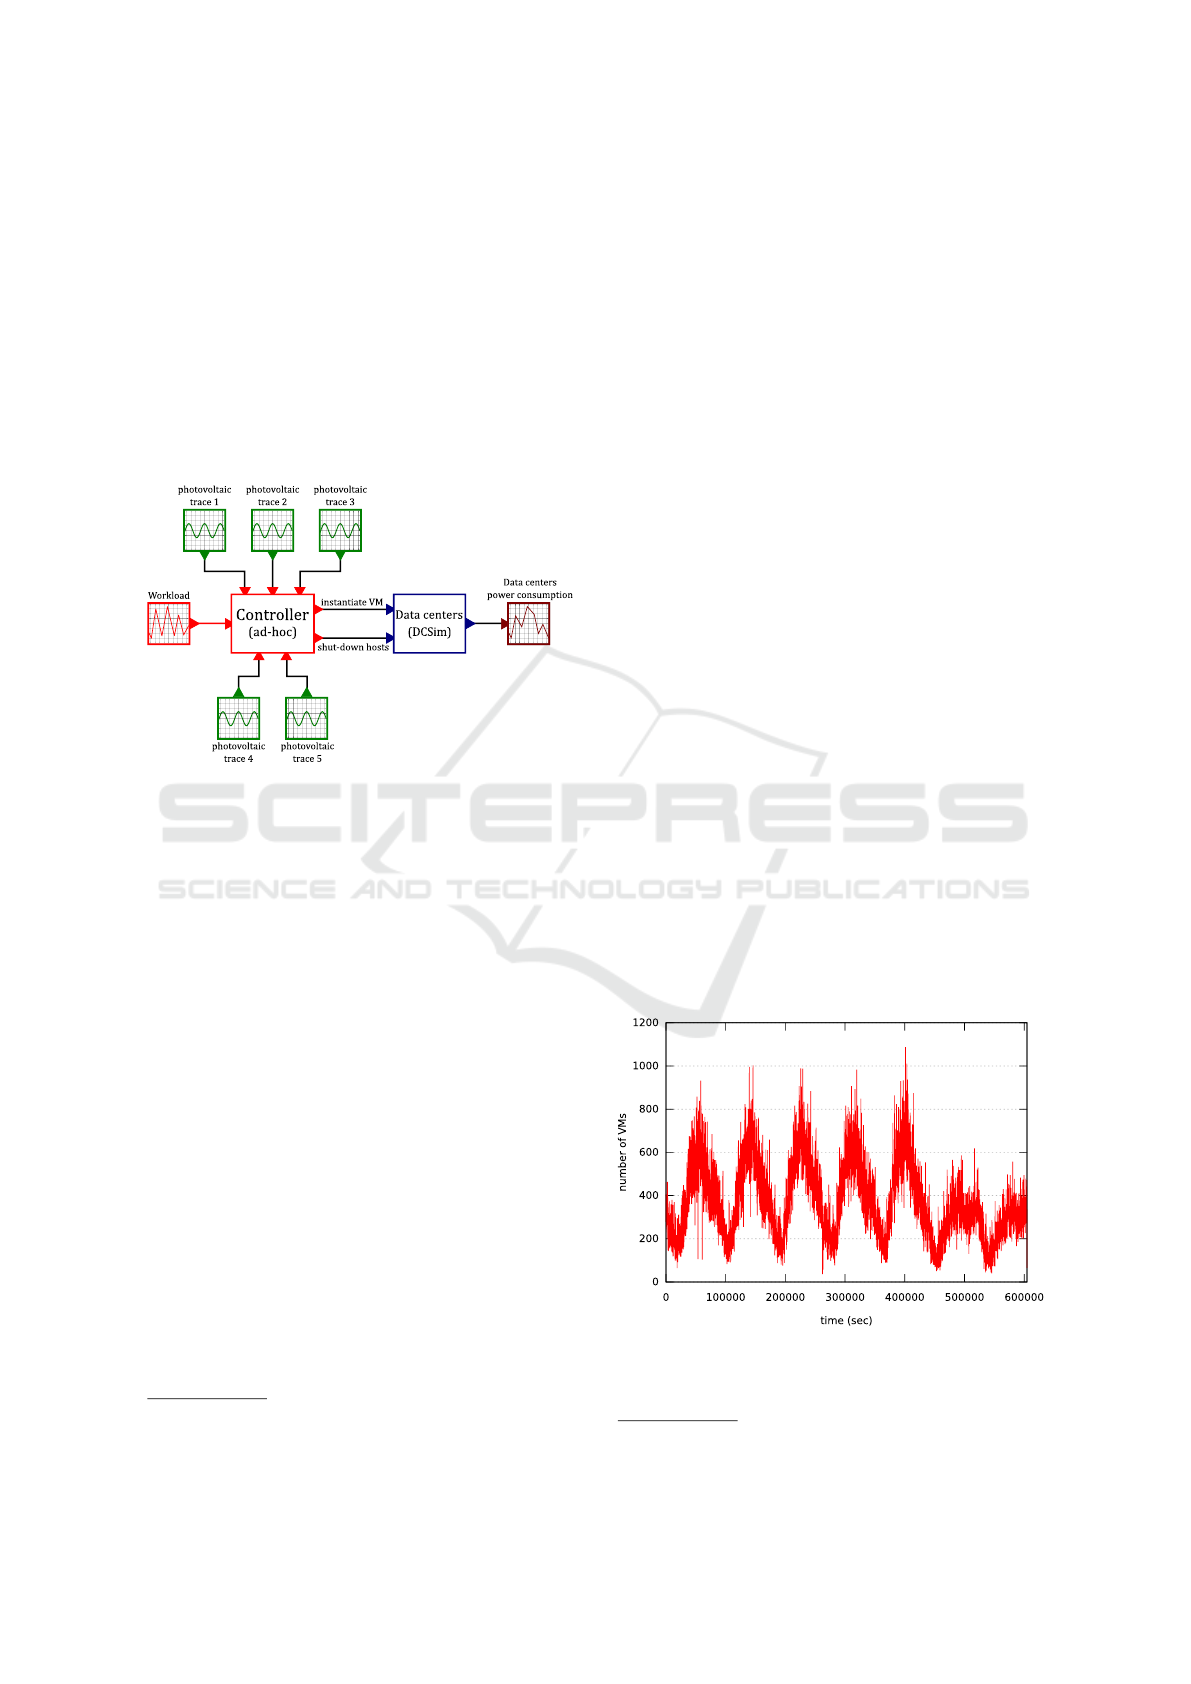
4.4 Workload Input
We use the normalized ClarkNet HTTP trace
of (Tighe et al., 2012) for our cloud workload, shown
in Figure 3. This workload trace spans over one
week. We scale this workload to 98% of the cloud
total capacity (i.e. the maximal workload peak rep-
resents 98% of the total computing capacity of the
cloud). The trace peaks are synchronized with the
photovoltaic signal ones to have proper day-night cy-
cles in our simulation.
Figure 3: The input workload used in the experiments.
3
http://photovolta2.univ-nantes.fr
SMARTGREENS 2017 - 6th International Conference on Smart Cities and Green ICT Systems
52
4.5 Algorithm Implementation
The controller implementing our SAGITTA approach
is run at each time slot (i.e. each five minutes).
It saves all the data received from the green power
sources during the current day. The controller com-
putes at each time slot the standard deviations p
i
(t)
using this history. It computes each expected green
power production Eg
i
(t) by averaging a reference
green power production trajectory (the Photovolta
project recording of the 20th of August 2013 in our
case which is the day with the best yield) scaled ac-
cording to the last green power production received
from i. More precisely, we denote P
re f
(t) the green
power production at corresponding hour the day of
reference (see Figure 4). We obtain the following for-
mula:
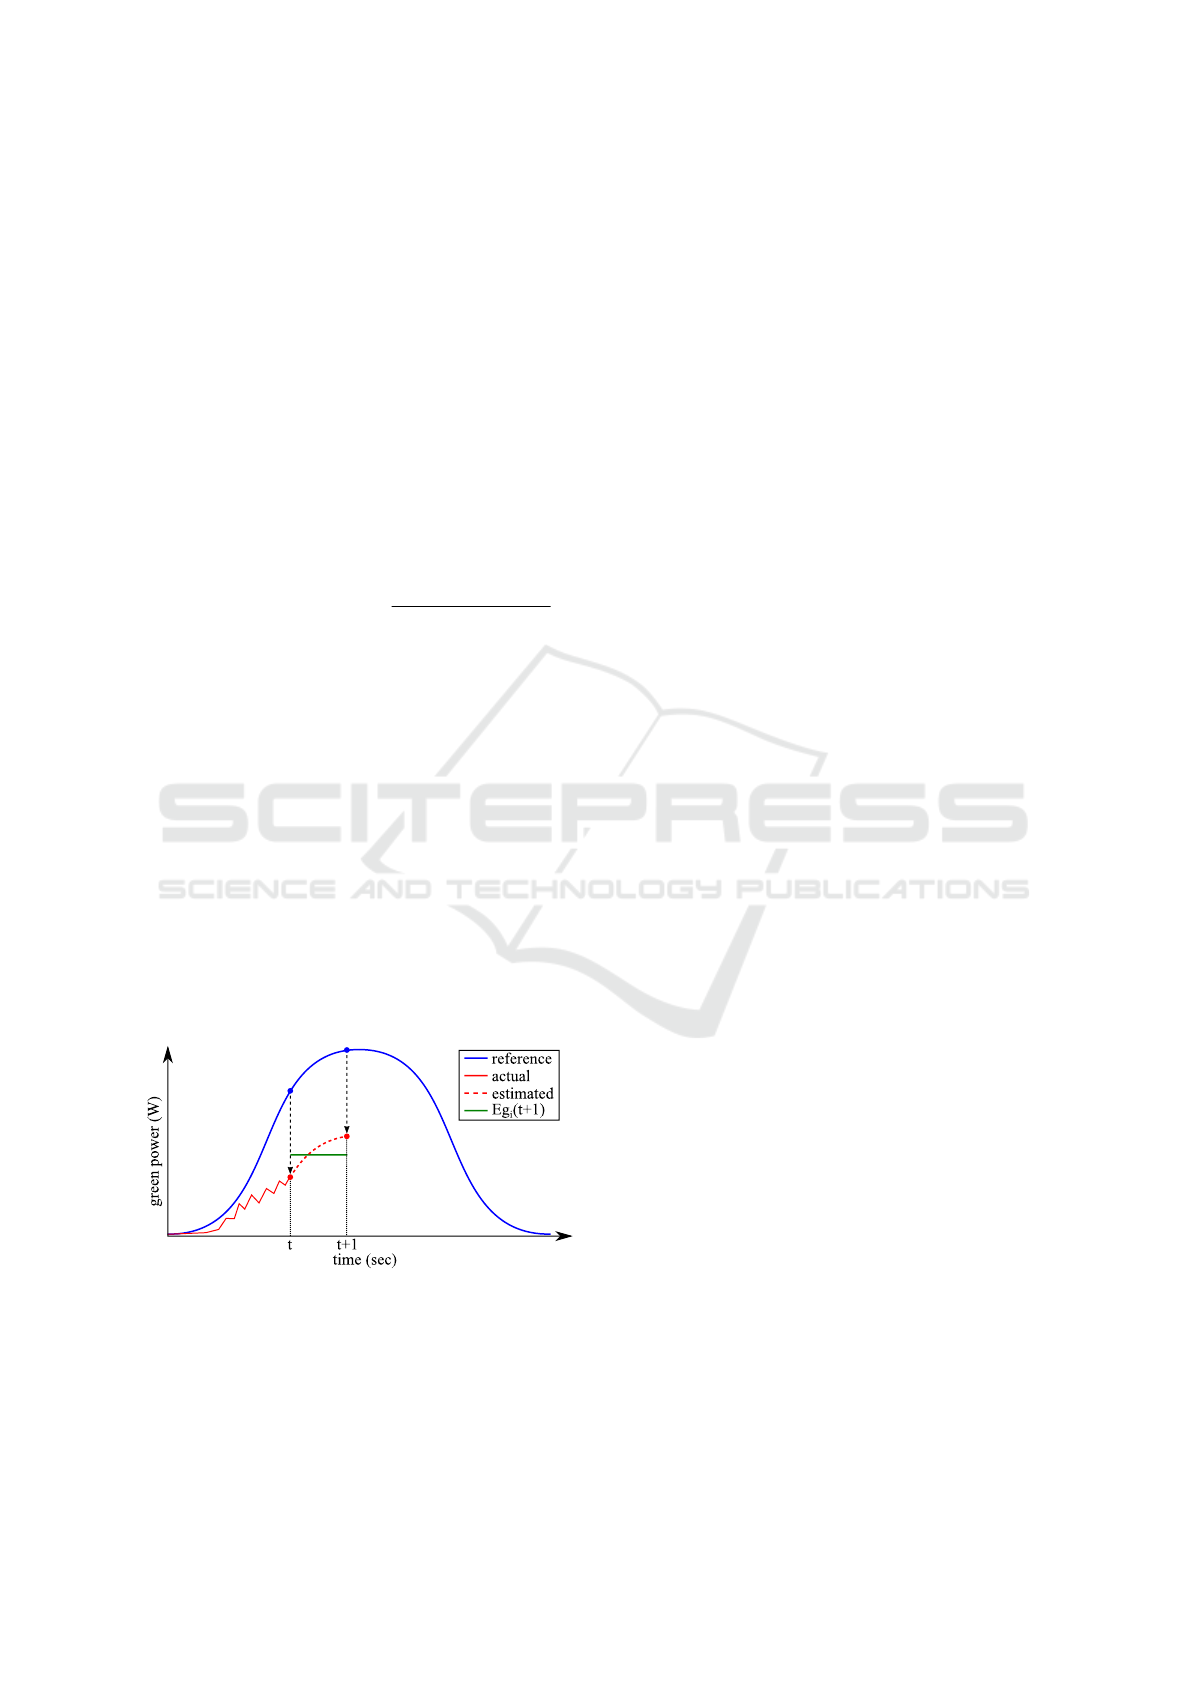
Eg
i
(t) = max
0,PV
i
(t −1) +
P
re f
(t) −P
re f
(t −1)
2
.
Note that we consider with this formula that
Eg
i
(t) is equal to the average between the green
power production received at t −1 and the one esti-
mated at t. Thus, we take into account that the green
power trajectory changes during the time slot, and not
only at its beginning.
For implementing the transfer decision algorithm,
we use the reallocation constraint:
Z = (i < 1000) ∧
max
1≤j≤M
g
j
− min
1≤k≤M
c
k
> 1
,
with i, the number of transfers (i.e. while-loop itera-
tions) already performed for that time slot.
In order to minimize the number of ON/OFF cy-
cles for the servers, the controller fills in priority the
hosts already ON. Therefore, from a time slot to the
next one, the controller keeps trace of the employed
servers.
Figure 4: Expected green power production computation
for a time slot from t to t + 1.
4.6 Simulated Approaches
We compare SAGITTA performance against two
Round-Robin inspired algorithms:
• Round-Robin-VM distributes the VMs fairly be-
tween the data centers regardless their green
power production.
• Round-Robin-DC starts filling with VMs the first
data center (in an arbitrary predefined order). If
this data center becomes full, the algorithm starts
using the next one, and so on.
Like SAGITTA, these two algorithms employ in pri-
ority the nodes already ON.
As the performance of Round-Robin-DC strongly
depends on the order of the data centers, we test two
opposite configurations corresponding to the best and
the worst possible contexts. To define these contexts,
we sort the photovoltaic traces according to the total
amount of green energy they provide. We assign then
the traces to the data centers following this order. The
best context corresponds to the case where the photo-
voltaic traces are sorted in a decreasing order. Thus,
the first data center (i.e. the one filled in priority) will
be supplied by the best photovoltaic power trajectory.
The worst context corresponds then to the case where
the traces are sorted in an increasing order (i.e. the
data center with the worst green power supply will
always be filled first).
To properly evaluate the performance of the three
algorithms, it is important to note that the green power
available is not always sufficient to supply the cloud
needs in our simulation. That is why we also com-
pute the optimal cumulative brown energy consump-
tion which corresponds to the best performance reach-
able regarding our cloud configuration. We determine
this optimal performance based on the optimal brown
power consumption of the cloud at time t, P
B
(t) given
by the equation:
P
B
(t) = max
P
tot
(t) −
∑
1≤i≤M
min(PV
i
(t),P
S
×S
i
)
!
,0
!
,
with :
• P
tot
(t) the total power consumption of the cloud at
time t,
• PV
i
(t) the photovoltaic power production for DC
i
at time t.
5 RESULTS
Based on the simulation framework described in the
previous section, several experiments were run to
validate our proposed approach. First, simulations
are conducted without switching ON/OFF costs (i.e.
A Stochastic Approach for Optimizing Green Energy Consumption in Distributed Clouds
53
switching does not take time nor energy) to evalu-
ate the allocation algorithms in an ideal context (Sec-
tion 5.1). An optimal theoretical lower bound is de-
termined this way. Then, new simulations are per-
formed with switching costs in order to fairly compare
SAGITTA against state-of-the-art approaches (Sec-
tion 5.2). The influence of the transfer parameter
Z is analyzed (Section 5.3), as well as the influence
of the green energy forecast (Section 5.4). Various
green production scenarios are studied to estimate the
impact of green energy location on SAGITTA’s per-
formance (Section 5.5). Finally, the scalability of
SAGITTA is evaluated by increasing the number of
data centers (Section 5.6).
5.1 Without Switching ON/OFF Costs
We simulate the cloud behavior over one week. First,
the power costs of switching ON/OFF the servers are
not integrated in order to have a fair comparison with
the ideal unreachable case (given by P
B
(t)) which
does not take into account these costs. Our simula-
tion estimates that this cloud consumes a total of 4.96
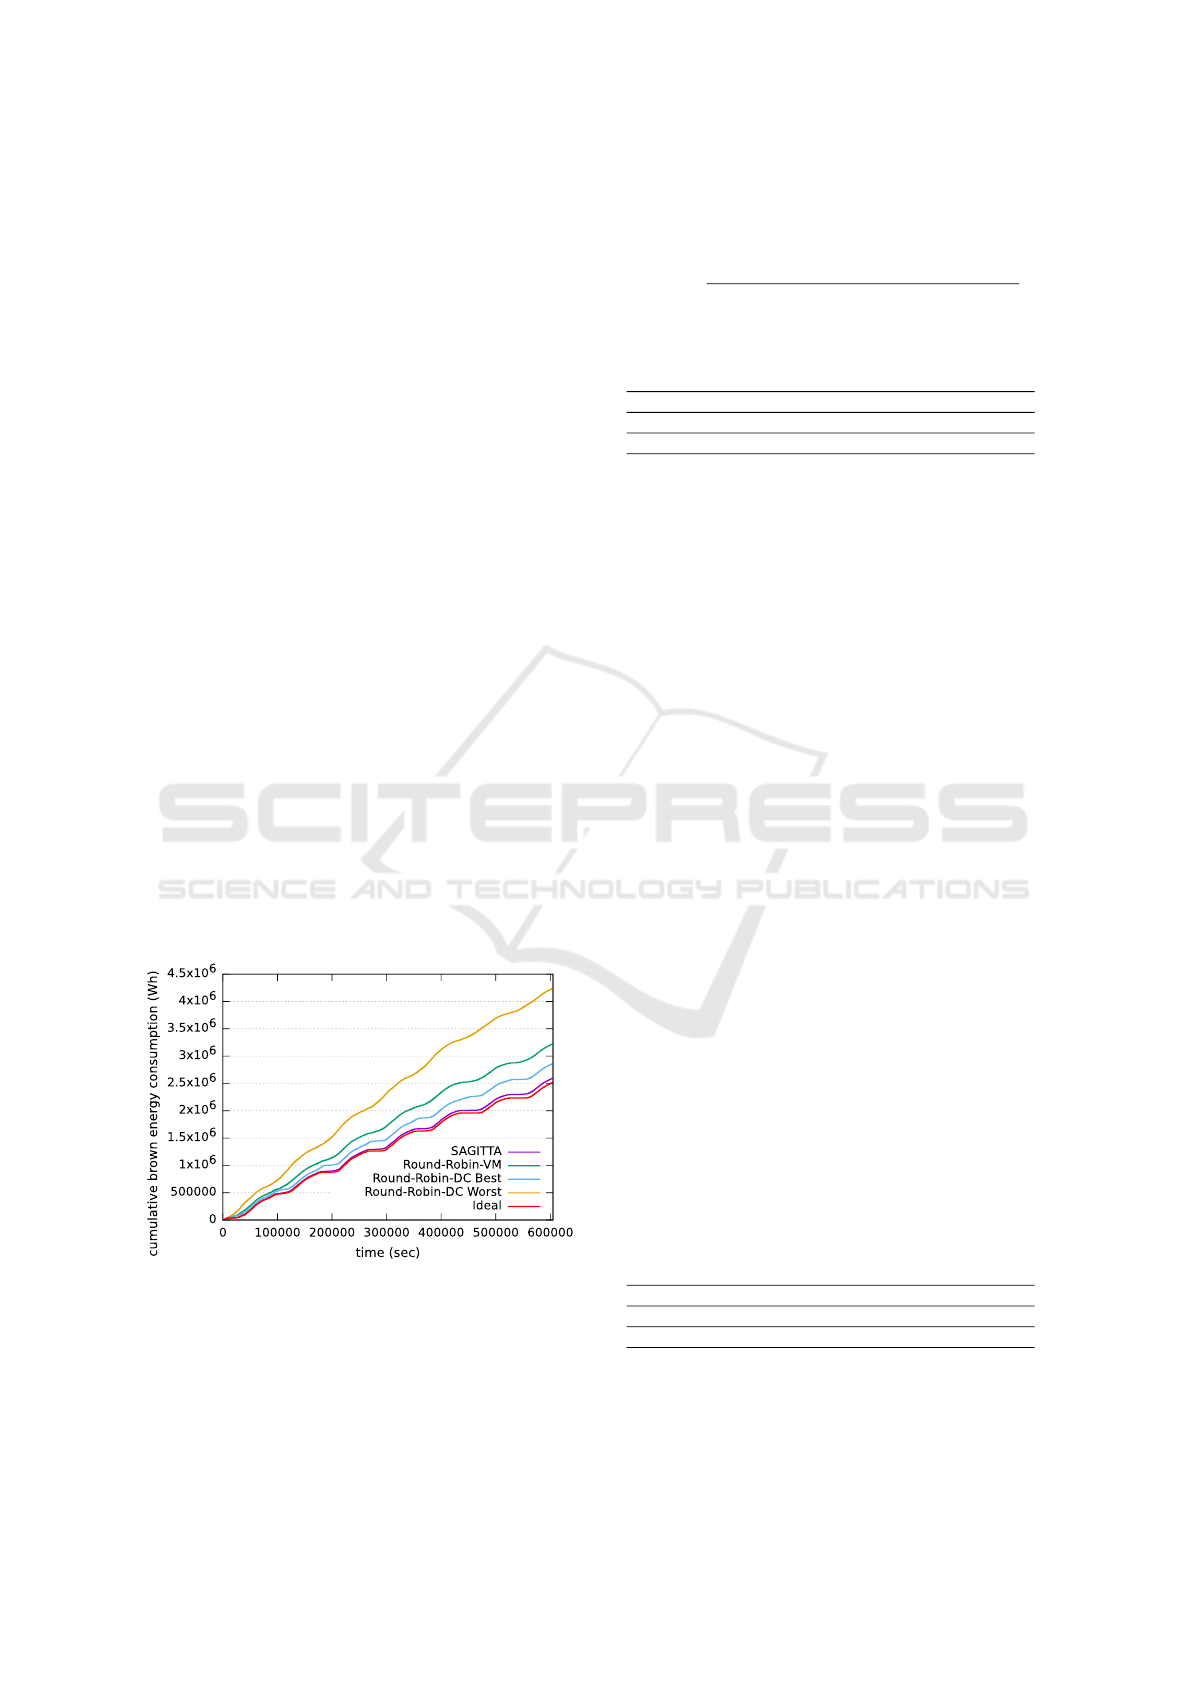
MWh over the simulated week. Figure 5 shows the
cumulative brown energy consumption of the cloud
over time for the previously described scheduling
algorithms. SAGITTA presents a consumption 4%
above the ideal, and significantly better than Round-
Robin-VM (28.8% above the optimal) and Round-
Robin-DC (14.4% above the optimal in the best case,
and 69.6% in the worst case).
Figure 5: Cumulative brown energy consumption of the
cloud generated by the different allocation approaches.
As shown in Table 2, SAGITTA stands out even
more clearly from the other algorithms when consid-
ering the percentage of available green energy they
waste. We compute these percentages based on the
ratio of available green power wasted at time t, W (t)
given by the following equation:
W (t) =
∑
1≤i≤M
min(P
i
(t) −PV
i
(t), 0)
−P
B
(t)
P
tot
(t) −P
B
(t)
With P
i
(t) the power consumption of DC
i
.
Table 2: Percentage of total available green energy wasted.
SAGITTA Round-Robin-VM Round-Robin-DC
Best 3.14% 28.83% 14.15%
Worst 3.14% 28.83% 70.27%
It is worth noting that, due to its transfer deci-
sion (i.e. Algorithm 4), SAGITTA switches ON/OFF
significantly more nodes than the other algorithms:
33,792 switches ON for SAGITTA against 29,606
switches ON for the other algorithms. This difference
on the number of switches should have an impact on
the overall cloud power consumption. This effect is
not visible in this first set of simulations (shown in
Figure 5) as they ignore the nodes powering OFF/ON
costs.
To sum up, compared to the ideal allocation,
SAGITTA consumes 4% more brown energy and
wastes 3.14% of green energy (while the ideal al-
location does not waste any). For both criteria,
green energy waste and brown energy consumption,
SAGITTA outperforms traditional approaches based
on round-robin allocation.
5.2 With Switching ON/OFF Costs
The second set of simulation integrates the switching
ON/OFF costs and estimates their impact on the algo-
rithms’ energy consumption to reflect this point. Fol-
lowing the data collected by (Rais et al., 2016) on the
Taurus cluster, we add a static energy consumption
penalty of 5.28 Wh (consumed in 150 seconds) for
each switch-ON command, and 0.56 Wh (consumed
in 10 seconds) for each switch-OFF command sent.
As shown in Table 3, even when considering these
penalties, simulations show that SAGITTA performs
better than the other solutions with a difference of at
least 10%.
Table 3: Total cumulative brown energy consumption when
including switching ON/OFF energy costs.
SAGITTA Round-Robin-VM Round-Robin-DC
Best 2.77 MWh 3.38 MWh 3.02 MWh
Worst 2.77 MWh 3.38 MWh 4.4 MWh
Figure 6 shows the power consumption over time
of each data center in the simulated cloud using
SAGITTA. This figure also shows the number of
SMARTGREENS 2017 - 6th International Conference on Smart Cities and Green ICT Systems
54
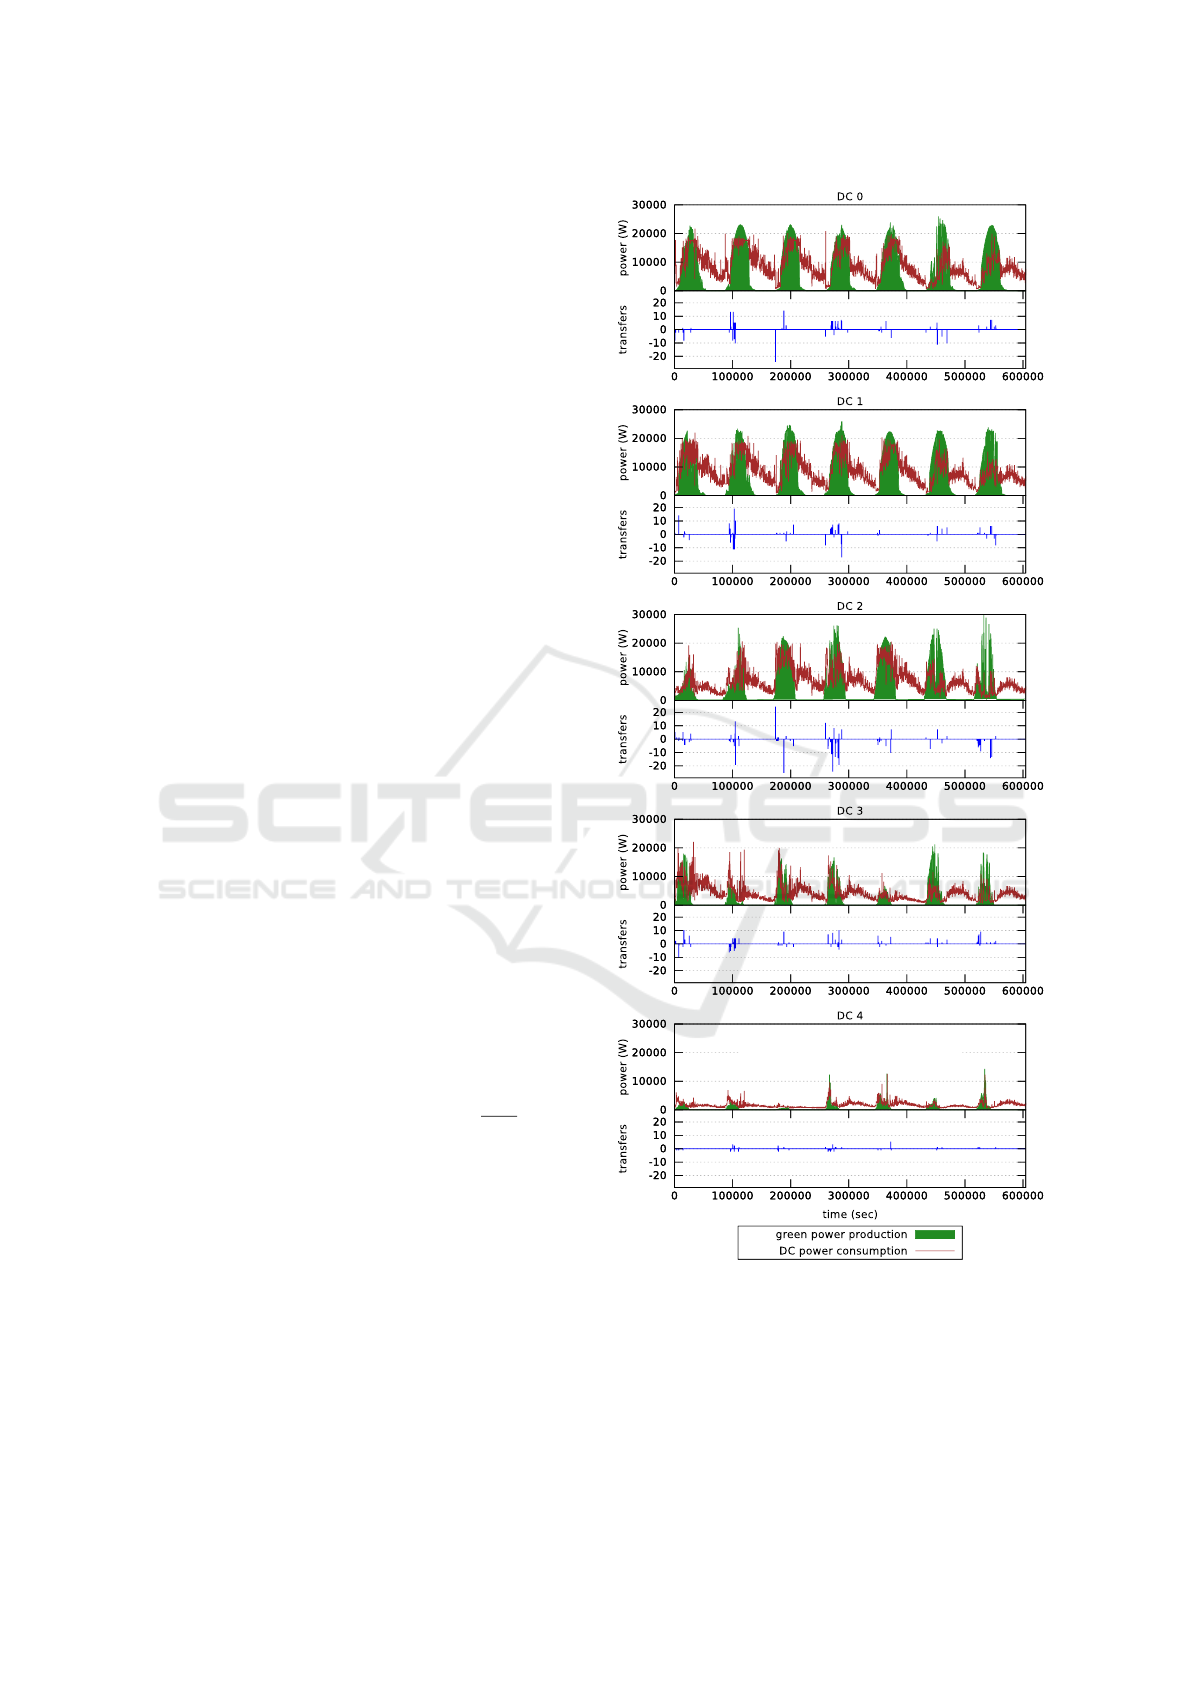
transfers made by Algorithm 4 – a negative (re-
spectively positive) value meaning that the algorithm
switches off (respectively on) hosts. This plot high-
lights the usefulness of the transfer algorithm. For in-
stance, at time 173,700 s. which corresponds to early
morning, DC 2 starts producing green energy slightly
earlier than DC 0. SAGITTA takes then advantage
of this situation by performing 24 transfers from DC
0 to DC 2. Transfers are highly correlated with dis-
continuities in the green power production trajecto-
ries. Thus, the transfer decision may enable adapting
the VM allocation, and consequently the energy con-
sumption, to unforeseen increases and decreases of
the green power production. In the absence of trans-
fer, the switch on and off decisions enable adapting
the DC workload to their green power production -
i.e. the data centers with higher power production are
generally more used than the others.
For the sake of simplicity, in the following, we
will consider the best case for the Round-Robin-DC
algorithm (with data centers ranked by their over-
all green energy production). All the simulations in
the next sections also include the switching ON/OFF
costs.
5.3 Influence of the Transfer Parameter
Now, the influence of the transfer parameter is stud-
ied. When comparing with the previous simulations,
for SAGITTA’s case, the switching costs add 6.5%
of the overall consumption. Concerning the differ-
ence between SAGITTA’s power consumption and the
other ones, the difference is reduced when taking into
account the switching costs. This situation comes
from the transfer decisions, and in particular from Z,
the transfer decision criteria (used in Algorithm 4).
We redefine as follows the Z constraint in order for
the transfer decision to take into account the switching
energy costs:
Z = (i < 1000) ∧
max
1≤i≤M
g
i
− min
1≤j≤M
c
j
×
300
3600
> α
with α, the average brown energy cost of a transfer.
Figure 7 compiles the results of 74 simulations us-
ing different values of α. It shows that even when con-
sidering the switching ON/OFF penalties, SAGITTA
performs better for all the α values with at least 2.77
MWh (and 2.75 MWh at best) of brown energy con-
sumed against 3.38 MWh for Round-Robin-VM, and
3.02 MWh (respectively 4.4 MWh) for Round-Robin-
DC in the best (respectively worst) context. However,
one can note that, the transfer decision has a relatively
small impact on SAGITTA overall performance: at
best, it only saves up to 3.04 kWh of brown energy,
and performs transfers only 5% of the time (in this
Figure 6: Power consumption per data center with
SAGITTA and transfer decisions.
case, it performs an average of 6 transfers per time
slot). Moreover, we observe that, in the absence of a
precise estimation of the green energy production, it
is safer to overestimate α: then the risk is to lose the
small benefit of the transfer decision. At the opposite,
A Stochastic Approach for Optimizing Green Energy Consumption in Distributed Clouds
55
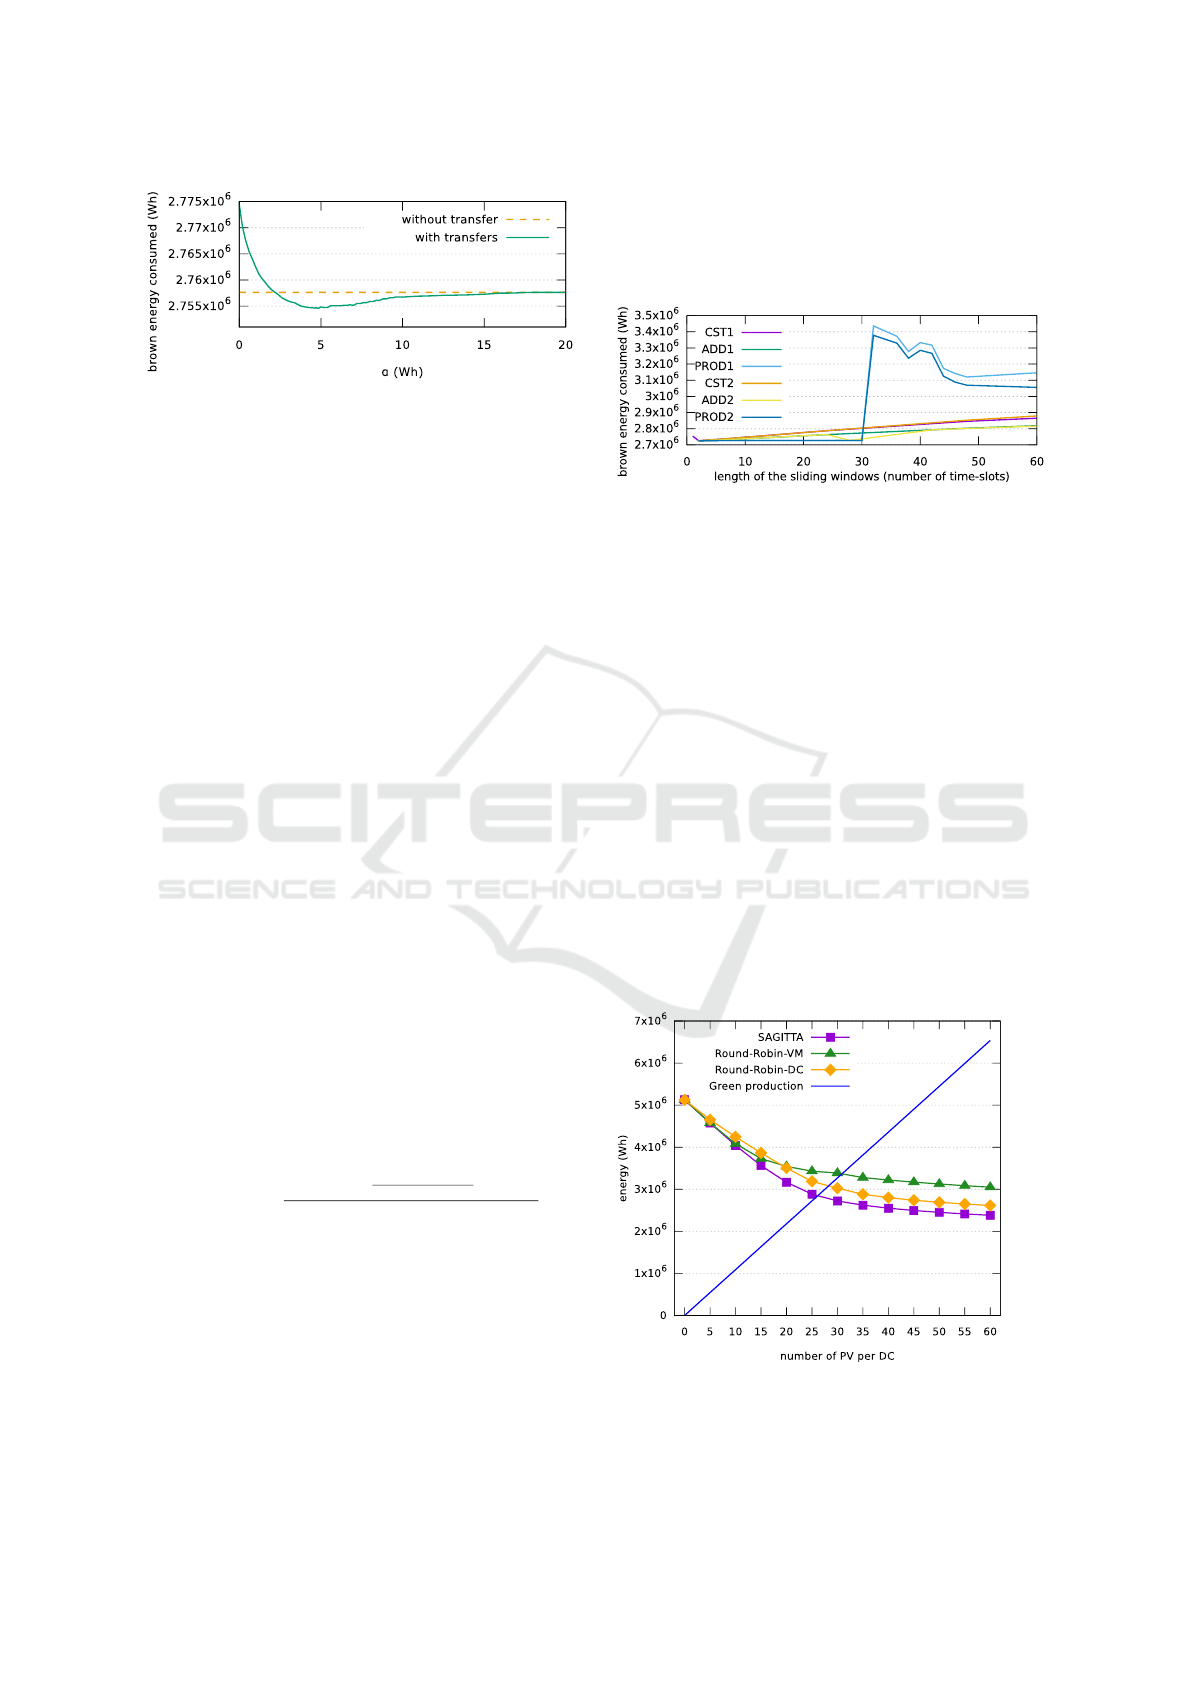
Figure 7: Impact of α estimation on SAGITTA perfor-
mance.
when α is underestimated, the transfer decision may
degrade SAGITTA performance - i.e. it increases the
brown power consumption (up to 19.83 kWh at worst)
by inducing too many transfers. Thus α value is not
inconsequential and should be properly set if transfers
are considered.
5.4 Influence of the Green Energy
Forecast
One basis of the SAGITTA approach is the green en-
ergy production forecast. The value Eg
i
(t), namely
the expected PV production in DC
i
at time slot t is
computed regarding the electricity production at time
slot t −1. This approach permits a simple compu-
tation for the value Eg
i
(t) to parametrize the proba-
bility law of green energy production. However, this
formula estimates the electricity production regarding
only the previous time slot, despite of the high volatil-
ity of solar energy. We experiment in this section an
evaluation of Eg
i
(t) on a sliding window of PV pro-
duction values. We target here the optimal size of the
window, and the weight to give to the values of the
different time slots of the window.
We propose several solutions to determine Eg
i
(t)
on a sliding window of size s. For the sake of simplic-
ity, we denote g
i
(t) = PV
i
(t) −P
re f
(t), with P
re f
(t)
the daily production at same hour, the day of refer-
ence. We then make a weighted average value of val-
ues g
i
(t), with weight p
i
:
Eg
i
(t) = max
0,
PV
i
(t −1) +
∑
s
k=1
(g
i
(t−k)×p
s−k
)
∑
s
k=1
p
k
+ P
re f
(t)
2
.
The first variant CST1 uses constant weigths p
k
=
1 for recent and old values. In the second variant
ADD1, the values of p
k
increase linearly: p
k
= k + 1.
Finally, the values of p
k
are multiplied by 2 at each
step in PROD1: p
k
= 2
k
. In these variants, the com-
putation includes values corresponding to the night,
when PV
i
(t) and P
re f
(t) are both null. This impacts
the estimation with useless values. Then, in vari-
ants CST2, ADD2 and PROD2, all values g
i
(t) cor-
responding to P
re f
(t) = 0 are removed from the com-
putation. Results of these computations are detailed
in Figure 8. Denote that in this experiments, the opti-
mal value of α determined in Section 5.3 is applied.
Figure 8: Influence of Eg
i
estimation.
The first unexpected result is the very low values
of the optimal size of the sliding window. Regardless
of the variant, the best size of the window is always
2, with a slight reduction of the brown energy con-
sumed. The good performance of algorithms PROD1
and PROD2 can be related to the large weight given
to the earliest production values in the computation.
The weight given to early values has indeed a large
impact on the variants’ performance.
5.5 Influence of Green Energy
Production
Cloud providers need to adequately dimension their
on-site photovoltaic panel farms. This issue involves
a trade-off between the financial cost of installing and
operating photovoltaic panels, and the financial gains
they are bringing in terms of green energy produced
and thus, electricity that has not to be bought from the
regular grid.
Figure 9: Influence of green energy production on brown
energy consumption.
We perform a set of experiments to determine the
SMARTGREENS 2017 - 6th International Conference on Smart Cities and Green ICT Systems
56
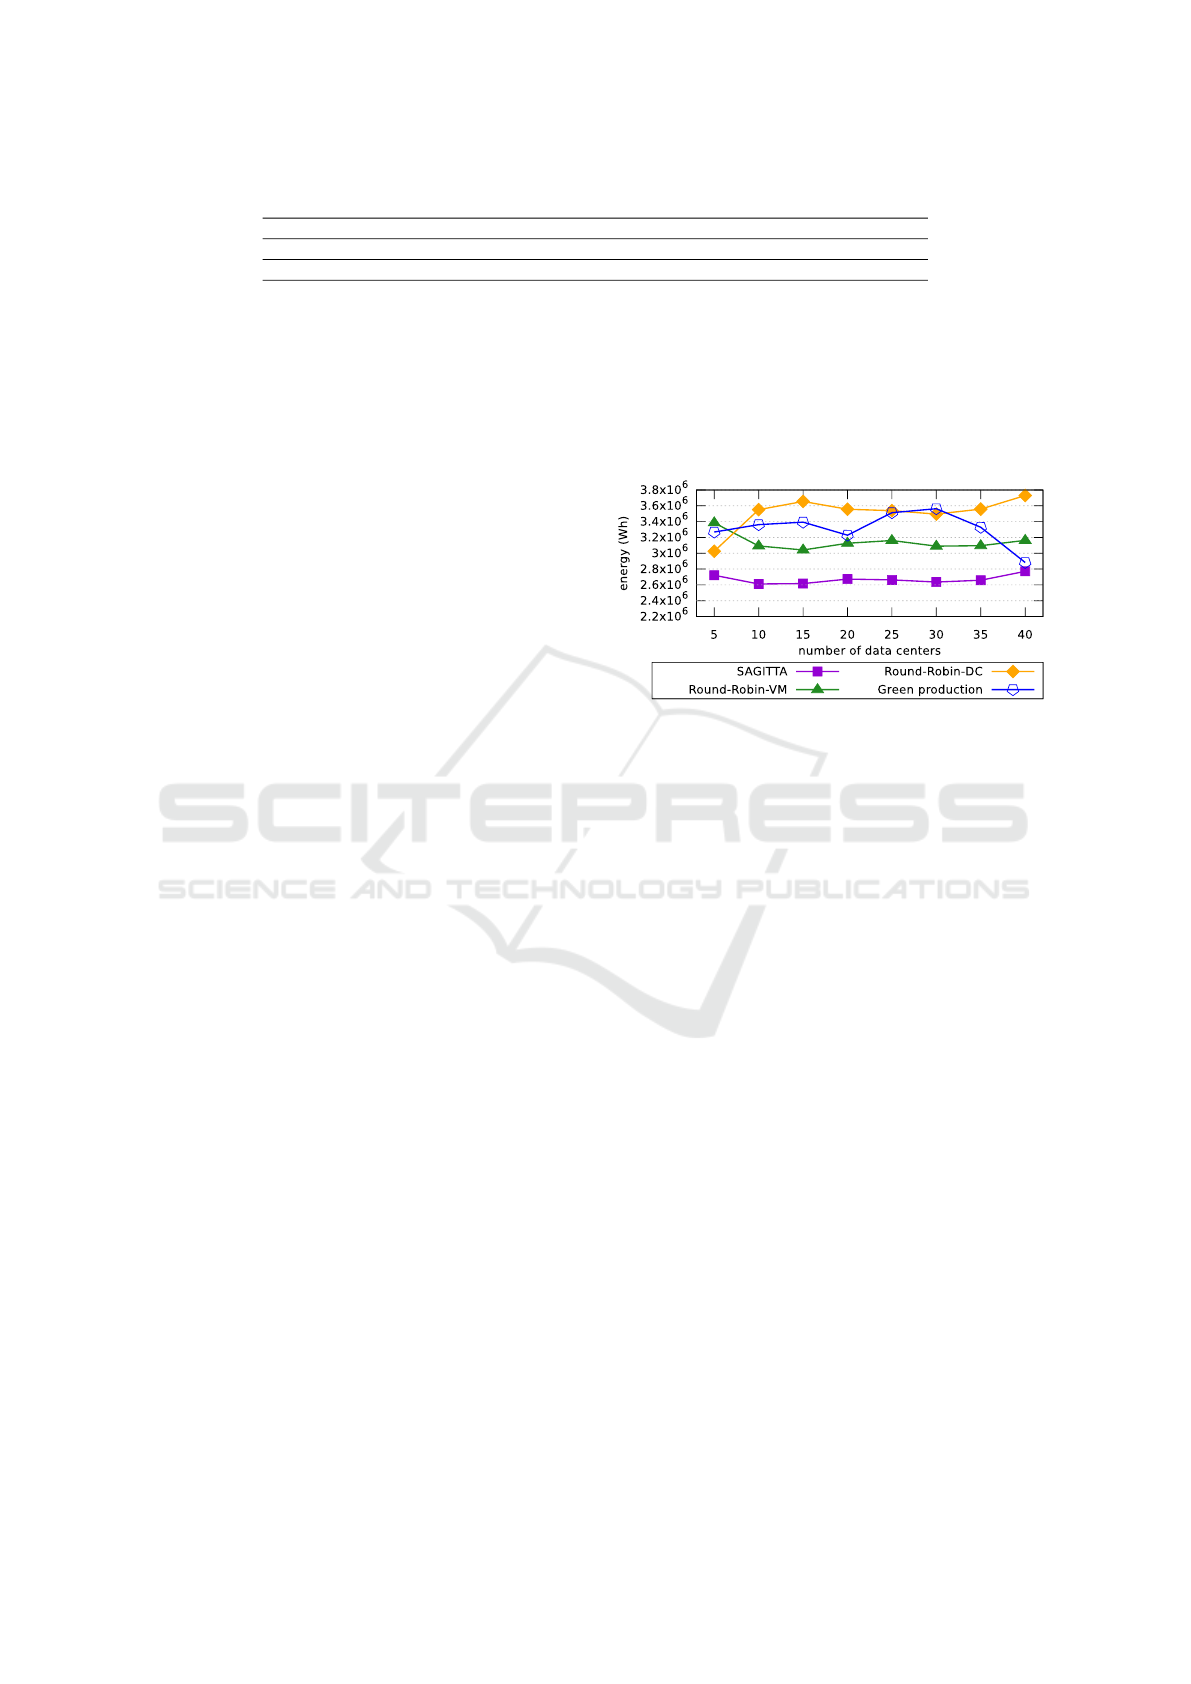
Table 4: The considered cloud scenarios with increasing number of data centers.
Number of data centers 5 10 15 20 25 30 35 40
Total number of nodes 400 400 400 400 400 400 400 400
Number of photovoltaic panels per data centers 30 14 9 7 6 5 4 3
influence of green energy production on SAGITTA
performance. As shown in Figure 9, the number of
photovoltaic panels (PV) varies per data center and
the total brown power consumption is recorded over
one week. We can see that, as soon as green energy
is available, SAGITTA consumes clearly less brown
energy than the other approaches.
Figure 9 also shows that up to about 25 photo-
voltaic panels, the brown energy consumption curves
have a steeper slope, leading to higher gains per pho-
tovoltaic panels. For more than 25 photovoltaic pan-
els, the energy gains are lower per added panel. When
reaching 45 panels, the green energy production ex-
ceeds the total energy consumption of the data center
(represented by the case with 0 panel). However, this
production is concentrated during the day (as shown
in Figure 6), whereas the workload, and consequently
the energy consumption, spans over the day and the
night. Thus, when reaching a number of photovoltaic
panels whose production covers most of the Cloud en-
ergy consumption during daylight, adding panels can
only save the energy consumption peaks at the begin-
ning and the end of the day (when panels produce
less energy), and their buying cost can thus exceed
the monetary gains they generate.
5.6 Scalability of SAGITTA
In order to check if the SAGITTA’s energy savings
scale up, we simulate the power consumption of dis-
tributed clouds with a larger number of data cen-
ters. For these different clouds, we progressively in-
crease the number of data centers, and so the number
of green power sources (still taken from the Photo-
volta project), while maintaining the same total num-
ber of nodes (and so an unchanged input workload).
The total photovoltaic energy production is also kept
as steady as possible by progressively decreasing the
number of photovoltaic panels per data centers. Yet
we decided not to consider fractions of panels, so
the number of panels slightly varies between the sce-
narios to keep whole numbers. The compositions of
these clouds are summed up in Table 4.
As shown in Figure 10, the simulation results dis-
closes that SAGITTA scales up: it maintains its en-
ergy gains in larger clouds, and always consumes less
brown energy than the other approaches. From a com-
puting time point of view, in our simulation environ-
ment, it takes 9 seconds to execute SAGITTA over the
whole workload trace (representing one week) for the
case with 5 data centers, and 28 seconds for the case
with 40 data centers. While this computing time is
increased by a factor of 3 (when increasing the data
center number by a factor of 8), it still remains incon-
sequential for the scalability of SAGITTA.
Figure 10: Brown energy consumption of SAGITTA with
increasing number of data centers.
6 CONCLUSION
In this paper, we propose SAGITTA: a Stochastic Ap-
proach for Green consumption In disTributed daTA
centers. It aims at allocating virtual machines in an
energy-efficient way for a distributed cloud compris-
ing several data centers that are geographically dis-
tributed and that embed on-site photovoltaic panels.
To reduce brown energy consumption, SAGITTA em-
ploys a stochastic approach to estimate the expected
green energy consumption and to adequately allocate
virtual machines on data centers depending on their
green energy production. It also switches off unused
servers to save energy, while taking into account the
energy cost of switching on and off servers.
We conducted a simulation-based evaluation us-
ing real workload traces, wattmeter measurements
on testbed servers and real production traces from
photovoltaic panels. Traditional approaches do not
consider the expected green energy consumption for
taking virtual machine allocation decisions in dis-
tributed clouds. As a consequence, they may over-
estimate the green energy availability – and take non-
efficient scheduling decisions – or underestimate it,
and thus waste this energy. The results show that
SAGITTA can allocate virtual machines in a more
energy-efficient way than traditional approaches, like
round-robin. In particular, it wastes only 3.14%
A Stochastic Approach for Optimizing Green Energy Consumption in Distributed Clouds
57

of green energy when not considering the switching
on/off energy costs. It also exhibits good results in
terms of brown energy consumption with a differ-
ence of 4% with the optimal when not considering
the switching on/off energy costs. When consider-
ing the switching on/off energy costs, SAGITTA con-
sumes 10% more brown energy than the theoretical
lower bound, which is the ideal allocation not taking
into account the switching on/off energy costs. We
study the influence of the green energy production on
SAGITTA’s energy gains and show that, in all cases,
it outperforms traditional approaches. The results
also show that SAGITTA can smoothly scale with the
number of data centers belonging to the cloud.
We plan to extend this work by considering the
impact of network devices on the energy consumption
and integrating the ability to dynamically migrate vir-
tual machines from one site to another.
ACKNOWLEDGEMENTS
The authors would like to thank Yunbo Li for the
energy traces of real datacenter servers. The au-
thors would also like to thank Matthieu Simonin and
Nathalie Bertrand for their proofreading of the math-
ematical proofs. This work has been supported by the
Inria exploratory research project COSMIC (Coordi-
nated Optimization of SMart grIds and Clouds).
REFERENCES
Barham, P., Dragovic, B., Fraser, K., Hand, S., Harris, T.,
Ho, A., Neugebauer, R., Pratt, I., and Warfield, A.
(2003). Xen and the Art of Virtualization. In ACM
Symposium on Operating Systems Principles (SOSP),
pages 164–177.
Callau-Zori, M., Samoila, L., Orgerie, A.-C., and Pierre,
G. (2016). An experiment-driven energy consump-
tion model for virtual machine management systems.
Technical Report 8844, Inria.
Camus, B., Galtier, V., Caujolle, M., Chevrier, V.,
Vaubourg, J., Ciarletta, L., and Bourjot, C. (2016a).
Hybrid Co-simulation of FMUs using DEV&DESS
in MECSYCO. In Proceedings of the Symposium on
Theory of Modeling & Simulation - DEVS Integrative
M&S Symposium.
Camus, B., Paris, T., Vaubourg, J., Presse, Y., Bourjot, C.,
Ciarletta, L., and Chevrier, V. (2016b). MECSYCO:
a Multi-agent DEVS Wrapping Platform for the Co-
simulation of Complex Systems. Research report,
LORIA, UMR 7503, Universit
´
e de Lorraine, CNRS,
Vandoeuvre-l
`
es-Nancy ; Inria Nancy - Grand Est
(Villers-l
`
es-Nancy, France).
Deng, W., Liu, F., Jin, H., Li, B., and Li, D. (2014). Har-
nessing renewable energy in cloud datacenters: oppor-
tunities and challenges. IEEE Network, 28(1):48–55.
Fan, X., Weber, W.-D., and Barroso, L. A. (2007). Power
provisioning for a warehouse-sized computer. In ACM
International symposium on Computer architecture
(ISCA), pages 13–23.
Figuerola, S., Lemay, M., Reijs, V., Savoie, M., and St. Ar-
naud, B. (2009). Converged Optical Network Infras-
tructures in Support of Future Internet and Grid Ser-
vices Using IaaS to Reduce GHG Emissions. Journal
of Lightwave Technology, 27(12):1941–1946.
Greenpeace (2011). How dirty is your data? Greenpeace
report.
Katz, R. H. (2009). Tech Titans Building Boom. IEEE
Spectrum, 46(2):40–54.
Koomey, J. (2011). Growth in Data Center Electricity Use
2005 to 2010. Analytics Press.
Li, Y., Orgerie, A.-C., and Menaud, J.-M. (2015). Oppor-
tunistic Scheduling in Clouds Partially Powered by
Green Energy. In IEEE International Conference on
Green Computing and Communications (GreenCom).
Miyoshi, A., Lefurgy, C., Van Hensbergen, E., Rajamony,
R., and Rajkumar, R. (2002). Critical power slope:
understanding the runtime effects of frequency scal-
ing. In ACM International conference on Supercom-
puting (ICS), pages 35–44.
Orgerie, A.-C., Dias de Assunc¸
˜
ao, M., and Lef
`
evre, L.
(2014). A Survey on Techniques for Improving the
Energy Efficiency of Large-Scale Distributed Sys-
tems. ACM Computing Surveys (CSUR), 46(4):47:1–
47:31.
Rais, I., Orgerie, A.-C., and Quinson, M. (2016). Impact
of Shutdown Techniques for Energy-Efficient Cloud
Data Centers. In International Conference on Al-
gorithms and Architectures for Parallel Processing
(ICA3PP), Granada, Spain.
Ren, S., He, Y., and Xu, F. (2012). Provably-Efficient Job
Scheduling for Energy and Fairness in Geographically
Distributed Data Centers. In IEEE International Con-
ference on Distributed Computing Systems (ICDCS),
pages 22–31.
Shehabi, A., Smith, S., Horner, N., Azevedo, I., Brown, R.,
Koomey, J., Masanet, E., Sartor, D., Herrlin, M., and
Lintner, W. (2016). United States Data Center Energy
Usage Report. Technical report, Lawrence Berkeley
National Laboratory.
Snowdon, D., Ruocco, S., and Heiser, G. (2005). Power
Management and Dynamic Voltage Scaling: Myths
and Facts. In Workshop on Power Aware Real-time
Computing.
Talaber, R., Brey, T., and Lamers, L. (2009). Using Virtual-
ization to Improve Data Center Efficiency. Technical
report, The Green Grid.
Tighe, M., Keller, G., Bauer, M., and Lutfiyya, H. (2012).
DCSim: A data centre simulation tool for evaluating
dynamic virtualized resource management. In Work-
shop on Systems Virtualization Management (colo-
cated with CNSM), pages 385–392.
Tripathi, R., Vignesh, S., and Tamarapalli, V. (2016). Op-
timizing Green Energy, Cost, and Availability in Dis-
tributed Data Centers. IEEE Communications Letters.
SMARTGREENS 2017 - 6th International Conference on Smart Cities and Green ICT Systems
58

Wang, D., Ren, C., Sivasubramaniam, A., Urgaonkar, B.,
and Fathy, H. (2012). Energy storage in datacen-
ters: What, where, and how much? In ACM SIG-
METRICS/PERFORMANCE Joint International Con-
ference on Measurement and Modeling of Computer
Systems, pages 187–198.
Wang, L., Tao, J., Kunze, M., Castellanos, A., Kramer, D.,
and Karl, W. (2008). Scientific Cloud Computing:
Early Definition and Experience. In IEEE Interna-
tional Conference on High Performance Computing
and Communications (HPCC), pages 825–830.
Zeigler, B., Praehofer, H., and Kim, T. (2000). Theory of
Modeling and Simulation: Integrating Discrete Event
and Continuous Complex Dynamic Systems. Aca-
demic Press.
A Stochastic Approach for Optimizing Green Energy Consumption in Distributed Clouds
59
