
A Graph-based Analysis of the Corpus of Word Association Norms for
Mexican Spanish
Victor Mijangos
1
, Julia B. Barr
´
on-Mart
´
ınez
2
, Natalia Arias-Trejo
2
and Gemma Bel-Enguix
1
1
Grupo de Ingenier
´
ıa Ling
¨
u
´
ıstica, Universidad Nacional Aut
´
onoma de M
´
exico, Mexico
2
Facultad de Psicolog
´
ıa, Universidad Nacional Aut
´
onoma de M
´
exico, Mexico
Keywords:
Word Association Norms, Association Graph, Lexical Relations.
Abstract:
The paper focuses on the study of a graph built on a Corpus of Word Association Norms for Mexican Spanish.
We investigate the main features of the graph and the structure of the areas with the strongest connections. An
important goal of this work is the analysis of lexical relations between the most representaive nodes in order
to understand the psychological mechanisms underlying word associations.
1 INTRODUCTION
Word associations have been used by psychologists
from various schools to understand the human mind.
Within cognitive psychology, Collins and Loftus
(1975) applied them to simulate memory processes.
From psycho-linguistics, Clark (1970) presents free
associations as an ability that can reveal some prop-
erties of the mechanisms of language. Even psycho-
analysis (Freud, 1975; Jung and Riklin, 1906) has de-
voted some attention to the topic for it can prove to
be an instrument for the scientific examination of the
human mind, revealing unconscious thinking.
In free word associations, a person typically hears
or reads a word, and then is asked to produce the
first other word coming to mind. Up to now, the
only way to achieve a repertory of these is experi-
mentally. One of the first examples is provided by
Kent and Rosanoff (1910), who used this method for
comparisons of words, introducing 100 emotionally
neutral test words. They conducted the first large
scale study with 1,000 test persons, and concluded
that there was uniformity in the organization of as-
sociations and people shared stable networks of con-
nections among words (Istifci, 2010).
In the past decades, some other association lists
were elaborated with the collaboration of a large num-
ber of volunteers. Among the best known resources
available on the web for English are the Edinburgh
Associative Thesaurus
1
(EAT) (Kiss et al., 1973) and
1
http://www.eat.rl.ac.uk/
the compilation of Nelson et al. (1998)
2
. In recent
years, the web has become the natural way to get data
to build such resources. Jeux de Mots provides an ex-
ample in French
3
(Lafourcade, 2007), whereas small
world of words deals with nine different languages
4
.
For Spanish, there exist several corpus of word as-
sociations. Algarabel et al. (1998) integrate 16,000
words, including statistical analysis of the results.
Macizo et al. (2000) builds norms for 58 words in
children, and Fern
´
andez et al. (2004) work with 247
lexical items, that correspond to Spanish (Sanfeliu
and Fernandez, 1996).
In Mexico, the first resource that compiles Word
Association Norms is the work by Arias-Trejo et al.
(2015). This is a corpus with a sample of 578 young
adults, and 234 stimulus words, all of them concrete
nouns, that were selected from McArtur’s inventory
of understanding and production of words (Jackson-
Maldonado et al., 2003). The advantages of this cor-
pus are the following: a) it is designed with a set of
words common in early language acquisition, which
makes it possible to use the same collection to test
the responses in children; b) it illustrates the Mexi-
can variant of Spanish; c) the responses to the stimuli
show the current state of the language.
Graph theory has been used to approach lexical re-
lations, although graphs have been usually built over
texts, computing the frequency and/or the distance be-
tween words (Wettler et al., 2005; Terra and Clarke,
2
http://web.usf.edu/FreeAssociation
3
http://www.jeuxdemots.org/
4
http://www.smallworldofwords.com
Mijangos, V., Barrón-Martínez, J., Arias-Trejo, N. and Bel-Enguix, G.
A Graph-based Analysis of the Corpus of Word Association Norms for Mexican Spanish.
DOI: 10.5220/0006306400870093
In Proceedings of the 2nd International Conference on Complexity, Future Information Systems and Risk (COMPLEXIS 2017), pages 87-93
ISBN: 978-989-758-244-8
Copyright © 2017 by SCITEPRESS – Science and Technology Publications, Lda. All rights reserved
87

2004; Washtell and Markert, 2009). Only in recent
years, some works have proposed using graph anal-
ysis techniques to compute associations from large
texts collections (Bel-Enguix et al., 2014b,a; Tamir,
2005).
Some works use graph theory for explaining the
structure of a corpus of Word Association Norms, al-
though they are generally focused on The Edinburgh
Associative Thesaurus (EAT) (Amancio et al., 2012;
Zaversnik and Batagelj, 2004; Rotta, 2008).
After presenting the Corpus of Word Association
Norms for Mexican Spanish (Section 2), our main ob-
jective in this paper is to have a general characteriza-
tion of the graph generated from the corpus (Section
3), including a spectral and subgraph analysis. Then,
taking the isolated subgraphs generated with several
thresholds, we want to analyse the remaining lexical
relations, and the characterization of such relations
(Section 4). Finally, we discuss the psychological rel-
evance of the data obtained in our study and explain
some lines of research that can be derived from this
work (Section 5).
2 CORPUS WAN FOR MEXICAN
SPANISH
The Corpus of Word Association Norms for Mexican
Spanish (WAN) was published in 2015. It was elabo-
rated with a sample of 578 young adults, males (239)
and females (339), with age scope between 18 and 28
years, and at least 11 years of education. All of them
were monolingual with Mexican variant of Spanish as
a mother tongue.
In order to avoid bias in the type of response given
by the participants, they were students from differ-
ent areas: Mathematics, Engineering, Biology and
Health, Social Sciences, Humanities, and Art. For
the task, 234 stimuli words were used, all of them
concrete nouns, taken from Jackson and Maldonado’s
Inventario de Compresi
´
on y Producci
´
on de palabras
MacArthur (Jackson-Maldonado et al., 2003). The
selction was made according to two criteria: a) all of
them should be nouns; b) they should be able to be vi-
sually represented. More information about the pro-
cedure and the compilation of the words can be found
in Arias-Trejo et al. (2015). The authors investigated
the following measures: a)Associative Strength of
First Associate (FA); b) Associative Strength of Sec-
ond Associate (SA); c) Sum of Associative Strength
of first two Associates (SM); d) Difference in Asso-
ciative Strength between first two Associates (DF);
f) Number of Different Associates (NA); Blank Re-
sponses (BLR); Idiosyncratic Responses (IR); Cue
validity of First Associate (CV).
3 GRAPH ANALYSIS
Our experiment is based on building a directed graph
with the words of the corpus. We took 234 stimulus
words, which were connected to the responses given
by humans. The nodes with weight 1 were left out of
the network, because they represent hapax legumena.
For the analysis of the graphs we use standard
statistics (Steyvers and Tenenbaum, 2005): diameter,
average clustering, entropy and algebraic connectiv-
ity. The diameter responds to the longest path be-
tween two nodes in the graph; the clustering coeffi-
cient (Watts and Strogatz, 1998) of a node indicates
the extent to which it is connected with its neighbours.
The average clustering coefficient calculates the aver-
age of the nodes in the network, and is a measure for
the connectivity of the graph. It can be defined as fol-
lows:
ˆ
C =
1
n
n
∑
i=1
C
i
(1)
Here C
i
=
∆
G
τ
G
, where ∆
G
is the number of sub-
graphs with 3 edges and 3 vertices, while τ
G
denotes
the subgraphs of the graph G with 2 edges and 3 ver-
tices.
The entropy determines the loss information when
walking from vertex v
j
to vertex v
i
. To calculate
it, we use a random walk over the graph G. Let’s
A = (a
i j
) be the adjacency matrix of the graph G and
µ
i
=
∑
n
j=1
a
i j
∑
n
i, j=1
a
i j
the ith stationary distribution; then, the
entropy of G is defined as follows:
H(G) =
n
∑
i=1
µ
i
n
∑
j=i
P(v
i
|v
j
) (2)
Finally, the algebraic connectivity is equal to the
value of the second smallest eigenvalue. If this pa-
rameter is greater that 0, then the graph is connected.
A more complete description is given in the spectral
analysis section.
In comparison with the EAT corpus, the Word As-
sotation Norms (WAN) for Mexican Spanish is small.
The EAT graph has around 8000 stimulus words and
more than the double of total nodes. Table 1 shows
the statistics obtained from both graphs (Steyvers and
Tenenbaum, 2005).
Despite the difference in size, the diameter reflects
similarities between both graphs. While in the WAN
the diameter is 6, in the EAT graph there is only one
COMPLEXIS 2017 - 2nd International Conference on Complexity, Future Information Systems and Risk
88
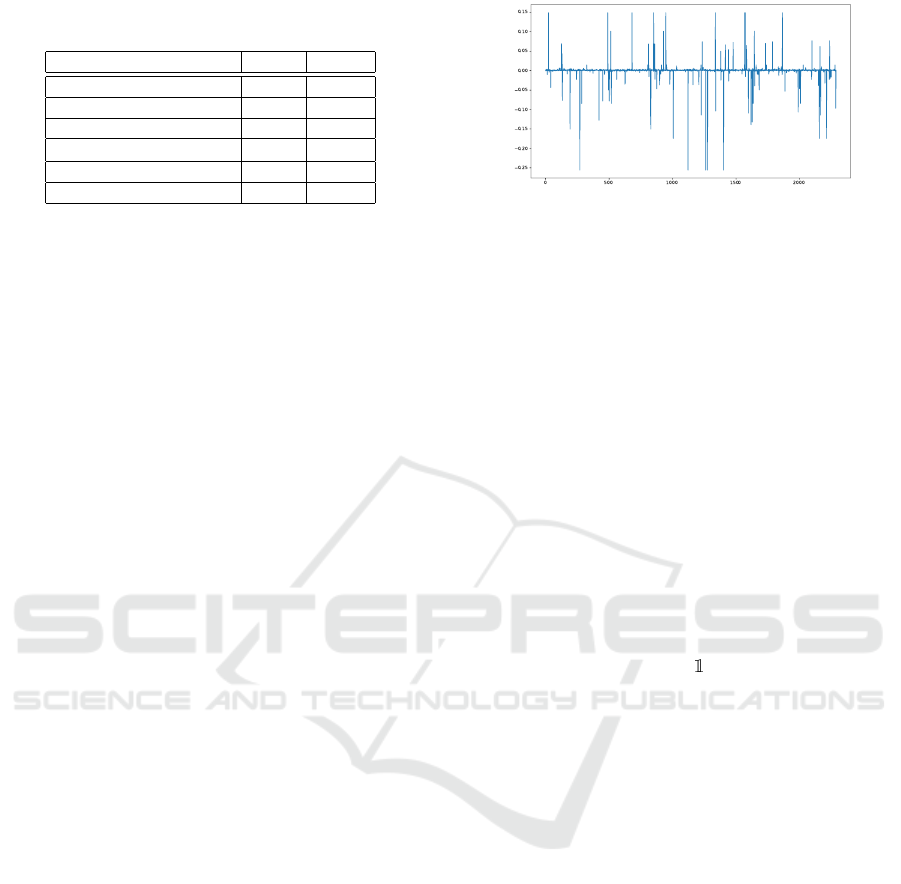
Table 1: Comparison between the statistics of the WAN
graph an the EAT graph.
WAN EAT
Activation words 234 8400
# Nodes 2288 16620
Diameter 6 7
ˆ
C 0.098 0.091
Entropy 3.51 2.87
Algebraic connectivity 1.17 0.64
more path to walk. According to Small-Worldness ap-
proach, a diameter of 6 is an ideal number for graph
theory (Li et al., 2007). Similarly, the average clus-
tering in both graphs is around 0.9. In this case, the
neighbors nodes behave in a similar way both in the
WAN and in the EAT.
The entropy of the graphs, computed trough a ran-
dom walk, is lower in the EAT despite being a larger
graph. This implies that the weights in the EAT graph
allows more predictable paths in a walk. Finally, the
algebraic connectivity is wider in the WAN graph;
thus the WAN reflects better connection in the overall
graph. Nevertheless, factors like the number of infor-
mants for words must be taken into account.
3.1 Spectral Analysis
The spectral analysis of the graph reflects characteris-
tics of the relation between words that are not explicit
in the raw graph. For this analysis we took the Lapla-
cian matrix of the WAN graph, defined as L = D − A,
where D is the degree matrix and A the adjacency ma-
trix of the graph.
As for the eigenvalues only the first has value 0.
This means that this is a connected graph. This is also
reflected in the algebraic connectivity that is different
from 0. The algebraic connectivity also shows that
the graph is not complete, because this eigenvalue is
greater than 1 (Fiedler, 1973; Anderson et al., 1985).
The spectrum of the WAN graph shows a concave
interval. So, it is clear that 2 − λ
i
with λ
i
in this inter-
val is not an eigenvalue (Anderson et al., 1985). This
let us conclude that the graph is not bipartite. This
was predictable because the relations between words
do not tend to be bipartite.
Figure 1 shows the components of the Fiedler’s
vector (the eigen-vector associated with the second
smallest eigenvalue) and its values. Here, the neg-
ative values of the components of the vector are as-
sociated with the graph partitioning. The elements
close to 0 tends to describe points placed in a cluster
in their own, while negative values reflect elements
poorly connected with those elements with positive
values. In general terms, the eigen-space generated
Figure 1: Components of the Fiedler’s vector.
by the Fiedler’s vectors reflects the partition of the
graph (Fiedler, 1973). This way, we took this vector
to generate a set of vectors with lower dimensionality
(Belkin and Niyogi, 2003).
Figure 2 (left) shows a zoom in the plot of the
points corresponding to the stimuli words trough the
t-sne algorithm (Maaten and Hinton, 2008). Every
point is represented by its relations to other words in
the adjacency matrix. The plot presents the points
with a distribution that does not allow a proper sep-
arability.
Figure 2 (right) presents a part of the total plot
of the points reduced by taking the second (Fiedler’s
vector) and third eigenvectors with smallest eigenval-
ues. These are taken from the Laplacian matrix and
are transposed to represent the points in the original
data (Belkin and Niyogi, 2003). We do not choose
the first eigenvector because this is associated with
the eigenvalue 0 so it is the vector (Fiedler, 1973).
In the plot of Figure 2 (right) the clusters between
the points are clearer. There are different groups of
words with different features. For example, the words
‘pijama’ and ‘cobija’ (blanket) are depicted very close
to each other. Also the words for ’brush teeth’ and
‘teeth’ are in a group with other words. Even if the
groups are semantically heterogeneous, there are ten-
dencies to draw together words that are highly related
in the graph.
This first analysis shows that a representation of a
graph in a vector space model can be made by a spec-
tral decomposition of the Laplacian matrix, (Fiedler,
1973; Belkin and Niyogi, 2003). A partitional clus-
tering algorithm, like k-means, can be applied as pro-
posed by Ng et al. (2002).
3.2 Subgraphs Analysis
In order to see the strongest connections in the graph
we have considered only the words related to the stim-
ulus with frequency ≥ t where t is the selected thresh-
old. In the general case, when t = 2 the graph is
fully connected and we can say that every word in the
graph is related with any other word. Selecting dif-
ferent values for t the number of subgraphs increases
A Graph-based Analysis of the Corpus of Word Association Norms for Mexican Spanish
89
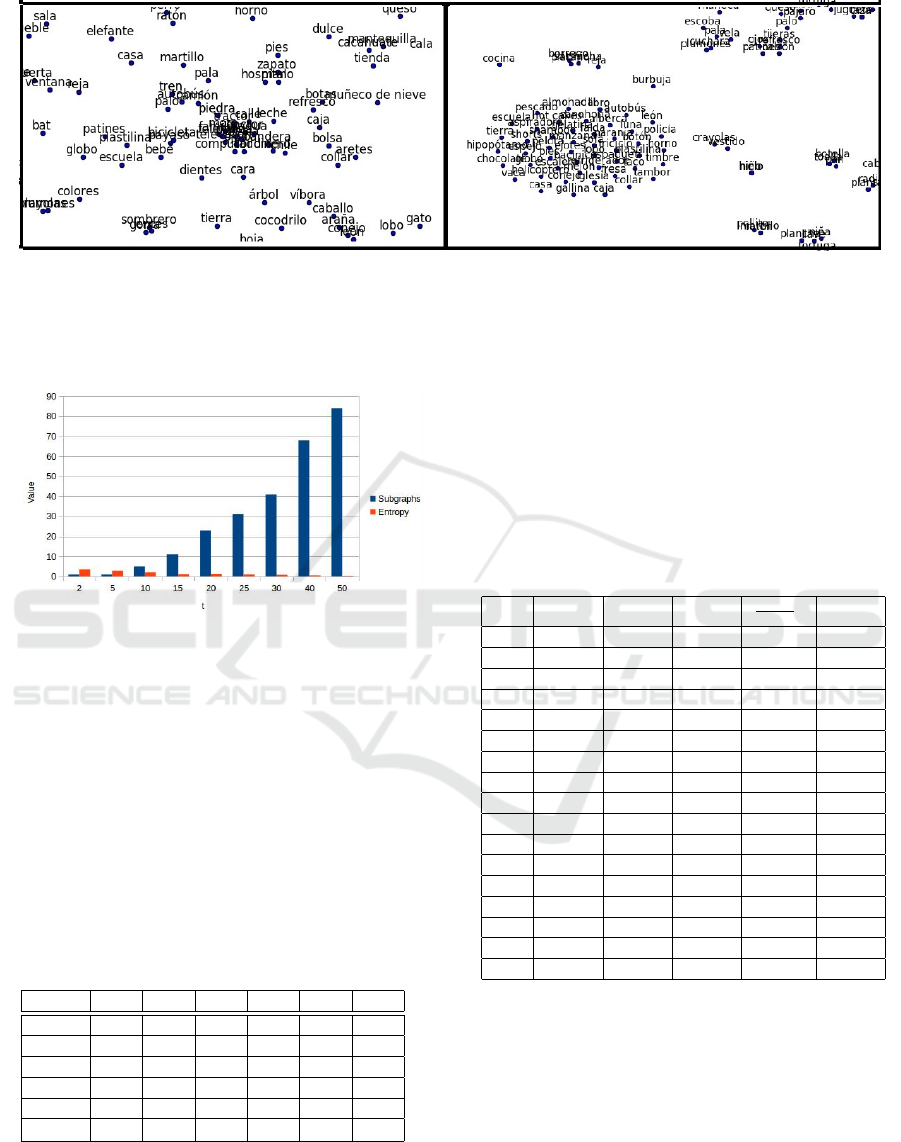
Figure 2: (Left) Zoom of the plot of the points reduced with t-sne. (Right) Zoom of the plot of the points reduced through the
second and third eigenvectors with smallest eigenvalues of the Laplacian matrix.
as shown in Figure 3. Inversely, the entropy of the
general graph decreases.
Figure 3: Relation of subgraphs and entropy range between
different frequency thresholds.
It is not surprising that the entropy decreases be-
cause there are disconnected elements. So, there is
no transition between the nodes of two different sub-
graphs. We can analyze the subgraphs generated by
different t. We focus only on the biggest subgraph
for determining the diameter and the clustering coef-
ficient C. Data are shown in Table 2.
Table 2: Stadistics for different subgraphs obtained by vary-
ing the threshold t. The Diameter and average clustering C
are taken from the biggest subgraph of the general graph.
Here |E| is the number of nodes, δ the diameter, D
ii
ele-
ments of the degree matrix and H the entropy and S(G) the
subgraphs.
t 5 10 20 30 40 50
|E| 1237 797 520 410 338 280
S(G) 1 5 23 41 68 84
H 2.8 2.16 1.32 0.81 0.49 0.26
λ
2
0.53 0 0 0 0 0
δ 8 11 17 25 13 6
ˆ
C 0.08 0.08 0.07 0.07 0.03 0.08
For a most detailed study of the subgraphs and
the nodes inside, we take t = 20. Therefore, the
nodes with an absolute weight smaller than 20 have
been dismissed. In this way we draw a graph taking
only the connections among the nodes that exceed the
threshold. For these analysis, only subgraphs with 3
or more nodes are taken. The results are 17 differ-
ent unconnected groups, with a number of nodes that
go from 3 to 15. The main values of these subgraphs
can be seen in Table 3, where the numbers assigned
to each subgraph are randomly given by the program.
An example of a subgraph can be seen in Figure 4.
Table 3: Values for different subgraphs with N > 2 obtained
with t = 20. Here |E| is the number of nodes, δ the diameter,
D
ii
elements of the degree matrix and H the entropy.
|E| λ
2
δ
|E|·D
ii
|E|−1
H
1 7 10.97 5 35 0.66
2 3 28.49 2 42 0.50
3 3 35.50 2 42 0.46
4 3 26.71 2 30 0.42
5 3 124.47 2 184.5 0.50
6 6 27.39 2 31.2 1.15
7 4 24.91 2 32.0 0.66
8 8 21.30 3 27.42 1.25
9 3 40.66 2 43.5 0.35
10 4 24.59 2 30.66 0.76
11 3 30.18 2 30.17 0.28
12 14 7.46 6 21.53 1.11
13 3 35.45 2 37.5 0.32
14 5 22.09 2 26.25 0.96
15 3 27.16 2 37.5 0.49
16 3 59.08 2 69 0.45
17 3 62.75 2 79.5 0.48
4 LEXICAL ANALYSIS
One of the most interesting aspects for psychology
and linguistics is the analysis of lexical relations in
the graph. To study this aspect we have raised the
threshold of absolute weight of nodes to 20. Thus
we have obtained 17 subgraphs; in this way, the num-
ber of data was reduced and we were able to analyze
the lexical relations established in the subgraphs. To
COMPLEXIS 2017 - 2nd International Conference on Complexity, Future Information Systems and Risk
90
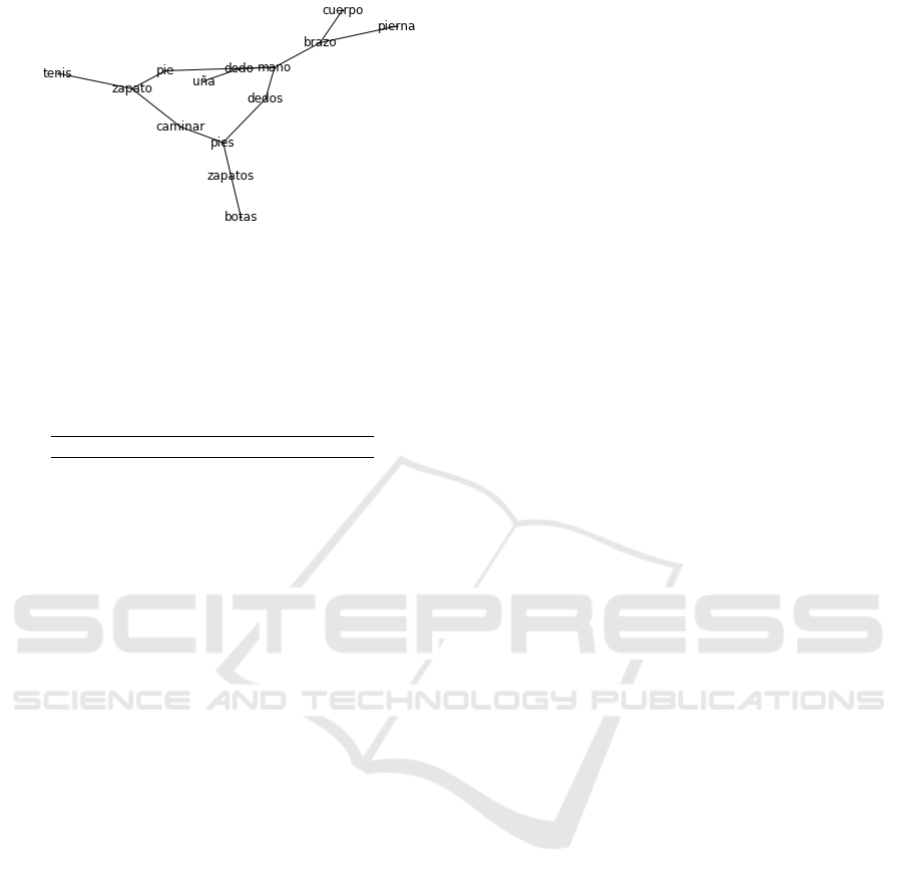
Figure 4: Subgraph containing 14 nodes obtained with
threshold=20, that corresponds to the number 12 in tab 3.
study this aspect we have taken the 17 groups that
emerged when the threshold of absolute weight of the
nodes is raised to 20.
Table 4: Probability transitions of the first generated sub-
graph.
v
1
v
2
P(v
2
|v
1
) Relation
vela fuego 0.18 METON
vela luz 0.6 METON
vela cera 0.21 MADE
l
´
ampara luz 1 METON
fuego le
˜
na 0.83 METON
le
˜
na fogata 0.18 MADE
Table 4 shows relations appearing in the group of
the first sub-graph as well as their transition probabil-
ity. The transition probability was calculated from a
transition matrix of the nodes (Tamir, 2005). In for-
mal terms, the transition matrix is described as
P := (p
i j
) = P(v
i
|v
j
)
Where v
i
and v
j
are different nodes representing
words.
Table 5 shows a summary of the results. Absolute
frequency refers to the original weight of the stim-
ulus word with the responses obtained with it. The
weighted frequency is the sum of probabilities of tran-
sition of the words in every relation. Finally, the last
column explains which categories are linked by the
given lexical relation. We have to stress that the rela-
tion is not symmetric.
As it can be seen in the Table 5, the most
represented relations are metonymy and meronymy.
Metonymy involves an association between two ref-
erents derivable from observation of the input refer-
ence (e.g., street-car). Meronymy refers to a part or to
a member of the input word (e.g., finger-nail). These
two frequent responses reflect direct relationships be-
tween two words, more likely adopted in common
spoken language and thus easy to be retrieved as
an automatic response. These unconscious associa-
tive mechanisms could contribute to dream imagery,
thought patterns and prediction or rapid processing of
upcoming input. This can be influenced by the fact
that all the stimuli words in the corpus were nouns.
Bearing this in mind, the results provide very inter-
esting conclusions for lexical structure and psycholin-
guistics. Metonymy and meronymy seem to be, in
this context, the strongest associations. This supports
Langacker’s idea (Langacker, 1987) about metonymy
in language. meronymy can be seen as a especial type
of metonymmy, in the sense that meronymy refers to
the part of and object, while metonymy is a seman-
tic relation between two words that are related trough
physical contact.
As for functionality, this is a very interesting lex-
ical relation in the context, especially because it im-
plies that a stimulus word Noun is linked to a response
Verb, breaking the rule that most of the words re-
trieved in the corpus are Nouns in response to Nouns.
The relation noun-verb is frequent when expressing
functionality, because the idea that is being intro-
duced is the use of the object. An example can be
‘tel
´
efono’ → ‘llamar’. In spite of that, also the Noun-
Noun is the most frequent relation to express the idea
of functionality in the corpus: ‘polic
´
ıa’ → ‘seguri-
dad’. Another frequent relation is cohyponymy. In
this, two words are in the same level, and belong to
the same immediate hyperonym. An example in the
subgraphs is ‘pie’ → ‘mano’.
Finally, qualification, hyponymy, “made of” and
synonymy show a weaker behavior in the corpus. Al-
though the relation ”made of” has more absolute fre-
quency, its weighted frequency is lower. The fact that
the stimuli were nouns has an impact in the distribu-
tion of lexical relations. For example, antonymy does
not appear and synonymy has a very low frequency.
These relations are presented more frequent with ad-
jectives: hot-cold. It can be pointed out that most of
the relations are ‘semantic’ which means that the pro-
portion of phonetically-inspired responses is almost
imperceptible.
5 DISCUSSION AND
CONCLUSIONS
This has been a preliminary approach to the informa-
tion that an analysis of the network built over the Cor-
pus of Word Association Norms for Spanish can pro-
vide. We have studied the main features of the graph,
and this has been he basis to investigate which which
lexical relations in the corpus are the strongest.
The analysis of word association norms allow us
to understand how the semantic memory of typical
young adults is organized. This organization can be
compared with that of other populations in order to
A Graph-based Analysis of the Corpus of Word Association Norms for Mexican Spanish
91
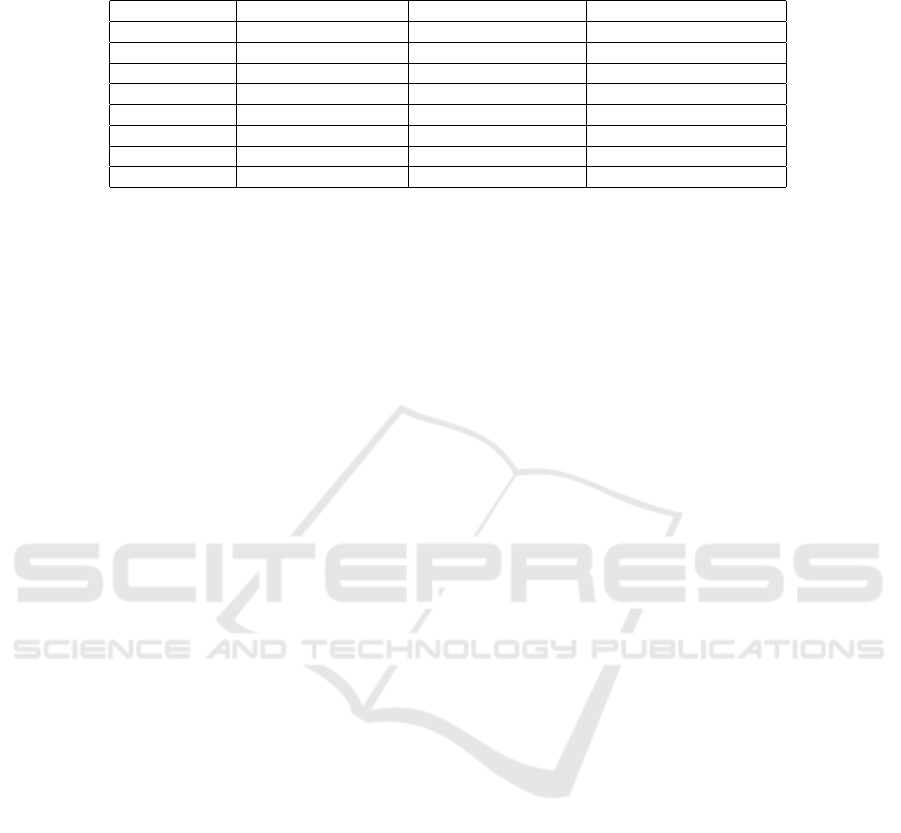
Table 5: Strongest lexical relations found in the Graph built over the Corpus WAN for Mexican Spanish. The weighted
frequency is calculated over the probabilities of transition of the words.
Relation Absolute frequency Weighted frequency Categories
Metonymy 17 12.29 (NN, NN): 17
Meronymy 17 10.19 (NN, NN): 17
Functionality 13 7.88 (V, NN): 5; (NN, NN): 8
Cohyponymy 7 4.24 (NN, NN): 7
Qualification 2 2.0 (Adj, NN): 2
Hyponymy 2 2.0 (NN, NN): 2
Made of 3 0.55 (NN, NN): 3
Synonymy 2 0.37 (NN, NN): 2
explore, for example, variations between adults and
children.
As we can see, the semantic network formed by
the participants possesses a good cohesion, this may
be a mirror of how use and experience bring words
together to allow rapid linguistic processing with pos-
itive implications such as our ability to predict related
words.
The next steps in this line of research will include
extending the comparison of this graph with one gen-
erated by the EAT and other corpora of word asso-
ciation norms. This will provide information about
the mechanisms underlying word associations and the
possible differences that this psychological process
has in different languages.
The analysis of word association norms allow us
to understand how the semantic memory of typical
young adults is organised. This organisation can be
compared with that of other populations in order to
search for example variations between adults and chil-
dren.
Although the use of a graph theory approach to
understand the lexical organization is not novel, the
study of lexical relations with graph-based techniques
from a WAN corpus is. The method allows to under-
stand quantitatively the way in which words are con-
nected. According to Spreading Activation Theory of
Semantic Processing postulated by Collins and Lof-
tus (1975), the weight of the connection between two
nodes represents the similarity of meaning that exists
between them. In the case of the present work, the
semantic similarities between the words are reflected
through the subgraphs obtained in the WAN corpus
(e. g., the animal subgraph).
Although the total sample of words in the WAN
corpus is small compared to the EAT corpus, this
is not a limitation for exploring lexical organization.
The above, can be verified with the indexes and lexi-
cal relations obtained in the present work (see Figure
2, 3 and 4).
Finally, in the area of Psycholinguistics, it is ex-
tremely useful to have mathematical and computa-
tional tools that allow the simulation of language and
memory processes, in order to understand the auto-
matic mechanisms involved.
Upon completion of this study, we expect to find
the main mechanisms underlying word storage and
association, as well as some tests for early identifi-
cation of possible language pathologies.
ACKNOWLEDGEMENTS
Research supported by the Universidad Nacional
Aut
´
onoma de M
´
exico with project PAPIIT IA400117.
REFERENCES
Algarabel, S., Ru
´
ız, J. C., and Sanmart
´
ın, J. (1998). The
University of Valencia’s computerized Word pool. Be-
havior Research Methods, Instruments & Computers.
Amancio, D. R., Oliveira, O. N., and Costa, L. d. F. (2012).
Using complex networks to quantify consistency in
the use of words j. Stat, 2012.
Anderson, N., W., and Morley, T. D. (1985). Eigenvalues
of the laplacian of a graph. Linear and multilinear
algebra, 18(2):141–145.
Arias-Trejo, N., B.-M. J. B., Alderete, L., and R. H., R. A.
(2015). Corpus de normas de asociaci
´
on de palabras
para el espa
˜
nol de M
´
exico [NAP]. Universidad Na-
cional Aut
´
onoma de M
´
exico.
Bel-Enguix, G., Rapp, R., and Zock, M. (2014a). A
graph-based approach for computing free word asso-
ciations. In Association:, E. L. R., editor, Proceedings
of the Ninth International Conference on Language
Resources and Evaluation (LREC’14), pages 3027–
3033.
Bel-Enguix, G., Rapp, R., and Zock, M. (2014b). Ti-
tle: How well can a corpus-derived co-occurrence
network simulate human associative behavior? In
48, Gothenburg, Sweden, April 26 2014, EACL 2014,
pages 43-48. Proc. of 5th CogACLL.
Belkin, M. and Niyogi, P. (2003). Laplacian eigenmaps
for dimensionality reduction and data representation.
Neural computation, 15(6):1373–1396.
Clark, H. H. (1970). Word associations and linguistic the-
ory. In Lyons, J., editor, New horizons in linguistics:,
pages 271–286. Penguin, Baltimore.
COMPLEXIS 2017 - 2nd International Conference on Complexity, Future Information Systems and Risk
92

Collins, A. M. and Loftus, E. F. (1975). A spreading-
activation theory of semantic processing. Psychologi-
cal Review, 82(6):407–428.
Fern
´
andez, A., D
´
ıez, E., Alonso, M. A., and Beato, M. S.
(2004). Free-association norms form the spanish
names of the snodgrass and vanderwart pictures. Be-
havior Research Methods, Instruments & Computers,
36:577–583.
Fiedler, M. (1973). Algebraic connectivity of graphs.
Czechoslovak mathematical journal, 23(2):298–305.
Freud, S. (1975). The psychopathology of everyday life.
Penguin, Harmondsworth.
Istifci, I. (2010). Playing with words: a study of word as-
sociation responses. Journal of International Social
Research 0, 1.
Jackson-Maldonado, D., Thal, D., Marchman, V., Newton,
T., Fenson, L., and Conboy, B. (2003). McArthur
inventarios del desarrollo de habilidades comunica-
tivas. Brookes, User’s guide and technical manual.
Baltimore.
Jung, C. and Riklin, F. (1906). Experimentelle untersuchun-
gen
¨
uber assoziationen gesunder. In Jung, C. G., edi-
tor, 145. Barth, Leipzig. editor, Diagnostische Assozi-
ationsstudien.
Kent, G. H. and Rosanoff, A. J. (1910). A study of associa-
tion in insanity. Amer J. Insanity, 1910(67):317–390.
Kiss, G. R., Armstrong, C., Milroy, R., and Piper, J. (1973).
An associative thesaurus of English and its computer
analysis. Edinburgh University Press, Edinburgh.
Lafourcade, M. (2007). Making people play for lexical
acquisition. In Proc of the th SNLP 2007, Pattaya,
Tha
¨
ıland, 7:13–15.
Langacker, R. W. (1987). Foundations of cognitive gram-
mar: Theoretical prerequisites, volume 1. Stanford
university press.
Li, W., Lin, Y., and Liu, Y. (2007). The structure of
weighted small-world networks. Physica A, 376:708–
718.
Maaten, L. and Hinton, G. (2008). Visualizing data us-
ing t-sne. Journal of Machine Learning Research,
9(2008):2579–2605.
Macizo, P., G
´
omez-Ariza, C., and Bajo, M. T. (2000). As-
sociative norms of 58 spanish for children from 8 to
13 years old. Psicol
´
ogica, 21:287–300.
Nelson, D. L., McEvoy, C. L., and Schreiber, T. A. (1998).
Word association rhyme and word fragment norms.
The University of South Florida.
Ng, A. Y., Jordan, M. I., and Weiss, Y. (2002). On spectral
clustering: Analysis and an algorithm. Advances in
neural information processing systems, 2:849–856.
Rotta, R. (2008). clustering/benchmark graphs: collec-
tion:eatr.
Sanfeliu, M. C. and Fernandez, A. (1996). A set of 254
snodgrass’ vanderwart pictures standardized for span-
ish: Norms for name agreement, image agreement, fa-
miliarity, and visual complexity. Behavior Research
Methods, Instruments, & Computers, 28:537–555.
Steyvers, M. and Tenenbaum, J. B. (2005). The large scale-
structure of semantic networks: statistical analyses
and a model of semantic growth. In Cogn. Sci. 29(1),
pages 442–449.
Tamir, R. (2005). A random walk through human associa-
tions. In Proceedings of ICDM 2005, pages 442–449.
Terra, E. and Clarke, C. (2004). Fast computation of lexical
affinity models. In Proc of COLING 2004.
Washtell, J. and Markert, K. (2009). A comparison of win-
dowless and window-based computational association
measures as predictors of syntagmatic human associa-
tions. In 637, pages 628–637. Proceedings of the 2009
EMNLP.
Watts, D. J. and Strogatz, S. (1998). Collective dynamics of
’small-world’ networks. Nature, 393:440–442.
Wettler, M., Rapp, R., and Sedlmeier, P. (2005). Free
word associations correspond to contiguities between
words in texts. Journal of Quantitative Linguistics,
12(2):111–122.
Zaversnik, M. and Batagelj, V. (2004). Islands, sunbelt xxiv.
May 12-16.
A Graph-based Analysis of the Corpus of Word Association Norms for Mexican Spanish
93
