
A Participatory Design Approach for Energy-aware Mobile App for
Smart Home Monitoring
Alessandro Aliberti
1
, Christian Camarda
2
, Valeria Ferro
2
, Andrea Acquaviva
1
and Edoardo Patti
1
1
Dept. of Control and Computer Engineering, Politecnico di Torino, Torino, Italy
2
Midori s.r.l., Torino, Italy
Keywords:
Participatory Design, User-awareness, User-centered, Energy Aware, Smart Home, Smart Metering, Prosumer.
Abstract:
It is generally recognized that our behaviours affect the environment. However, it is difficult to correlate
behaviour of an individual person to large-scale problems. This is usually due to insufficient ergonomy of
available tools. The main cause is that most of user-awareness tools available are technology-centered instead
of user-centered. In this paper, we present a participatory design approach we followed to design and develop
an energy-aware mobile application for user-awareness on energy consumption for Smart Home monitoring.
To engage end-users from the early design stages, we conduct two on-line surveys and a focus group involving
about 630 people. Results allowed on identifying functional requirements and guidelines for mobile app
design. The purpose of this research is to increase user-awareness on energy consumption using tools and
methods required by users themselves. Furthermore in this paper, we present the technological choices that
drove our implementation of an energy-aware application based on prosumers’ requirements.
1 INTRODUCTION
Traditionally, technicians and engineers design sys-
tems with a technology-centered perspective. In re-
cent years, there is a deep change in the design
approach: from technology-centered philosophy to
user-centered. In this way, new design challenges are
projected on a new way to mold a system interface
considering capabilities and needs of end-users. This
philosophy aims at achieving optimal functioning of
overall human-machine system (Endsley, 2011). The
main principles of this design pattern can be sum-
marized as follows: i) design technology around the
user needs, tasks and abilities; ii) design technology
to help users in easily achieve a goal and make a deci-
sion; iii) design technology to make aware the users.
In a dynamic and complex system, decision mak-
ing depends on situation awareness; thus, knowing
what is happening. In (Faruqui et al., 2010), the
authors prove how user-awareness influences the en-
ergy savings at home and helps user to change their
own habits towards green attitudes. Consequently,
developers have to understand user-awareness as per-
sonalization of services delivered to consumers and
prosumers
1
(Ritzer and Jurgenson, 2010). This
1
Active consumer. New figure of producing consumer.
is achieved by choosing proper data processing
and transmission methods, according to functional
and non-functional requirements stated by end-user.
These requirements can be formulated explicitly or be
a result of automatic recommendations that are based
on application usage (Gra
˜
na and Toro, 2012).
To actively involve consumers and prosumers on
early planning and design stages of an energy-aware
app for Smart Home monitoring, we carried out two
on-line surveys and a focus group involving about 630
people in total. The subsequent results have been ex-
ploited to define guidelines on which the entire appli-
cation is based, also it highlighted many issues and
lacks. These results highlighted a general lack of
awareness on energy consumption. Very often, users
do not know consumptions and operating status of
their appliances, while they perceive it as an essen-
tial information to know. Thus, users believe that a
(near-) real-time energy-aware system is needed, even
to promote green behaviours.
In this work, we aim at better understanding the
importance of user-centered methodology to design
and develop an energy-aware mobile application for
Smart Home monitoring. We present the followed
Participatory Design methodology to define func-
tional requirements and guidelines to develop such
a tool. The rest of this paper is organized as fol-
158
Aliberti, A., Camarda, C., Ferro, V., Acquaviva, A. and Patti, E.
A Participatory Design Approach for Energy-aware Mobile App for Smart Home Monitoring.
DOI: 10.5220/0006299001580165
In Proceedings of the 6th International Conference on Smar t Cities and Green ICT Systems (SMARTGREENS 2017), pages 158-165
ISBN: 978-989-758-241-7
Copyright © 2017 by SCITEPRESS – Science and Technology Publications, Lda. All rights reserved

lows. Section 2 reviews literature solutions on user-
awareness for energy consumption in smart environ-
ments. Section 3 describes the followed participatory
design methodology. It also presents the results of
two on-line surveys and a focus group we conducted
to understand the functional requirements requested
by users. These requirements have been taken into
account to develop an energy-aware mobile app for
Smart Home monitoring that is presented in Section 4.
Finally, Section 5 discusses concluding remarks and
future works.
2 RELATED WORK
There are a lot of research works in the field
of user-awareness for energy saving. EnergyLife
project (Jacucci et al., 2009) represents one of the first
experiments where during the design phase the au-
thors studied end-users’ behaviors to realize a mobile
platform close to users’ needs. Two relevant projects
developed with LinkSmart
2
are Energy Aware Smart
Home (Jahn et al., 2010) and EnergyPULSE (Jahn
et al., 2011). LinkSmart is middleware designed to
create distributed applications and platforms to inter-
act with Internet-of-Things (IoT) devices. Both En-
ergy Aware Smart Home and EnergyPULSE projects
develop smart energy efficient applications in hetero-
geneous environments. Energy Aware Smart Home
includes smart metering and control of home appli-
ances combined with novel user interaction applica-
tions. EnergyPULSE allows the monitoring of power
consumption of appliances and other environmental
values in the office domain (e.g. temperature, pres-
ence). It aims at providing a basis for new kinds of
user-centered feedback systems in such an environ-
ment.
In Energy Aware Smart Home (Jahn et al., 2010),
the authors deploy stationary and mobile interfaces
that allow end-user to monitor and control smart
homes. For each appliance the system User-Interface
(UI) displays current consumption in watts, costs per
hour, and costs projected over one year. As smart plat-
form, they implement UbiLense (Reiners and Jentsch,
2009), an Augmented Reality (AR) (Carmigniani
et al., 2011) system that aims at improving the user-
experience. This application recognizes objects using
image-processing methods and displays energy con-
sumption information about the target device. This
AR-awareness system improves the user-experience
but in any case end-users must interact with pre-
designed UI. This type of design is still technology-
2
https://linksmart.eu/redmine
centered.
In EnergyPULSE (Jahn et al., 2011), the authors
use Business Ethnography
3
(BE) (Stevens and Nett,
2009) approach to study if users understand the infor-
mation collected by the system and if they perceive
these information as useful for reducing the energy
waste. Through three workshops, involving 12 peo-
ple, the authors have defined and analyzed users re-
quirements to improve their system. Specifically, they
have understood some energy practices in work places
and how they may affect on energy consumptions.
Differently from our participatory design approach,
Jahn et al. impose a default UI and data set. Only
through a subsequent study, involving end-users, they
evaluate possible design guidelines to consider in de-
velopment of such systems. These improvements are
not implemented but they represent the starting point
for future developments.
3 IDENTIFICATION OF TARGET
USERS AND FUNCTIONAL
REQUIREMENTS
In (Faruqui et al., 2010), the authors emphasize
how user-awareness on energy consumption can pos-
itively affect the energy savings at home. In partic-
ular, if end-users know their energy consumption in
(near-) real-time, they can save around 7-17% of en-
ergy. Hence, a proper user-awareness and notifica-
tion system is needed to promote green behaviours
and convince users in changing their habits, which
is not trivial. The rest of this section presents the
results of two on-line surveys and a focus group we
conducted. We exploited this results to identify func-
tional requirements, strengths and improvements re-
quested by users to design and develop an efficient
energy-awareness application, presented in Section 4.
Particular emphasis was given on gathering users’ in-
formation, ideas, opinions and attitudes on energy
consumption and efficiency.
3.1 Target User Survey
The first on-line survey was focused on identifying
target user. It consists of ten questions regarding
i) Personal Information and ii) Energy Consumption
Interests, as reported in Table 1. It involved 528 per-
sons and results are shown in Figure 1 and discussed
in the following.
3
The Business Ethnography is a supporting method to
evolutionary design conceptions and relative forms of prod-
uct finding.
A Participatory Design Approach for Energy-aware Mobile App for Smart Home Monitoring
159
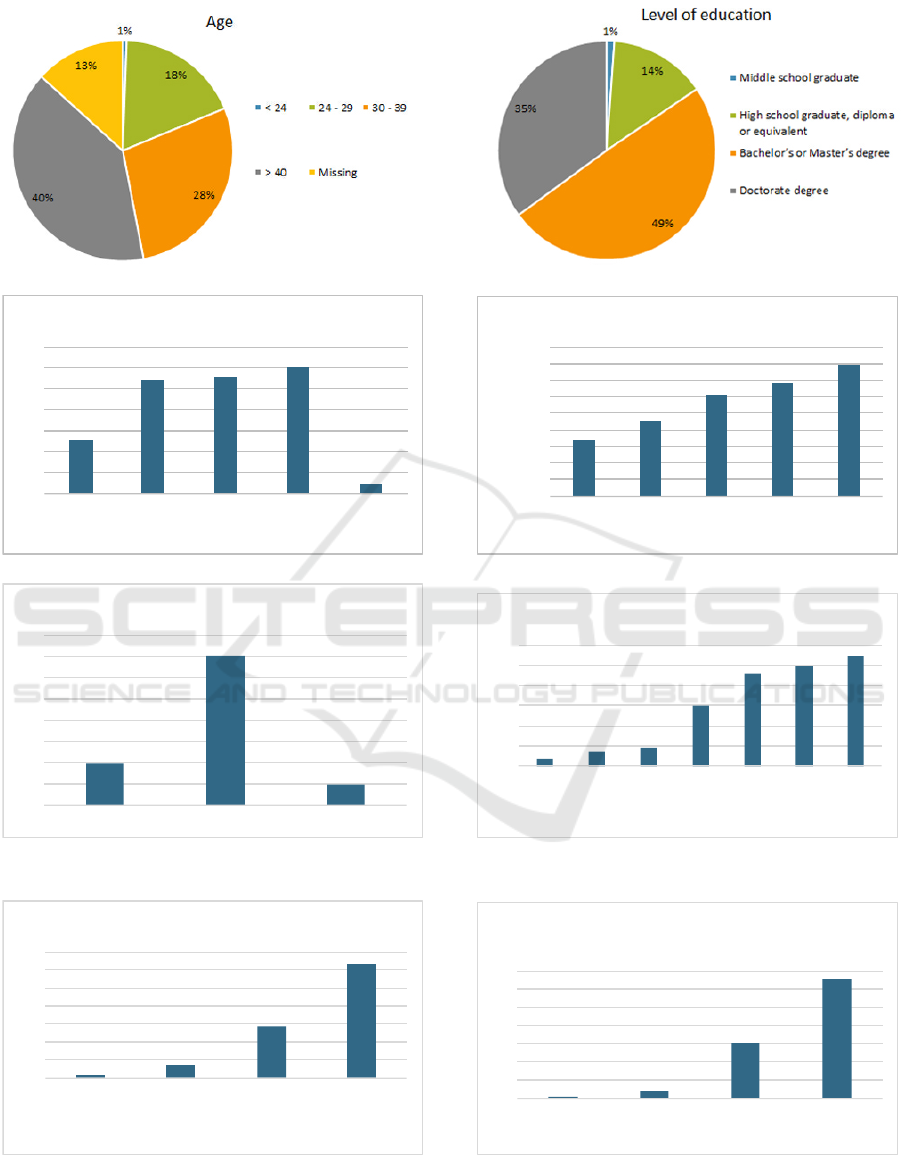
(a) Distribution of age of surveyed people. (b) Distribution of level of education of surveyed people.
13%
27%
28%
30%
2%
0%
5%
10%
15%
20%
25%
30%
35%
Under. 20k 20k.- 30k 30k.- 45k Over.45k Missing
Income'in' Euro
Yearly.income
(c) Percentage of yearly income (in Euro).
€"343"
€"452"
€"617"
€"680"
€"795"
0"€
100"€
200"€
300"€
400"€
500"€
600"€
700"€
800"€
900"€
1 2 3 4 over"5
Consumption* costs* (in*Euro)
Inhabitants
Average"ann ual"consumption " per"inhabitant
(d) Average consumption (in Euro) per inhabitant.
!"#
$"#
%"#
"#
%"#
!"#
&"#
'"#
("#
)"#
$"#
*"#
+,- ./ 01--123
4567,2,- -8/28699: 1 62;,-8,2,73<8;/2 -=>9 ?1/2
(e) Current awareness on appliances energy consumption.
!"
#"
$"
%$"
!&"
!$"
!'"
("
$"
%("
%$"
!("
!$"
&("
%))
*+,,-.-/0123
! & # $ 4
')*/-,5)
,-.-/0123
Per ceveid( r elevance
61-,75)0 80,-1-99):;,)0<<.+01=-9
(f) Perceived relevance on energy awareness for appli-
ances.
1%
7%
29%
63%
0%
10%
20%
30%
40%
50%
60%
70%
1+(not+ inter est ed )+ 2 3
4+(very+
interested)+
Declar ed( l evel( of( inter est
Reduce+energy+consumption+ to+save+money
(g) Declared level of interest on reducing energy consump-
tion to save money.
0%
4%
30%
66%
0%
10%
20%
30%
40%
50%
60%
70%
1*(not* interested)* 2 3 4*(very*in terested)*
Declar ed( lev el( of( i nterest
Reduce*energy*consumption* to*preserve*the*
environment
(h) Declared level of interest on reducing energy consump-
tion to preserve the environment.
Figure 1: Results of first survey.
SMARTGREENS 2017 - 6th International Conference on Smart Cities and Green ICT Systems
160
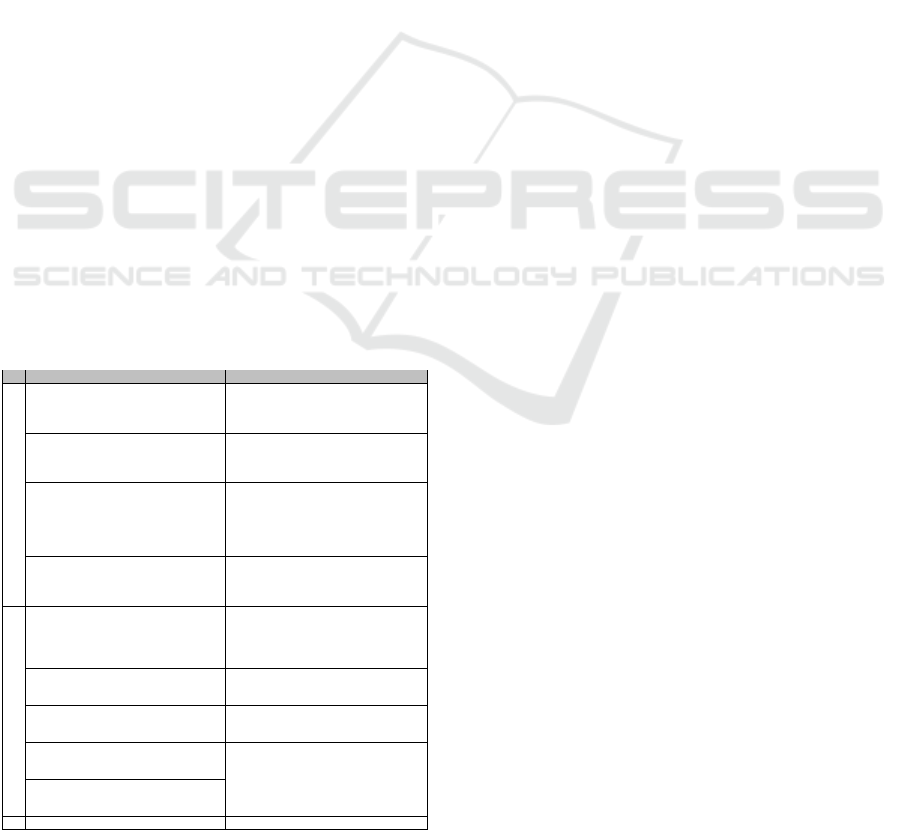
Figure 1(a) shows the age distribution of the sur-
veyed people. 47% are under 40 years old. Respec-
tively, 1% are under 24, 18% between 24 and 29 and
28% between 30 and 39 years old. On the other hand,
40% are over 40. The remaining 13% did not an-
swer the question. Figure 1(b) highlights that 84%
of users have a high level of education (respectively,
49% have a bachelor’s or master’s degree and 35% a
doctorate degree). Then, 14% are high school gradu-
ated (diploma or equivalent) and almost 1% are mid-
dle school graduated.
Figure 1(c) reports the yearly income in Euro,
grouped into four ranges. As it can be gathered
from the figure, the distribution on the highest income
ranges (respectively, 20k-30k, 30k-45k and over 45k)
is almost uniform, between 27% and 30%. Only 13%
of the users declared an income under 20k.
Figure 1(d) reports the average annual consump-
tion expense in Euro. This Figure reveals that the ex-
pense rises proportionally with the number of inhab-
itants. Indeed, the impact of each additional inhabi-
tant on the yearly consumption is about e100. This
observation stems from correlating the outcomes of
question 3 (How many people live with you (includ-
ing you)?) and question 5 (How much did you spend
on electricity bills in the past 12 months?).
Figure 1(e) highlights that 70% of users are not
aware of their energy consumption and they do not
know how much they spend for each appliance.
Hence, knowing the consumption of each appliance
is relevant for 75% of the total users, as revealed in
Figure 1(f).
Table 1: Questions proposed during the first survey.
Question Answers
Personal Information
1. What is your age?
under 24 years old
24-29 years old
30-39 years old
over 40 years old
2. What is the highest degree or level
of education you have completed?
middle school graduate
high school graduate, diploma or equivalent
bachelor’s or Master’s degree
doctorate degree
3. How many people live with
you (including you)?
1
2
3
4
5
over 5
4. What is your yearly income?
under 20k
20k - 30k
30k - 45k
over 45k
Energy Consumptions
5. How much did you spend on electricity
bills in the past 12 months?
under 300
300 - 499
500 - 699
700 - 999
over 1000
6. Do you know exactly how much you
consume and how much you spend
for your appliances?
yes, I do
no, I do not know
7. How relevant is it for you to be aware on
energy consumption and costs of
your appliances?
choose between 1 (irrelevant)
and 7 (very relevant)
8. Are you interested in reducing your
consumption because you would reduce
your monthly bill?
choose between 1 (not interested)
and 4 (very interested)
9. Are you interested in reducing your
consumption because you would help
reducing pollutant emissions?
10. Do you have any additional comment? open answer
Finally, Figure 1(g) reports that 92% of users are
interested in reducing energy consumption because
they want to cut their monthly bills. This percent-
age raises to 96% if the reason to reduce energy con-
sumption changes in decreasing pollutant emissions,
as shown in Figure 1(h).
Correlating the answers on demographic variables
(i.e. age, level of education, yearly income and yearly
average consumption in Euro), the resulting analysis
highlights that people are interested on having general
information on energy consumption. In detail, 96%
of the surveyed people with an age between 24 and 29
years old declared an high interest. Increasing the age,
interest decreases. Indeed, in 93% of users with an
age between 30 and 39 years old declared a medium-
high interest for energy-related information. From the
level of education viewpoint, energy awareness is per-
ceived relevant for 94% and 95% of surveyed people
with high school diploma and Bachelor’s or Master’s
degree respectively. Considering the average annual
consumption, the general interest is around 95% for
users with yearly expense among e500 and e699 on
electricity bills. This decreases to 88% for users in
the range of e700 and e999. Focusing on having de-
tailed information on the energy awareness for each
single appliance, there is greater interest: i) among
users between 24 and 29 years, about 82%; ii) among
graduated, about 79%; and iii) among people with a
yearly expense between e500 and e699, about 79%.
On the other hand, disaggregated information raises
less interest among people i) over 40 years old, about
69%; and ii) with a yearly income over 45ke, about
68%.
Finally among the last question replies (Do you
have any additional comment?), many people sug-
gested to include information about energy produc-
tion of their renewable plants (e.g. Photovoltaic sys-
tems). They also would like to be recommended
on optimizing self-consumption, thus maximizing the
use of their renewable systems.
3.2 Requirements Focus Group
The second step of our research was a face-to-face fo-
cus group that involved six graduated people between
30 and 35 years old. It has been organized as an open
discussion among the participants with a moderator.
The purpose of this focus group was to deepen qual-
itative information that were difficult to identify with
on-line surveys. Thus, the moderator addressed the
discussion on topics about i) consumer habits, ii) per-
ception and awareness on energy consumption, iii) in-
terest in energy efficiency and iv) relations with the
energy provider.
A Participatory Design Approach for Energy-aware Mobile App for Smart Home Monitoring
161
The focus group highlighted that participants are
not aware of monthly and yearly energy consump-
tions. However, they know approximately the aver-
age bill expenses. Indeed, they refer to their bills to
roughly verify if energy consumptions are coherent
with the amount to pay. Furthermore, the participants
stressed that bills are difficult to read. Sometimes,
consumers distrust their energy providers. For exam-
ple the electricity market is perceived as something
very complex. The energy provider is seen as a dis-
tant entity that should limit its role to strictly provide
electricity.
Regarding energy-awareness, participants think
that such solutions should not be invasive and end-
users should choose the notifications to receive and
their frequency. A good compromise, raised during
the discussion, is receiving a weekly update of main
notifications, again chosen by users. Moreover, par-
ticipants consider useful that such notifications guide
them into a gradual change of their habits towards vir-
tuous behaviours. To facilitate this changes, they also
underline that notifications should encourage users
with positive reinforcement rather than negative with-
out stressing incorrect habits.
Finally, from this focus group raised that partici-
pants are not concerned by privacy issues. They de-
clare to be almost resigned in providing their sensitive
information. However, they would not like to receive
advertising messages, for example, by their energy
supplier.
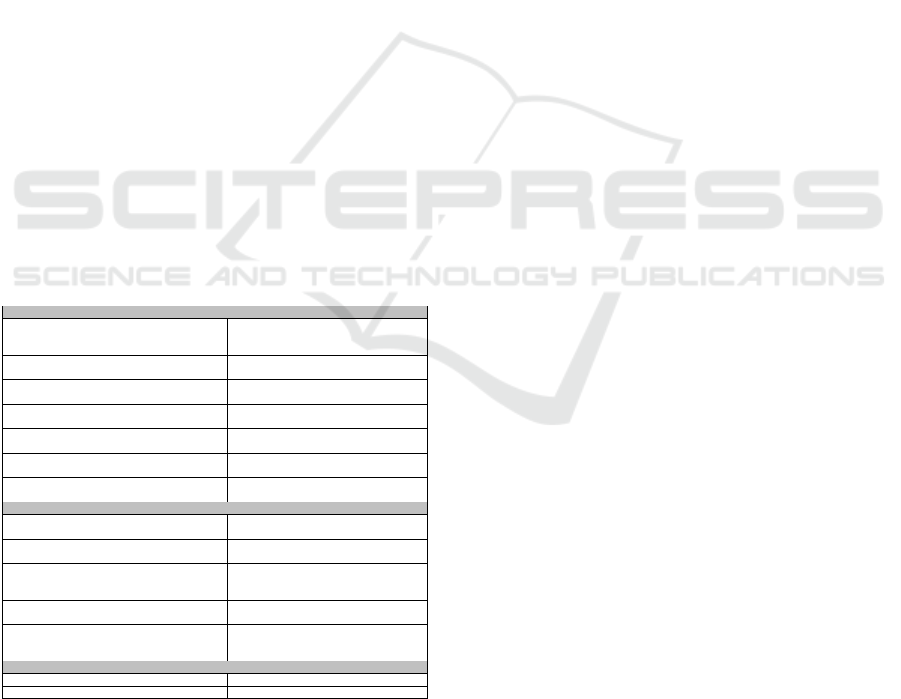
Table 2: Questions proposed during the second survey.
Give a rating between 1 (not interested) and 10 (very interested) to the following services
Knowing in real-time and in every moment what
my appliances consume and how much I pay
for them
Having a novel and innovative tool
Knowing the energy consumption (and spending
money) of my appliances on a daily basis
Protect the environment by reducing energy
consumption
Knowing the energy consumption (and spending
money) of my appliances on a weekly basis
Evaluating if my supply contract is the best
for me
Having during the month a forecast of the cost
of the next bill
Receiving offers and promotions from my
energy supplier
Receiving reports on malfunctioning or inefficient
appliances
Having the chance to join purchasing groups
with people who have my same needs
Receiving personalized tips to figure out how
to better consume and spend
Checking if my bill match my consumption
Understand if my consumption are in line with
those of other similar families
Select notifications you are interested in (max 3)
An appliance is faulty or operates incorrectly
My spending threshold has been exceeded
for the current month
I am going to reach the maximum power threshold
A particularly inefficient appliance has
been identified
There is a new custom hint to save money (e.g.
Switches from 4 to 3 weekly washes with your
washing machine to save 80 in one year)
Washer/dishwasher finished washing
or the food is ready (microwave/oven)
There is a device unusually turned on by too
many hours
There are interesting news from the
world of energy
I am not at home and an unusual electrical
activity was detected (e.g. lights on)
There are commercial offers for me
about tariffs, energy efficient appliances,
tools and technologies
Select notification frequency you prefer (max 1)
Daily Weekly
Never I choose
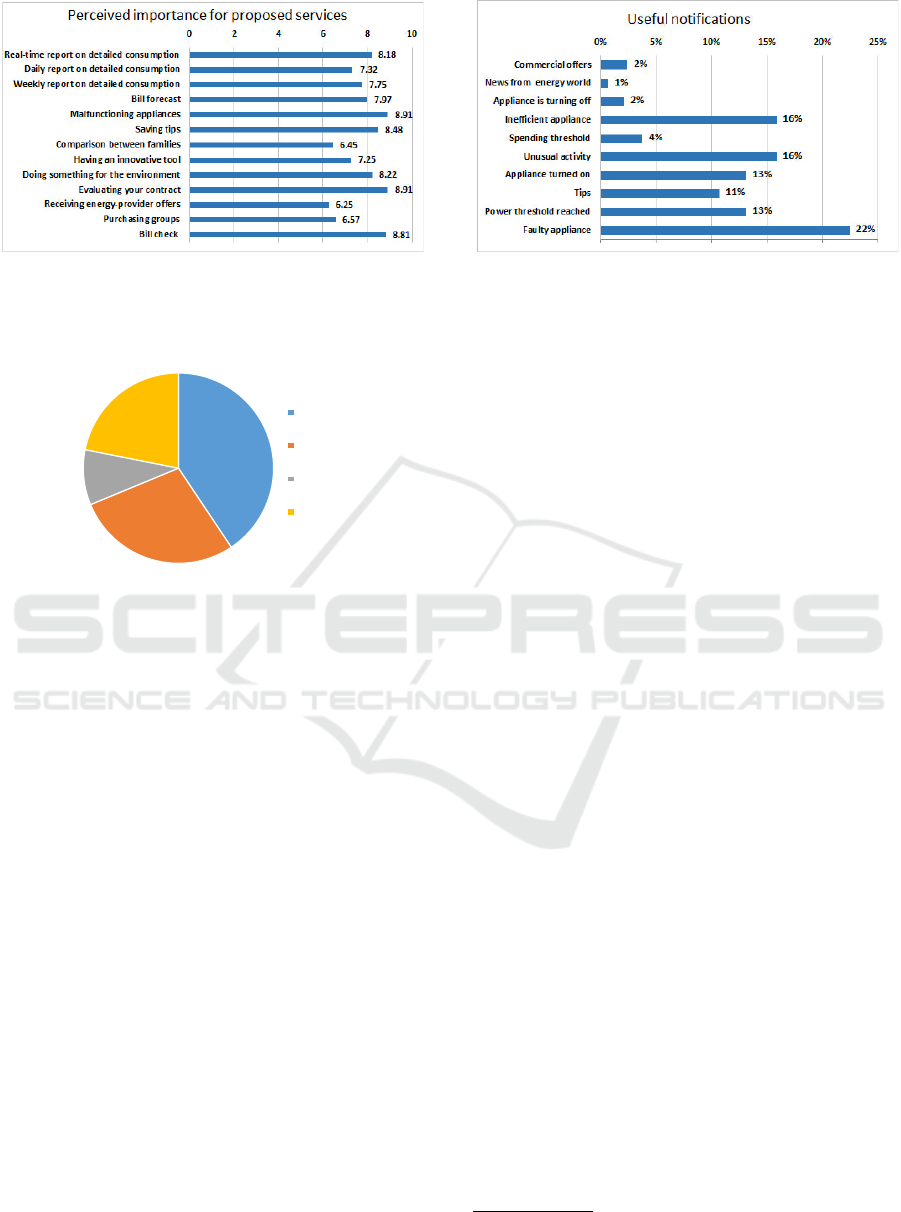
3.3 Requirements Survey
The last step of our research was a second on-line
survey to identify the main features requested by end-
users. Table 2 reports this second survey that involved
100 persons. Questions are grouped in three macro-
areas. Regarding the first macro-area, the participant
had to give a rating between 1 (not interested) and
10 (very interested) among the thirteen possible ser-
vices such user-awareness system could provide. Fig-
ure 2(a) reports the results of this question. It de-
picts that all proposed services are perceived as im-
portant by users. Indeed, the average rank is over 6
with a maximum of 8.91 for Malfunctioning appli-
ances and Evaluating your contract. As regards the
second macro-area, participants were invited to select
a maximum of three out of ten notifications they per-
ceive as useful. The achieved results are shown in Fig-
ure 2(b). They range from 1% to 22%. In our analysis,
we chose to neglect notifications below 10% of inter-
est rate. The perceived most important are: i) Faulty
appliance (22%), ii) Inefficient appliance (16%) and
iii) Unusual activity (16%). Finally, the third macro-
area required to select the preferred notification fre-
quency among: i) Daily, ii) Weekly, iii) Never and iv) I
choose. As shown in Figure 3, participants prefer to
choose by themselves the notification frequency.
From the presented results of the focus group
and both on-line surveys, we identified the functional
requirements exploited to design and develop the
Android application for energy-awareness in Smart
Home presented in Section 4.
4 ENERGY-AWARENESS APP
FOR SMART HOME
MONITORING
The identification of end-users’ needs and require-
ments are done through a participatory design ap-
proach allows defining guidelines to implement
an ergonomic energy-aware application for Smart
Home Monitoring that leverages upon our distributed
Software Infrastructure for Smart Metering called
FLEXMETER (Pau et al., 2016). FLEXMETER is
distributed platform that i) integrates heterogeneous
information of multiple energy vectors (e.g. electric-
ity, water, gas and heating); ii) correlate and post-
process data of different utilities; iii) provide ad-
vanced services to different stakeholders. In this view,
smart meters send data to FLEXMETER through the
Internet, thus becoming IoT devices (Schultz et al.,
2015), (Bahmanyar et al., 2016). To achieve our pur-
pose, we deployed our prototype Smart Meters at cus-
tomer premises. They are based on a Raspberry Pi
enhanced with an additional board to measure every
second both active and reactive power and send these
SMARTGREENS 2017 - 6th International Conference on Smart Cities and Green ICT Systems
162
(a) Decalred perceived importance for proposed services. (b) Declared preferences on useful notifications.
Figure 2: Results of second survey.
41%
28%
9%
22%
Notification/frequency
I/choose
Daily
Weekly
Never
Figure 3: Declared preferences on notification frequency.
collected data every 15 minutes.
Figure 1(a) shows that 47% of users surveyed are
under 40 years. Thus, we developed an application for
mobile smartphones and tablets equipped with An-
droid operating system. This app address the func-
tional requirements identified in Section 3 through a
participatory design approach.
The purpose of this application is to increases
user-awareness and promotes green behaviors allow-
ing end-users to have a complete overview of their
energy profiles. Knowing the itemized consumption
means having the necessary actionable feedback in-
formation to propose for reducing the energy waste
(Faruqui et al., 2010).
As shown in Figure 2(a), generally benefits for
end-users are summarized in the following: i) having
a complete control of their energy profile through sim-
ple and intuitive interface; ii) knowing the energy pro-
duction from renewable sources; iii) comparing the
energy production of renewable sources among dif-
ferent weeks, months or years; iv) knowing the disag-
gregated energy of the household appliances; v) dis-
covering which appliance is the most inefficient one;
vi) comparing the disaggregated appliance consump-
tion among different weeks, months or years; vii) ob-
serving the energy consumption in (near-) real-time to
monitor the apartment and receive alarms whenever
the energy situation is not as expected.
Through a simple and intuitive interface, compli-
ant with the Android development standards, users
can access to all provided data by i) a Non-Intrusive
Load Monitoring (NILM) platform (Zoha et al.,
2012), which is a service provided by FLEXMETER
and ii) smart meters or appliances (e.g. smart plugs).
These data refer to electricity consumption and pro-
duction. To provide a complete overview of all en-
ergy consumptions in a Smart Home, we extend both
FLEXMETER and the Android app to other energy
vectors (i.e. gas, water and heating). These en-
ergy vectors are part of the considered case study.
FLEXMETER flexibility allows the integration of any
other energy measure. Therefore, adding services re-
lated to new energy vectors is possible to characterize
a complete energy-profile for each customer. Infor-
mation is retrieved by FLEXMETER through REST
web services (Fielding and Taylor, 2002) and all
the communication flows are authenticated through a
token-based mechanism.
After the user authentication, the Main Activity
4
(Figure 4(a)) shows the logged user energy-profile.
The user energy-profile is represented as a collection
of energy vectors monitored through smart meters in
apartments. In detail, this activity presents instan-
taneous consumption and production for each mon-
itored energy vector. Such information is shown to
users using different indexes (unit of measurement,
costs and emitted CO
2
footprints) to involve and sen-
sitize the end-user (Wiedmann and Minx, 2008) (see
Figure 1(g) and Figure 1(h)).
Selecting an energy vector on the Main Activity,
the user accesses to the relative Consumption Activ-
ity. As shown in Figure 4(b), this activity presents
widgets to provide a detailed overview on energy con-
sumption and pollution using different indexes. The
same activity is used in case of renewable energy pro-
4
An Activity in Android is a software window that is
usually displayed in full-screen mode.
A Participatory Design Approach for Energy-aware Mobile App for Smart Home Monitoring
163
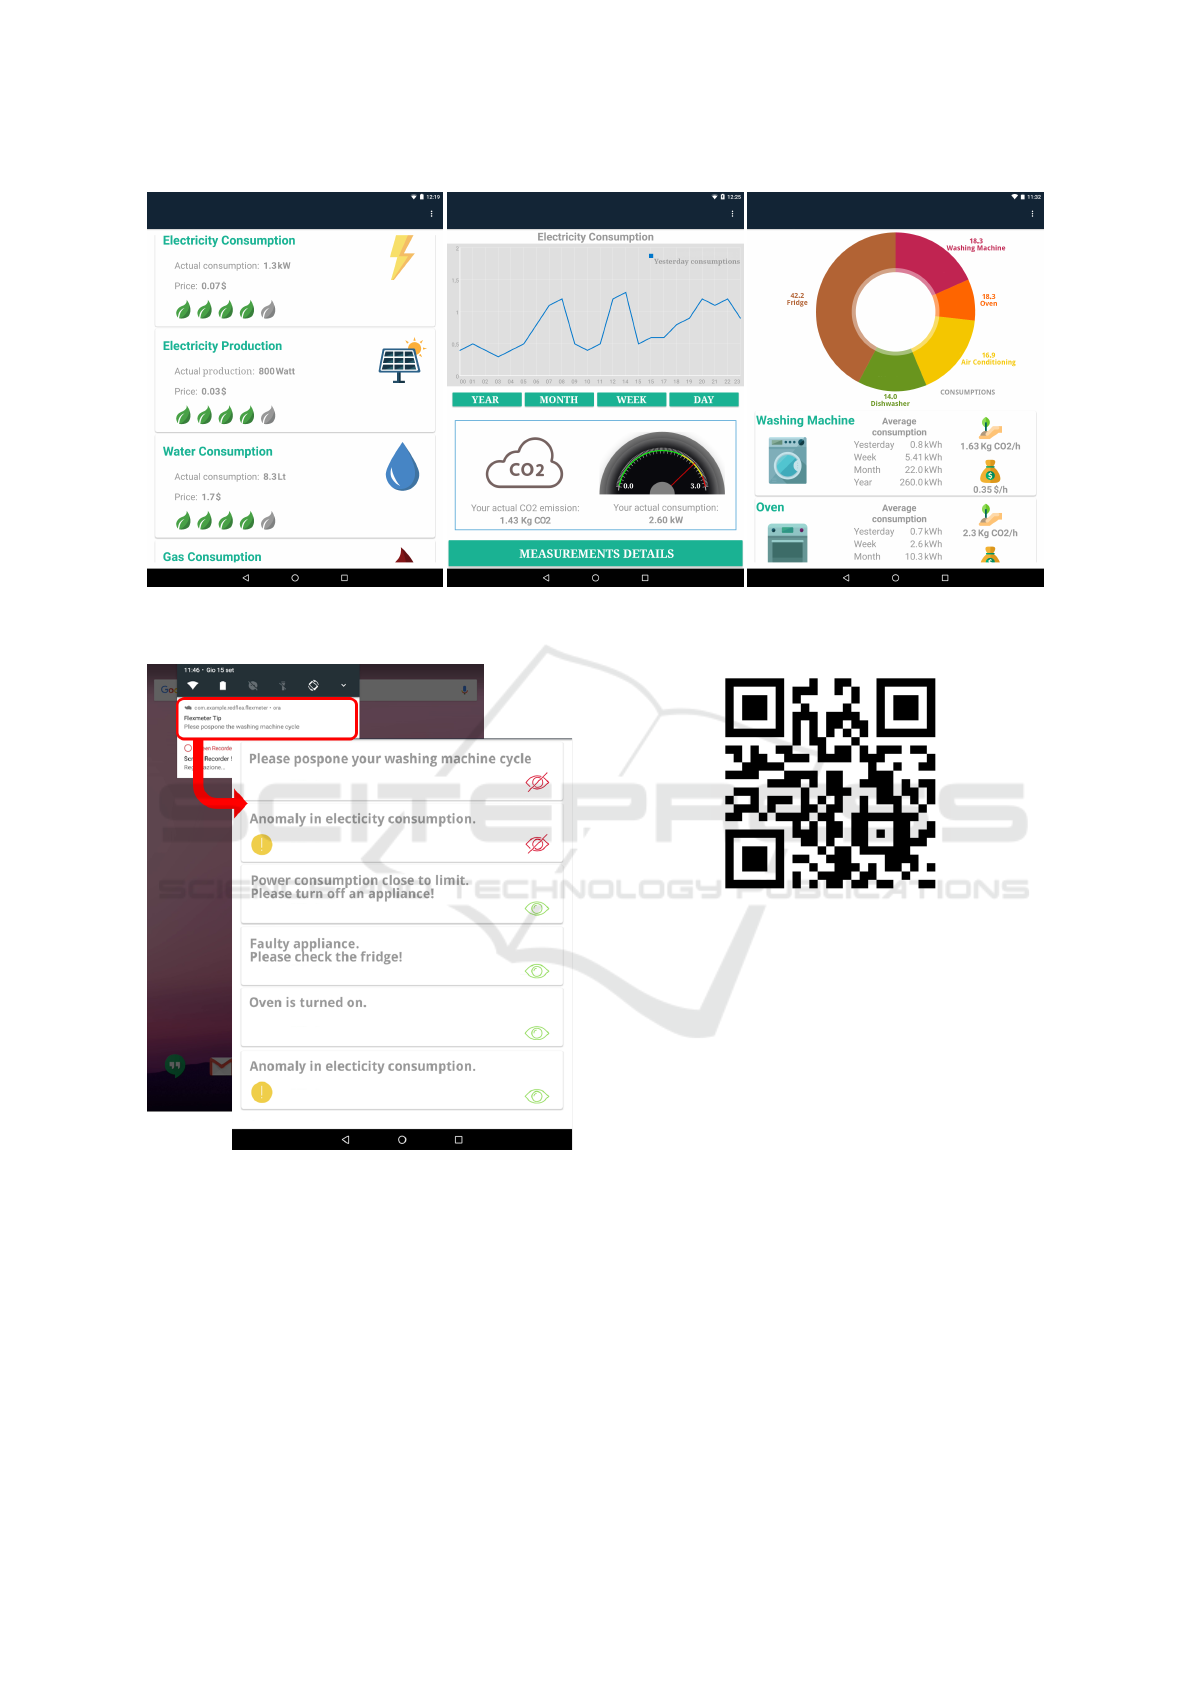
(a) Main Activity. (b) Consumption Activity. (c) Detailed Consumption Activity.
Figure 4: Example of activity views visualized with the Android mobile application.
Figure 5: Tips and Warnings Activity.
duction (e.g. photovoltaic systems) and data are up-
dated accordingly. Furthermore, FLEXMETER pro-
vides historical data for each energy vector. To better
know the energy performance, these data with differ-
ent granularity: daily, weekly, monthly or yearly.
The Detailed Consumption Activity (see Fig-
ure 4(c)) provides disaggregated data for each home
appliances retrieved from the NILM module and/or
smart appliances via FLEXMETER. Through an ap-
propriate conversions, this feature allows knowing en-
ergy consumption in costs and pollution indexes to
Figure 6: Video of the present Android App for User-
Awareness.
have a complete control of home appliances. Just at
the first visual impact, user knows the whole energy
consumption for the appliances through a pie chart.
Then, a list details more specific information for each
appliance is given (e.g. i) daily, weekly, monthly and
annual average consumption, ii) hourly pollution and
iii) hourly consumption expense), also to provide in-
formation on their operating status at any time.
As shown in Figure 5 through a notification
system, the user receives tips and warnings from
FLEXMETER. During both on-line surveys and fo-
cus group, participants have expressly requested a
tool to optimize self-consumption by maximizing the
use of their renewable energy systems (e.g. Photo-
voltaic panels). The proposed app is ready to notify
prosumers, recommending the best time-slots to turn
on appliances according to electricity self-production.
Finally, based on the requirements reported in Fig-
ure 2(a), Figure 2(b), and Figure 3, during the first
application set-up, users can choose the receiving no-
tifications frequency. This functionality is empow-
SMARTGREENS 2017 - 6th International Conference on Smart Cities and Green ICT Systems
164

ered by Google Firebase push notification system
5
that allows developers to organize a flexible notifi-
cation platform. In addition, the Tips and Warnings
Activity shows all tips received, highlighting unread
messages (see Figure 5).
Finally, to provide a demo of the proposed app, a
video is available on YouTube: just scan the QR code
in Figure 6 and click on the resulting link
6
.
5 CONCLUSIONS AND FUTURE
WORKS
In this paper, we presented the participatory de-
sign methodology we followed to develop an energy-
aware app for Smart Home monitoring. We discussed
the results of two on-line surveys and a focus group to
identify the functional requirements for the proposed
app. These kind of interviews are needed to design
software to promote green behaviours, which is not a
trivial task. We also introduced the developed app that
leverages upon a Smart Metering Infrastructure. Such
infrastructure is needed to collect energy-related data
before providing post-processed information to end-
user apps. As future work, we spread this solution
to citizens to evaluate the acceptance level of user on
proposed suggestions, tips and alerts to promote vir-
tuous behaviours.
ACKNOWLEDGMENTS
This work was partially supported by the EU project
FLEXMETER, by Siebel project ”POWER AWARE
- Lights off, brains on” and by the Italian project ”Ed-
ifici a Zero Consumo Energetico in Distretti Urbani
Intelligenti”.
REFERENCES
Bahmanyar, A., Jamali, S., Estebsari, A., Pons, E., Bom-
pard, E., Patti, E., and Acquaviva, A. (2016). Emerg-
ing smart meters in electrical distribution systems:
Opportunities and challenges. In 24th Iranian Confer-
ence on Electrical Engineering (ICEE), pages 1082–
1087. IEEE.
Carmigniani, J., Furht, B., Anisetti, M., Ceravolo, P., Dami-
ani, E., and Ivkovic, M. (2011). Augmented reality
technologies, systems and applications. Multimedia
Tools and Applications, 51(1):341–377.
5
https://firebase.google.com/
6
https://youtu.be/JdwzvpgvOeQ
Endsley, M. R. (2011). Designing for Situation Awareness:
An Approach to User-Centered Design, Second Edi-
tion. CRC Press, Inc., Boca Raton, FL, USA.
Faruqui, A., Sergici, S., and Sharif, A. (2010). The impact
of informational feedback on energy consumption sur-
vey of the experimental evidence. Energy, 35(4):1598
– 1608.
Fielding, R. T. and Taylor, R. N. (2002). Principled design
of the modern web architecture. ACM Trans. Internet
Technol., 2(2):115–150.
Gra
˜
na, M. and Toro, C. (2012). Advances in knowledge-
based and intelligent information and engineering
systems, volume 1. IOS press.
Jacucci, G., Spagnolli, A., Gamberini, L., Chalambalakis,
A., Bj
¨
orkskog, C., Bertoncini, M., Torstensson, C.,
and Monti, P. (2009). Designing effective feedback
of electricity consumption for mobile user interfaces.
PsychNology Journal, 7(3):265–289.
Jahn, M., Jentsch, M., Prause, C., Pramudianto, F., Al-
Akkad, A., and Reiners, R. (2010). The energy aware
smart home. In Proc. of FutureTech.
Jahn, M., Schwartz, T., Simon, J., and Jentsch, M. (2011).
EnergyPULSE: tracking sustainable behavior in office
environments. In Proc. of ACM e-Energy.
Pau, M., Patti, E., Barbierato, L., Estebsari, A., Pons, E.,
Ponci, F., and Monti, A. (2016). Low voltage system
state estimation based on smart metering infrastruc-
ture. In IEEE AMPS, pages 1–6.
Reiners, R. and Jentsch, M. (2009). Discovery and interac-
tion in smart environments. Ambient Intelligence and
Human Security, pages 135–138.
Ritzer, G. and Jurgenson, N. (2010). Production, consump-
tion, prosumption the nature of capitalism in the age
of the digital prosumer. Journal of consumer culture,
10(1):13–36.
Schultz, P. W., Estrada, M., Schmitt, J., Sokoloski, R., and
Silva-Send, N. (2015). Using in-home displays to pro-
vide smart meter feedback about household electricity
consumption: A randomized control trial comparing
kilowatts, cost, and social norms. Energy, 90, Part
1:351 – 358.
Stevens, G. and Nett, B. (2009). Business ethnography
as a research method to support evolutionary design.
Schnitte durch das Hier und Jetzt, Zeitschrift Naviga-
tionen, 2(09).
Wiedmann, T. and Minx, J. (2008). A definition of carbon
footprint. Ecological economics research trends, 1:1–
11.
Zoha, A., Gluhak, A., Imran, M. A., and Rajasegarar, S.
(2012). Non-intrusive load monitoring approaches for
disaggregated energy sensing: A survey. In Sensors.
A Participatory Design Approach for Energy-aware Mobile App for Smart Home Monitoring
165
