
Big Data & Analytics to Support the Renewable Energy Integration
of Smart Grids
Case Study: Power Solar Generation
Guillermo Escobedo, Norma Jacome and G. Arroyo-Figueroa
Instituto Nacional de Electricidad y Energías Limpias, Reforma 113, Cuernavaca, Morelos, Mexico
Keywords: Big Data, Smart Grid, Renewable Energy, Distributed Generation, Photovoltaic Systems, Electric Power
Utility, Information Systems, Data Analytics.
Abstract: Smart Grid is the modernization of electrical networks using intelligent systems and information technologies.
In smart grid environment, the application of big data analytics based decision support and intelligent control
are mainly in the following four aspects: power generation side management, micro grid and renewable energy
management, asset management and collaborative operations, and demand side management. The objective
of this research is to present a technological infrastructure for the management of large volumes of information
through Big Data tools to support the integration of renewable energy. The infrastructure includes a
methodological architecture for the acquisition, processing, storage, management, analysis, monitoring and
forecast of large amounts of data. The development of a Big Data application for the analysis and monitoring
of the information generated by photovoltaic systems is included as a case study. Solar generation
technologies have experienced strong energy market growth in the past few years, with corresponding
increase in local grid penetration. The goal is to have timely information to make better decisions to improve
the integration of renewable energy in the Smart Grid.
1 INTRODUCTION
The electricity market of Mexico carries out a
structural change based mainly on the generation with
clean energies. México has establish ambitious goals
to increase the use of renewable energy sources and
clean technologies to generate electricity, as part of
efforts to promote energy efficiency and
sustainability and reduce dependence on fossil fuels
as a primary energy source. As goal, it has
estableshed that in 2024, the generation of electricity
through clean energy will be of 35% (SENER, 2013).
Many sources of clean energy, including solar and
wind, offer significant advantages, such as no fuel
cost and no emissions from generation. The high level
of incident solar radiation in Mexico encourages the
use of solar energy (SENER, 2013). A solar plant is
the conversion of sunlight into electricity, either
directly using photovoltaics (PV) or indirectly using
concentrated solar power. Solar has been recently
been beneficiary of a number of large-scale initiatives
in Mexico y USA (for example California). Currently
the largest solar power plants (Solar Star California)
can generate more of 500 MW. However, the solar
source are variable, nom-dispatchable and
unpredictable. The output power of a large-scale solar
plant varies over the time. The system operator has
very limited control of the output of large-scale solar
plant. Finally, it is difficult to forecast the power
generation of solar plant of each day. The power
output of solar plant is affected by differents weather
conditions.
In order to decrase the uncertainty of power output
power of solar plant, this paper presents the
application of Big Data Analytics to monitor and
forecast the power generation of solar plants.
Accurate forescasting of solar plant power output can
reduce the impact of power output uncertanty on the
grid, improve the system reliability, maintain power
quality and increase the penetration level of the power
solar plants in power grid.
The rest of the paper is divided into following
sections. Section 2 describes the challenges of the
traditional power grid with the integration of
distributed generation sources with renewable
resources. Section 3 shows the technologic
infrastructure of Big Data for the ingestion,
Escobedo, G., Jacome, N. and Arroyo-Figueroa, G.
Big Data & Analytics to Support the Renewable Energy Integration of Smart Grids - Case Study: Power Solar Generation.
DOI: 10.5220/0006297502670275
In Proceedings of the 2nd International Conference on Internet of Things, Big Data and Security (IoTBDS 2017), pages 267-275
ISBN: 978-989-758-245-5
Copyright © 2017 by SCITEPRESS – Science and Technology Publications, Lda. All rights reserved
267
processing, storage, analysis and real-time
monitoring of statistical information for decision-
making. It includes the proposal of an architecture for
the implementation of related projects in this area.
Section 4 presents a case study of the application of
Big Data in the monitoring and analysis of the
information generated by photovoltaic systems.
Finaly, section 5 summarizes the main ideas
presented in this article.
2 SMART GRID
A power grid is an interconnected network for
delivering electricity from supplier to end user. The
modernization of the electrical grid is known as the
Smart Grid. The NIST defines as smart grid how a
modernized grid that enables bidirectional flows of
energy and uses two-way communication and control
capabilities that will lead to an array of new
functionalities and applications (NIST 2010). Smart
Grid is a power grid that employs digital information
and control technologies to facilitate the deployment
and integration of distributed and renewable
resources (wind, solar, etc), smart consumer devices,
automated systems, electricity storage and peak-
saving technologies.
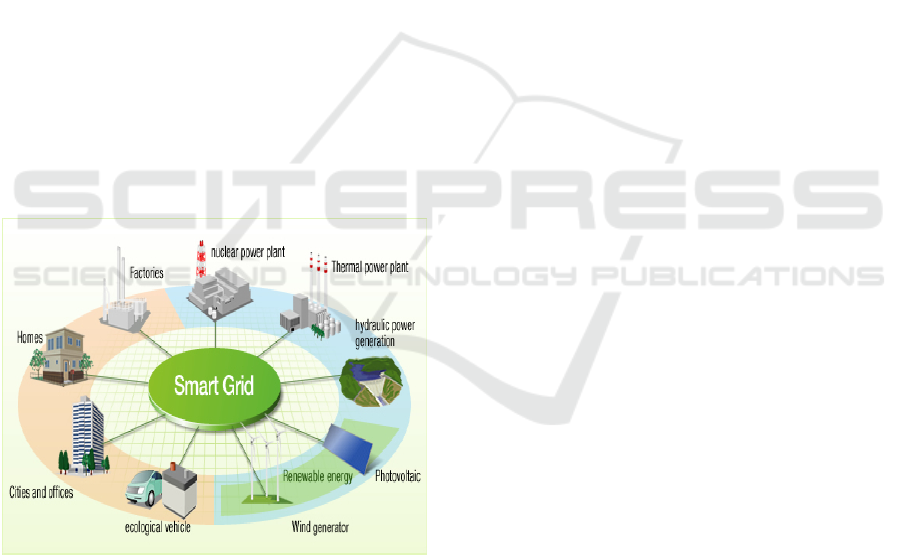
Figure 1: Smart Grid.
The vision corresponds to an electrical network in
constant development, in real-time, with a two-way
flow of energy and information, between the power
generator, the network operator and the end
consumers. This has the ability to integrate all new
and traditional players, units of renewable generation
(wind, solar, among others.), electric vehicles,
electricity storage and smart cities (IEA, 2011).
The general objectives of Smart Grid are reducing
the negative impact on the environment, reduce
dependence on non-renewable natural resources and
increase energy security through the diversification of
distributed generation sources with renewable
energies. Smart Grid technology can significantly
reduce the barriers to large-scale integration of
renewable resources in the electrical network (CRE,
2014).
Currently, the power grid is facing various
challenges, such as challenges in operational
efficiency and cost control, system stability and
reliability, renewable energy management, energy
efficiency and environmental issues, as well as
consumer engagement and service improvement. To
deal with these challenges, it is necessary to manage
large volumes of information and process this
information for operational and corporate decision
making. In smart grid, large amounts of and various
types of data, such as device status data, electricity
consumption data, and user interaction data, are being
collected. Then, many data analysis techniques,
including optimization, forecasting, classification,
and clustering, can be applied on the large amounts of
smart grid data.
To face the enormous challenge of handling large
volumes of data from distributed generation sources
in the Smart Grid, there are different technologies that
fall under the term Big Data. These technologies
allow the obtaining of value through the intelligent
interpretation of data.
Big data will change the way of energy production
and the pattern of energy consumption. Based on big
data analytics, smart grid can detect and restore from
failures rapidly, response electricity demand quickly,
supply more reliable and economical energy, and
enable customers to have more control over their
energy use. Big data analytics can provide effective
and efficient decision support for all of the producers,
operators, customers and regulators in smart grid.
Big data have the characteristics of “4V” (volume,
velocity, variety and value. For the case of smart grid,
their “4V” characteristics are reflected in the
following aspects (Zhou, 2016):
Volumen. There are a massive amount of data by
the introduction of smart metering devices and
intelligent sensors in the power grid.
Velocity. In smart grid the speed of data collection
and processing are very fast ranging from sub-second
interval to minutes interval.
Variety. In smart grid environment, the energy
data is a mix of structured, semi-structured (weather
data and Web services data) and unstructured data
IoTBDS 2017 - 2nd International Conference on Internet of Things, Big Data and Security
268
(customer behavior data and the audio and video
data).
Value. Smart grid data itself is meaningless unless
valuable knowledge that supports effective and
efficient decision makings throughout the energy
management process can be discovered.
In smart grid environment, the application of big
data analytics based decision support and intelligent
control are mainly in the following four aspects,
namely, power generation side management, micro
grid and renewable energy management, asset
management and collaborative operations, and
demand side management.
The renewable power sources can be described by
three major characteristics:
1. Variable. The output power of a wind, solar or
other renewable power plant varies over time.
2. Non-dispatchable. The system operator has a
very limited control output of large scale
renewable generation.
3. Energy source. Due to the non-dispatchable
nature of renewable generation, they generally
have a relatively low capacity credit.
This integration task of distributed generation
from renewable resources in the Smart Grid requires
systematic management of data.
3 BIG DATA INFRASTRUCTURE
The technological infrastructure of Big Data for the
management of the information of photovoltaic
systems is presented in this section.
This infrastructure must allow the ingestion,
processing, storage, analysis and monitoring of
statistical information in real time through
dashboards. The following requirements were
considered: real-time parallel processing, scalable
infrastructure (horizontal, vertical and fault-tolerant)
and distributed storage.
As part of the technological infrastructure, Big
Data architecture is proposed for the management of
information.
According to Mysore, Khupat, & Jain (2013), Big
Data architecture consists on different dimensions
and logical layers. Thus, the layers provide an
approach of components of the organization with
specific functions, as well as the components to be
used in a Big Data solution (Mysore, et al., 2013). In
this work an extension of the architecture of Big Data
proposed by Mysore was developed.
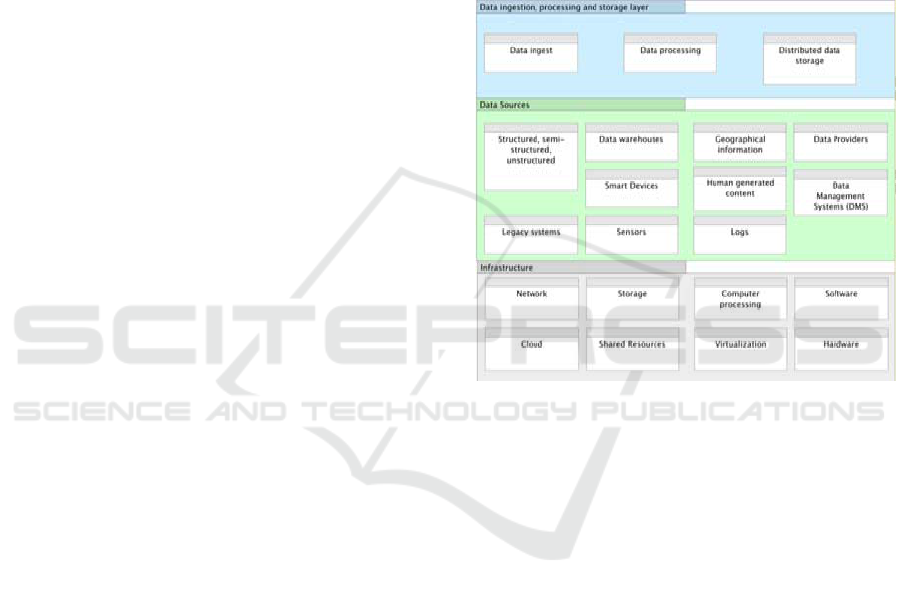
3.1 Infrastructure Layer
This layer contains the physical infrastructure
composed by hardware, network and other elements.
It is possible that a company has its data center or has
made heavy investments in physical infrastructure.
For this reason, the possibility of taking advantage of
existing assets for a Big Data project is contemplated.
It is important to establish some general principles for
the implementation of Big Data such as: performance,
availability, scalability and flexibility (Hurwitz, et al.,
2013).
Figure 2: Infrastructure, Data source and Data ingestion
layers.
3.2 Data Sources Layer
This layer includes all the data sources required to
solve the business problem. The data may vary
according to its format and origin:
Format: structured, unstructured, and semi-
structured.
Volume and Velocity: velocity of arrival and
sending data.
Acquisition of Data: acquisition of data in real
time or in batches.
Location of Source Data: data may be inside or
outside the organization.
The data come from all types of channels or
media, such as legacy systems, data management
systems, data warehouses, intelligent devices, data
providers and additional data sources.
Big Data & Analytics to Support the Renewable Energy Integration of Smart Grids - Case Study: Power Solar Generation
269
3.3 Data Ingestion, Processing and
Storage Layer
This layer is responsible for the ingestion
(acquisition), processing and storage of the data
source. It can also transform the data into a format
required for analysis.
Because the characteristics of the incoming data
may vary, the components in this layer must be able
to read data at various frequencies, formats, and sizes,
as well as in various communication channels.
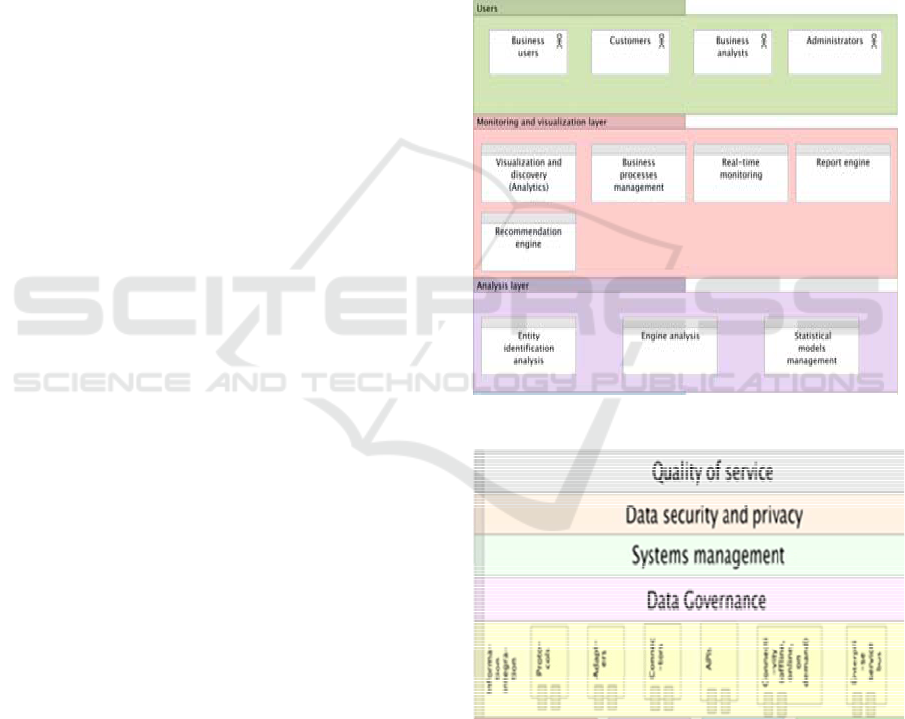
3.4 Analysis Layer
This layer is responsible for retrieving data digested
by the ingestion, processing and storage layer. In
some cases, the analysis layer accesses directly from
the data source. The components of this layer are:
Entity Identification Analysis: it is responsible
for identifying and filling contextual entities.
Engine Analysis: use other components
(specifically, entity identification, model
management and analytical algorithms) to
process and carry out the analysis.
Statistical Models Management: is responsible
for maintaining, validating and verifying several
statistical models.
3.5 Monitoring and Visualization
Layer
This layer consumes the business knowledge gained
from analytical applications, storage components and
in some cases directly from the data source. The
components of this layer are:
Visualization and discovery: allows browsing
through different data sources inside and outside
the company.
Business processes management: the
knowledge of the analysis layer can increase
business value by improving processes for IT
applications.
Real-time monitoring: it is possible to generate
real-time alerts.
Report Engine: its imperative to have the ability
to produce traditional reports.
Recommendation engine: these engines can
offer in real-time, relevant and personalized
recommendations.
3.6 Vertical Layers
The vertical layers support the aspects that affect all
the components of the logical layers:
Information integration: it is used by several
components of the logical layers and is
responsible for connecting to various sources.
Data Governance: refers to defining guidelines
that help companies make the right decisions
about the data.
Systems management: involves the monitoring
of the health of Big Data's global ecosystem.
Data security and privacy: these are the
policies required to protect sensitive data.
Quality of service: is responsible for defining
quality, frequency, size and filters of the data.
Figure 3: Analysis and monitoring and visualization layers.
Figure 4: Vertical layers.
4 CASE STUDY
The objective of Big Data is to provide new
knowledge to the company from the processing and
analysis of information. This new knowledge will
IoTBDS 2017 - 2nd International Conference on Internet of Things, Big Data and Security
270
help to support the business decision-making. This
section presents the results obtained from applying
Big Data in the integration of renewable energies into
the Grid.
The main benefits of the implementation of Big
Data technologies are:
Make better decisions with timely and reliable
information.
Show detailed information of the process of
generating electricity with renewable energy
through the analysis of historical and real-time
information.
Allow the data delivery in a dynamic and flexible
way through control panels.
As a result of the above, improve the the
integration of renewable energies in the Smart
Grid.
The case study considers the construction of a Big
Data infrastructure for the ingestion (acquisition),
processing, storage, analysis (descriptive analytics)
and monitoring (real time) of the information
generated by photovoltaic systems.
The building of the infrastructure is based on
existing technologies and available open source tools.
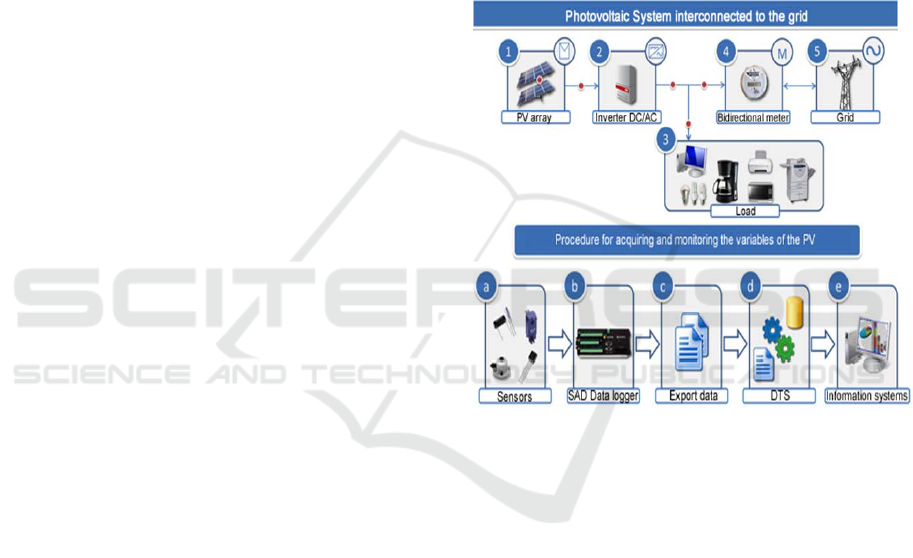
4.1 Photovoltaic System (PV)
In this section it is described the architecture of a
Photovoltaic System interconnected to the grid (PV);
as well as the different variables that are monitoring
to measure its operating performance.
Figure 5 shows the current PV architecture. There
are described the main components of the system, the
way it performs the interconnection with the
distribution network and the process of obtaining data
from sensors.
According to Figure 5, sunlight is converted into
direct current electricity by the photovoltaic array.
This direct current passes through the different
components until the investor turns it into alternative,
which can provide domestic consumption or send it
directly to the mains. There is a data acquisition
system (SAD) for the collection and storage of
information. The SAD measures electrical signals
from sensors (located in different components of the
system) at a sampling rate determined and stores it in
a flat file. This file is transported (exported) for
processing data that will be monitored and analyzed
by different users.
Importantly, the data stored in the SAD for each
of the variables were scheduled according to the
average value of 10 minutes of acquired values each
10 seconds.
According to experts of the Electrical Research
Institute of Mexico (INEEL) Management of
Renewable Energy, the implementation of the SFVI,
for its operation monitoring and performance
evaluation is subject to international practices and
recommendations (IEC 61215, IEC 61730, UL 1703)
for the execution of this type of activity in particular.
4.1.1 Measurement Variables PV
For measuring the operating performance of
photovoltaic systems 22 basic variables (obtained
directly from the SAD), which are listed below, are
monitored:
Figure 5: Architecture of the PV.
Three climatic variables: ambient temperature,
solar irradiance and irradiance on the horizontal
plane of the array.
In each PV array: current, voltage, power and
temperature.
To the inverter output current, active power and
reactive power.
In each of the grid lines (L1 and L2): active
power and reactive power, both input and output,
as well as the voltage between lines
From the measured variables directly from SAD
other variables that provide important additional
information to measure the operational performance
of PV are calculated. These derived variables are
classified according to four groups: solar radiation,
power, performance indicators and environmental
benefits.
Big Data & Analytics to Support the Renewable Energy Integration of Smart Grids - Case Study: Power Solar Generation
271
4.2 Implementation of the Case Study
Logical layers group the various components that
integrate the Big Data architecture of the prototype:
infrastructure, data sources, ingestion layer,
processing, storage, analysis and monitoring and
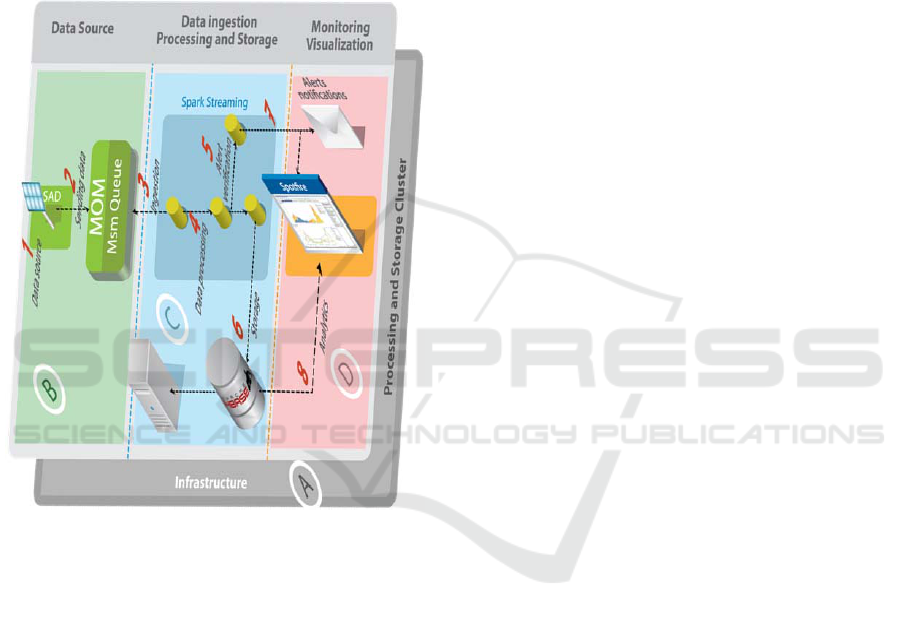
visualization layer. Figure 6 shows the
implementation of the Big Data architecture proposed
for this work, as well as the complete flow of
information. In general, the flow of information
consists of the following steps:
Figure 6: Implementation of the architecture applied to the
photovoltaic system.
1. Data acquisition: As a requirement to validate
and test the Big Data infrastructure, it was
necessary to develop a simulator to generate real-
time data and produce data for each of the 22
variables (power, current, voltage, temperature,
irradiance, etc.) according to the average value of
10 minutes of measurements acquired every 10
seconds. Also, estimated failure and recovery
times are simulated to generate abnormal
operation alerts.
2. Sending data: the simulator sends the data to the
MOM, Message Oriented Middleware. The
messaging broker is used as an application to
exchange information between the SAD
simulator (SAD-S) and Spark Streaming.
3. Ingestion: Spark Streaming acquires the MOM
data and places it in the memory of the
processing cluster. The ingestion process is
initiated by establishing a real-time context in
order to receive continuous input data streams
(DStream). In this way the data can be divided
into batches to be processed by the Spark engine.
4. Data processing: once the data is placed in
memory, Spark Streaming performs the
processing of the data through the algorithms
written in the “Scala” language. These
algorithms calculate statistics, such as sums and
averages about the measured variables of the
photovoltaic system.
5. Alert verification: during the data processing,
the measurements of the variables simulated by
the SAD-S are validated to detect a failure event
in a photovoltaic system (failure simulation of
the electric power supply). In case that the
variable measurements are out of range, an alert
message, which must be distributed by the alert
notification component, is created.
6. Storage: the processed information is sent to the
HBase database, which relies on distributed
HDFS storage. Internally, the data storage is
managed by the Master through the
RegionServers, which store the data in files and
send it to the HDFS. These files are divided into
one or more blocks to be stored in a set of
DataNodes(George, 2011).
7. Alerts notifications: alerts notifications are
responsible for coordinating the distribution and
publication trough different media of the alerts
generated. For this work the alerts are notified
through the dashboards and via e-mail to the
operators of the grid.
8. Analytics: dashboards and visualization boards
provide users with the ability to understand,
search and navigate data. This ability to create
analysis through reports and dashboards allows
stakeholders to make decisions and design
appropriate strategies to improve the operational
efficiency of photovoltaic systems. The boards
were developed using the Spotfire tool, which
takes the information stored in HBase.
4.3 Descriptive Analytics
There are two kinds of analytics: the dashboards and
the generation forecast. The dashboards include
descriptive analytics. Basically, the dashboards
display the operational performance of photovoltaic
systems.
4.3.1 Average System Efficiency
Figure 7 shows monthly the energy production of the
IoTBDS 2017 - 2nd International Conference on Internet of Things, Big Data and Security
272
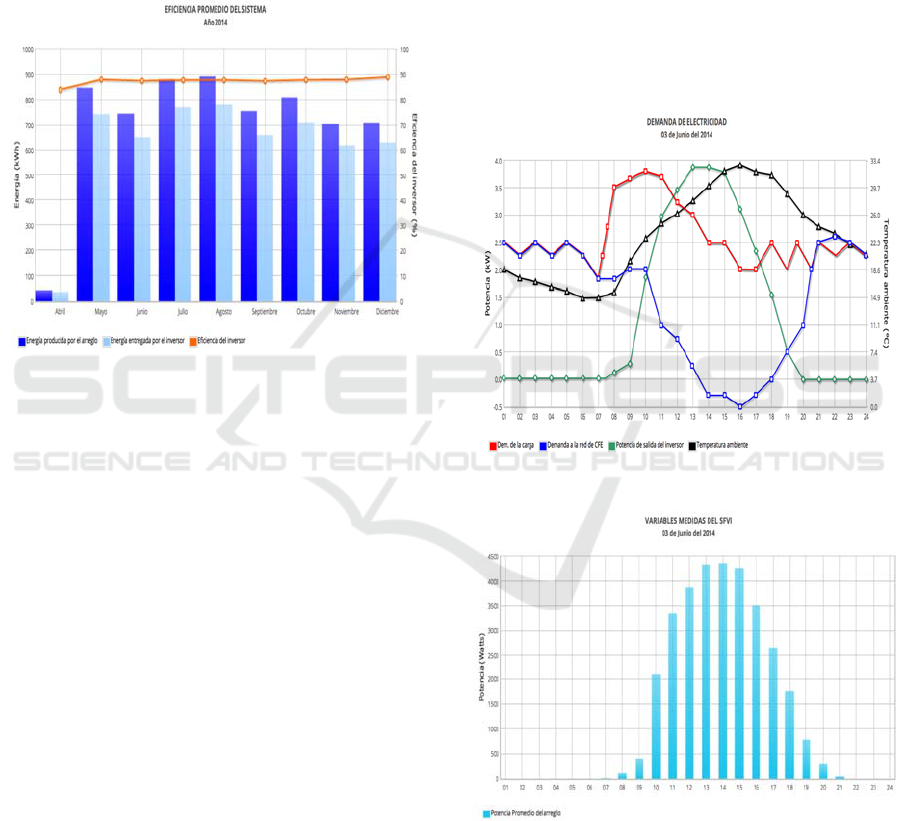
photovoltaic generator and the output delivered
through the inverter to the load or grid, as well as the
average efficiency of the inverter. The graph shows
that the efficiency of the inverter in year 2014 is kept
within the same values (approx. 90% efficiency)
regardless of the variation of the photovoltaic system
production. The efficiency is measured in relation to
the difference between the energy production of the
photovoltaic generator and the output delivered by the
inverter.
Figure 7: Efficiency of the photovoltaic system.
4.3.2 Meteorological Information
The meteorological information (irradiation, ambient
temperature and temperature of modules) of the site
where the photovoltaic system is installed is
monitored. There is a strong relation between the
average operating temperature of the photovoltaic
modules and the ambient temperature. The last one
was a favorable factor for the modules efficiency in
2014.
4.3.3 Reduction of Electricity Demand
Figure 8 monitors the reduction of electricity demand
(load demand) to CFE using the energy produced by
the photovoltaic array. As can be seen, the output
power of the inverter is divided between the demand
for the load, and what is not used in the load is sent to
the CFE grid. It is also observed that the increase of
the ambient temperature favors the increase of the
inverter output power.
This figure shows the typical way in which
photovoltaic generation impacts on the demand
pattern of electricity in a house, office or building.
The values plotted correspond to the average value
recorded for each variable at the same hour during the
whole month. In this particular case (June 2014) it can
be observed how during the period between 11:45 and
17:15 hours, the photovoltaic system, in addition to
covering the load demand, supplies electricity to the
grid.
4.3.4 Photovoltaic Array Power
Figure 9 shows the power produced by the
photovoltaic array. It is observed that there is
production only at hours of sunlight; in this case the
production is generated from 8 of the morning to 8 of
the night during June 3, 2014. It is also observed that
the greater production is realized during the peak sun
hours (1:00 and 3:00 in the afternoon).
Figure 8: Reduction of electricity demand to the grid.
Figure 9: Power produced by the photovoltaic array.
5 CONCLUSIONS
The Big Data concept is becoming more common in
everyday business life. However, there is still much
Big Data & Analytics to Support the Renewable Energy Integration of Smart Grids - Case Study: Power Solar Generation
273

confusion in this set of technologies, since only few
understand how to use them to gain value in
organizations. Therefore, understanding the benefits
that these technologies can bring to meeting the
organization needs becomes a primary task.
An important factor in creating Big Data
applications is the information management. Big Data
must generate timely and reliable information for
strategic and operational decision making. In
addition, the implementation of a Big Data is often
associated with the following challenges: systems and
processes that were not adapted for Big Data
applications; Poor quality of data derived from source
systems that can often go undetected until systems are
analyzed; and the maintenance process that tends to
be vague and bad defined.
To address this problem it is necessary to
implement a Big Data architecture that can help
ensure that information is reliable in its different
transformation stages.
On the other hand, a high level of knowledge is
needed to implement Big Data solutions, mainly in
the open source tools, since the process of handling
large volumes of information requires the integration
of different tools in different technological platforms.
Which leads to the need for specialized professional
profiles that are difficult to find in an organization and
in the labor market. For this reason, it is necessary to
integrate and train a team with different profiles,
which is, in some cases, a complex task in an
organization.
The Big Data application developed for renewable
energies has had good results. The information
displayed in the dashboards has allowed to measure
the performance and behavior of photovoltaic
systems and, therefore, to improve their integration
with the Smart Grid.
Finally, the results presented here may be used for
future research and projects related to the Smart Grid.
With the aim of supporting the reduction of the
uncertainty generated by the use of renewable energy
for the production of electric energy, the
implementation of mathematical models for the
design of predictive and prescriptive analytics, for the
prognostic of the generation of electric power with
solar energy, is still in the early stages of
development.
ACKNOWLEDGEMENTS
The authors wish to thank Ernesto de la Peña,
Department Head of Technical Services Unit of CFE
for their important work in supporting, organizing
and promoting the project.
REFERENCES
Liu, Y. "Big Data and Predictive Business Analytics".
Journal of Business Forecasting , 33 (4), pp: 40-52,
2014.
CRE. "Marco Regulatorio de la Red Eléctrica Inteligente
(REI) en México - Para la Comisión Reguladora de
Energía". Comisión Reguladora de Energía. 2014..
López, J., Padilha, A., & Gallego, L. "Ubicación óptima de
generación distribuida en sistemas de energía
eléctrica". Ingeniería y ciencia , 5 (9), pp: 9-23, 2009.
Andersson, K., & Elf, J. "One Step Towards Creating Value
From Big Data - A case study on E.ON Elnät". Lund
School of Economics and Management, Lund
University , Department of Business Administration.
Sweden: Lund Institute of Technology, 2015.
De Mauro, A., Greco, M., & Grimaldi, M. "What is big
data? A consensual definition and a review of key
research topic". AIP Conference Proceedings (1644),
97-104, 2014.
Escobedo, G., Jácome, N., & Arroyo, G. "Business
Intelligence and Data Analytics (BI&DA) to Support
the operation of Smart Grid". In Proceedings of the
International Conference on Internet of Things and Big
Data (IoTBD 2016), pages 489-496 , 2016.
George, L. "HBase: The Definitive Guide (First Edition
ed.)". USA: O'REILLY, 2011.
González, R., Jiménez, H. R., Huacuz, J. M., & Munguía,
G. "First 3-phase Grid- connected Photovoltaic System
in Mexico". 3rd International Conference on Electrical
and Electronics Engineering and XII Conference on
Electrical Engineering , 1, 2006.
Hurwitz, J., Nugent, A., Halper, F., Kaufman, M., et al.. Big
Data For Dummies. USA: John Wiley & Sons, Inc.,
2013.
IBM. "The Four V's of Big Data"
http://www.ibmbigdatahub.com/infographic/four-vs-
big-data, 2015.
IEA. Technology Roadmap Smart Grids. International
Energy Agency: https://www.iea.org/publications/
freepublications/ publication/ smartgrids_roadmap.
pdf, 2011.
Mysore, D., Khupat, S., & Jain, S. "Big data architecture
and patterns, Part 3: Understanding the architectural
layers of a big data solution". IBM developerWorks:
http://www.ibm.com/developerworks/library/bd-
archpatterns3/index.html, 2013.
SENER. "Estrategia Nacional de Energía 2013-2027".
Mexico Secretaría de Energía: http://www.energia.
gob.mx/ res/ PE_y_DT/ pub/ 2013/ ENE_2013-2027.
pdf, 2013.
Vicini, R., & Micheloud, O. "Smart Grids: Fundamentos,
Tecnologias y Aplicaciones". México: Cengage
Learning Editores S.A. de C.V., 2012.
Kaile Zhou, Chao Fu, Shanlin Yang. "Big data driven smart
energy management: From big data to big insights",
IoTBDS 2017 - 2nd International Conference on Internet of Things, Big Data and Security
274

Renewable and Sustainable Energy Reviews 56 , pp:
215–225, 2016.
Rich H. Inman, Hugo T.C. Pedro, Carlos F.M. Coimbra,
"Solar forecasting methods for renewable energy
integration", Progress in Energy and Combustion
Science 39, pp: 535-576, 2013.
J. Antonanzas et al., "Review of photovoltaic power
forecasting", Solar Energy 136, pp:78–111, 2016.
Big Data & Analytics to Support the Renewable Energy Integration of Smart Grids - Case Study: Power Solar Generation
275
