
Artery/vein Classification of Blood Vessel Tree in Retinal Imaging
Joaquim de Moura
1
, Jorge Novo
1
, Marcos Ortega
1
, Noelia Barreira
1
and Pablo Charl
´
on
2
1
Departamento de Computaci
´
on, Universidade da Coru
˜
na, A Coru
˜
na, Spain
2
Instituto Oftalmol
´
ogico Victoria de Rojas, A Coru
˜
na, Spain
{joaquim.demoura, jnovo, mortega, nbarreira}@udc.es, pcharlon@sgoc.es
Keywords:
Retinal Imaging, Vascular Tree, Segmentation, Artery/vein Classification.
Abstract:
Alterations in the retinal microcirculation are signs of relevant diseases such as hypertension, arteriosclerosis,
or diabetes. Specifically, arterial constriction and narrowing were associated with early stages of hypertension.
Moreover, retinal vasculature abnormalities may be useful indicators for cerebrovascular and cardiovascular
diseases. The Arterio-Venous Ratio (AVR), that measures the relation between arteries and veins, is one
of the most referenced ways of quantifying the changes in the retinal vessel tree. Since these alterations
affect differently arteries and veins, a precise characterization of both types of vessels is a key issue in the
development of automatic diagnosis systems. In this work, we propose a methodology for the automatic
vessel classification between arteries and veins in eye fundus images. The proposal was tested and validated
with 19 near-infrared reflectance retinographies. The methodology provided satisfactory results, in a complex
domain as is the retinal vessel tree identification and classification.
1 INTRODUCTION
The analysis of the eye fundus offers useful infor-
mation about the status of the different structures the
human visual system integrates, as happens with the
analysis of the retinal vasculature, being considered a
relevant way for the diagnosis and treatment of rel-
evant pathologies. These exploratory processes al-
low clinicians to detect countless diseases that have
a slow clinic evolution or do not show any symp-
tomatic manifestation. These evaluations also permits
the early identification of clinical conditions, facilitat-
ing the application of treatments and decreasing dras-
tic consequences caused by the disease itself and its
treatment.
The Optical Coherence Tomography (OCT) is a
non-invasive exploratory method for the analysis of
the eye fundus. Since its introduction in ophthalmol-
ogy it became a basic tool for the detection and mon-
itoring of several ocular illnesses (Brezinski, 2006).
This technique allows us to get high-quality images
that complement the information of classical retino-
graphies with the depth information that the histolog-
ical sections offer. These images enable the expert to
make a quantitative and qualitative evaluation of the
retinal morphology (Duker et al., 2014).
The retina is the only part of the human body
where the specialists can analyze directly the vascu-
lar morphology and structure in a non-invasive way.
Hence, direct analysis of many injuries caused by oc-
ular pathologies can be achieved, as is the case, for
example, the diabetic retinopathy (DR). The DR is a
diabetes mellitus complication, one of the principal
causes of blindness in the world (Pascolini, 2011).
It is considered the main cause of blindness in the
working-age population (Whiting et al., 2011). The
DR is caused mainly by the deterioration of the vascu-
lar structure that irrigates the retina, provoking leak-
age of fluid or blood. It causes the formation of
blood clots in the retinal structure, deforming the rep-
resented image in the brain (Abu, 2008). Different
studies demonstrated the association of the DR with
the risk factors of other cardiovascular diseases as,
for example, arteriosclerosis or hypertension (Wong,
2005).
Given the importance of this problematic, many
efforts were done in the development of methodolo-
gies for the automatic measurement and analysis of
the vasculature and its structural changes through,
for instance, the Arterio-Venular-Ratio (AVR), i.e., a
biomarker that analyzes the relation of the calibers
of the arteries and veins. This measurement is com-
monly used by experts as a criterion prognosis in clin-
ical settings mainly for DR detection but also for other
conditions as hypertension. AVR, among others mea-
surements, demonstrated that the analysis of the reti-
nal vessel tree, through the analysis of the arteries and
veins, is a crucial task. Computer-aided Diagnosis
de Moura J., Novo J., Ortega M., Barreira N. and Charløsn P.
Artery/vein Classification of Blood Vessel Tree in Retinal Imaging.
DOI: 10.5220/0006135003710377
In Proceedings of the 12th International Joint Conference on Computer Vision, Imaging and Computer Graphics Theory and Applications (VISIGRAPP 2017), pages 371-377
ISBN: 978-989-758-225-7
Copyright
c
2017 by SCITEPRESS – Science and Technology Publications, Lda. All rights reserved
371
(CAD) systems that automatically identifies and cate-
gorizes the arterio-venular tree can help and facilitate
significantly the doctors’ work.
In the literature we can find approaches that use
different strategies to solve the analyzed problem.
For example, (Joshi et al., 2014) used a methodology
based on graphs to segment the vascular tree structure
and then used color properties for the final artery/vein
(A/V) classification. In (Cordero, 2011), the authors
proposed a classification based on the analysis of the
statistical features of the vascular segments. Another
study (Kondermann et al., 2007) made use of an ap-
proximation based on pattern recognition due to arti-
ficial neural networks and Support Vector Machines
(SVM) was also employed by (Yang et al., 2016)
in a feature extraction and classification process. In
(Dashtbozorg et al., 2014), the classification of a ves-
sel segment as A/V is performed through the combi-
nation of the graph-based labeling results with a set
of intensity features. (V
´
azquez et al., 2013), pro-
posed a framework for the automatic classification
A/V, but only for a few restricted set of coordinates
that are posteriorly used in the calculation of the AVR
biomarker.
In this work, we propose an entire methodology
for the automatic extraction of the retinal vascular
tree and its categorization into arteries and veins. The
method extracts the vasculature and uses the k-means
clustering algorithm with features from the vessel
profiles to discriminate the arteries from veins.
We tested the methodology with near-infrared re-
flectance retinographies that are included in OCT
scans. The method only employs the information of
the retinographies as this proposal represents an initial
stage that is planned to be complemented posteriorly
with the analysis of the depth information that offer
the histological sections that also are included by the
OCT images.
This paper is organized as follows: section 2 is
dedicated to describing the developed methodology.
The experiments and results are included in section
3. Finally, section 4 shows the conclusion about the
results obtained by our methodology.
2 METHODOLOGY
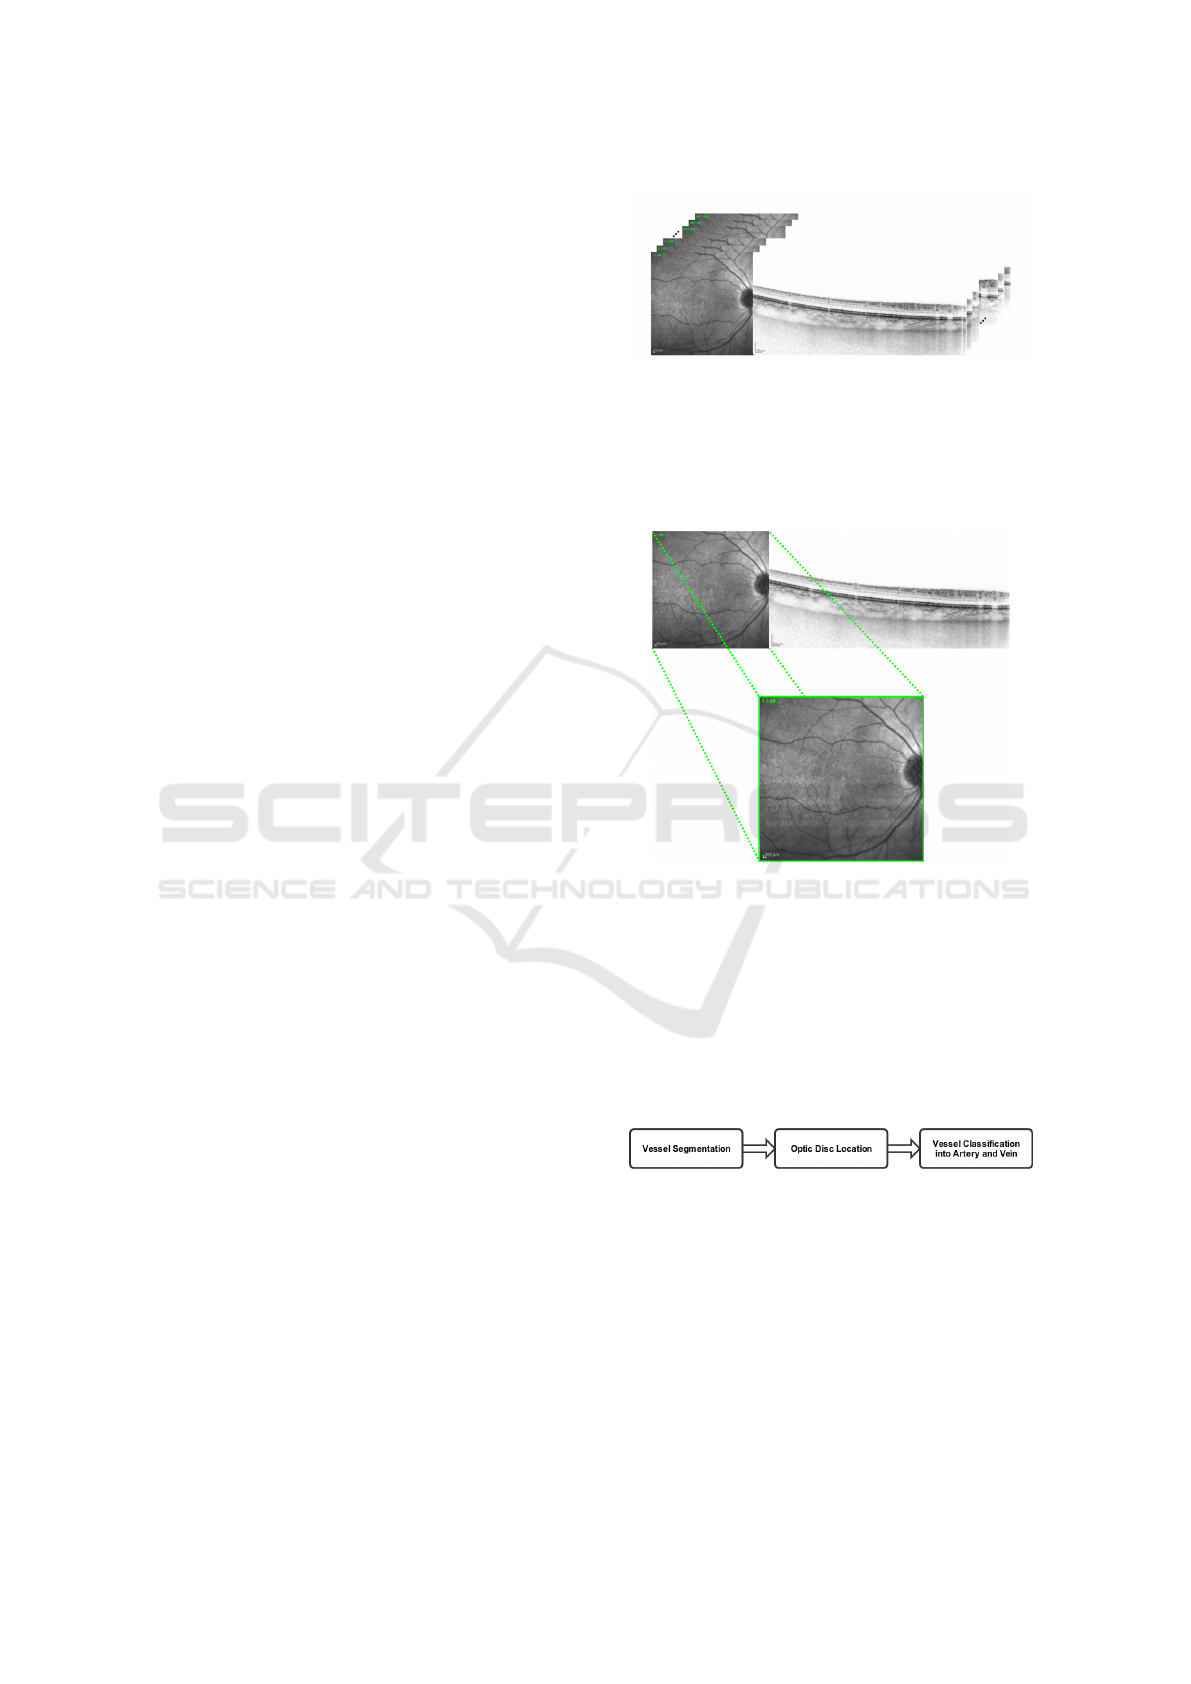
The proposed method receive, as input, a set of (OCT)
images. Each image corresponds to consecutive his-
tological sections representing the morphology of the
retinal layers. These images are complemented with
the corresponding near-infrared reflectance retinogra-
phy of the eye fundus. Figure 1 shows the set of input
images of our system.
Figure 1: Set of OCT images of the retina.
Firstly, the region of the retinography that corre-
sponds with the histological sections is identified and
extracted from the input image, as can be seen in Fig-
ure 2.
Figure 2: Extraction of the region of interest in the near-
infrared reflectance retinography.
The proposed methodology, represented in Figure
3, is divided into three main steps: a first step, where
the retinal vascular tree is extracted from the input im-
age; a second step, where the location of the optic disc
is identified; and finally, a third step, where the ves-
sels are finally classified into arteries and veins. Each
one of these steps is going to be discussed next.
Figure 3: Main steps of the proposed methodology.
2.1 Vessel Segmentation
The first step in the classification process is the loca-
tion of the blood vessels within the image. This step
is necessary for a posterior extraction of the vascular
features that are used in the posterior process of clas-
sification. For this purpose, we follow the methodol-
ogy proposed in (Calvo et al., 2011), given its sim-
plicity and for being a well-established technique. A
VISAPP 2017 - International Conference on Computer Vision Theory and Applications
372
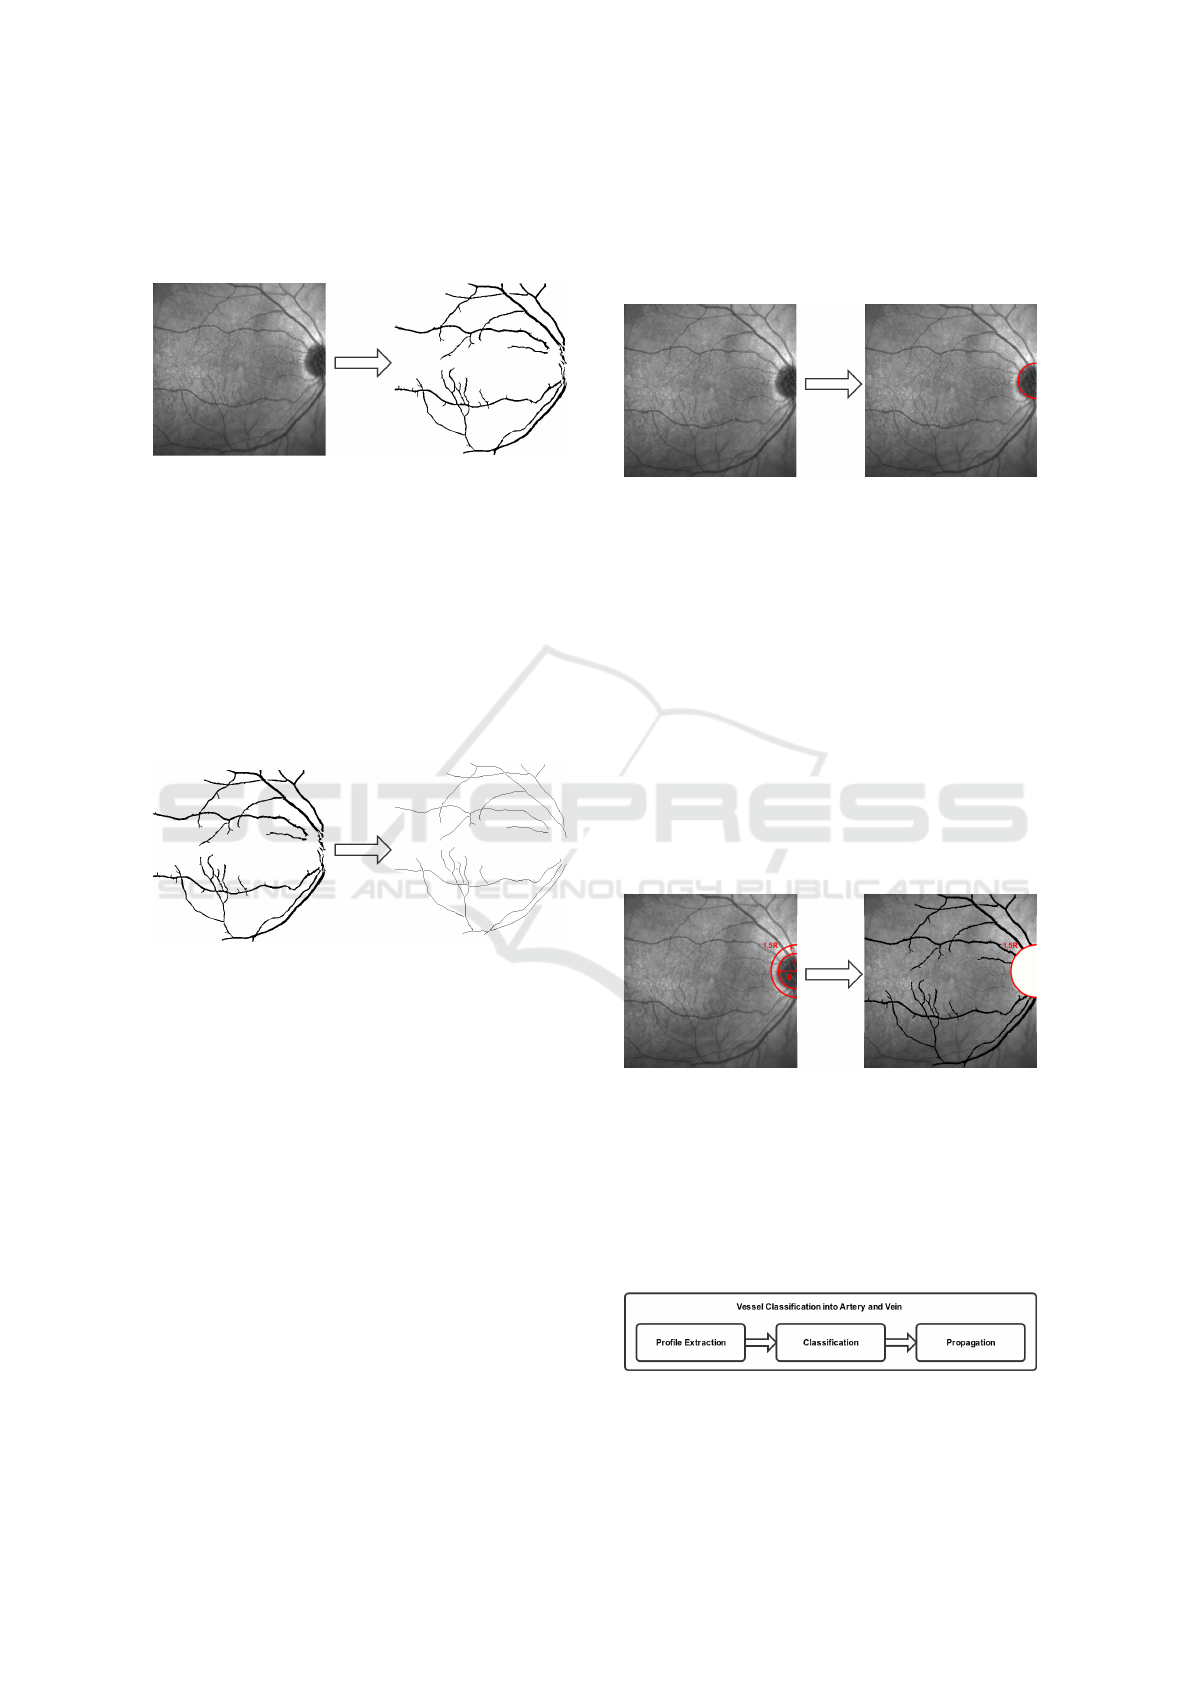
segmentation based on morphological operators is ap-
plied to obtain an initial representation of the vessels,
as shown in Figure 4.
Figure 4: Segmentation of the vessel tree.
The vasculature centerline is then calculated to
represent the vessels as a list of segments. For that
purpose, the implemented strategy was inspired in the
proposal of (Caderno et al., 2005). The vessels are lo-
cated by means of the MLSEC-ST operator. The aim
of this operator is the detection of tubular structures
by the analysis of the structure tensor of the segmen-
tation image. The output of this operator consists of
the vessel centerlines of the vasculature, as Figure 5
represents.
Figure 5: Vessel Centerline identification.
2.2 Optic Disc Location
The optic disc is a bright circular area formed by the
optic nerve fibers. This is the region where the entire
vessel tree appears in the eye fundus. The optic disc
is a region with a clear bright contrast in comparison
with the rest of the eye fundus. This can disturb the
main characteristics of the vessels visualization, situa-
tion that can lead to vessel misclassifications. For that
reason, the optic disc region is normally excluded for
the analysis and characterization of the vasculature.
Next step is the identification and removal of the
optic disc area. To achieve this, an algorithm based on
the Hough transform (Blanco et al., 2006) was imple-
mented. Firstly, the region of interest is identified us-
ing the Difference of Gaussian operator and the Blob
detection method. Thus, we convolve the original im-
age with two Gaussians filters at different scales and
calculate the difference between these convolutions.
Finally, we combine these results with the Sobel oper-
ator to extract the optic disc from the remaining edges
using the Hough transform. Figure 6 illustrates an ex-
ample of the optic disc localization process.
Figure 6: Optic disc localization.
The region of interest that is extracted in the
near-infrared reflectance retinographies is normally
focused on the macula. This may provoke that only a
part of the optic disc appears in the image. However,
the used strategy offers a robust behaviour, being able
to locate the optic disc location, even in scenarios with
only the partial inclusion of the optic disc.
Many times, not only the optic disc but also its
contiguous region may include significant changes in
brightness. Consequently, it is desirable to exclude a
greater region to guarantee a correct categorization of
the vasculature. This problem is solved by removing
the circular area centered on the optic disc with a ra-
dius of 1.5R, where R is the radius of the optic disc,
as presented in Figure 7.
Figure 7: Process of removal of the optic disc region.
2.3 Artery/Vein Vessel Classification
The third step of the methodology aims the automatic
classification of the retinal vasculature into arteries
and veins. We designed a method consisting of three
phases (see Figure 8).
Figure 8: Phases of the vessel classification into arteries and
veins step.
Artery/vein Classification of Blood Vessel Tree in Retinal Imaging
373
2.3.1 Phase 1: Profile Extraction
Firstly, we obtain the profiles of the vessels that are
posteriorly used to analyze the characteristics that are
used in the process of the vessel classification. We
propose an approach based on the idea of the al-
gorithm addressed in (V
´
azquez et al., 2013). This
methodology was focused on a particular purpose, the
calculation of the retinal AVR. For that reason, it was
only applied in a specific set of coordinates used in the
AVR calculation. We adapted this strategy to classify
the entire vascular structure.
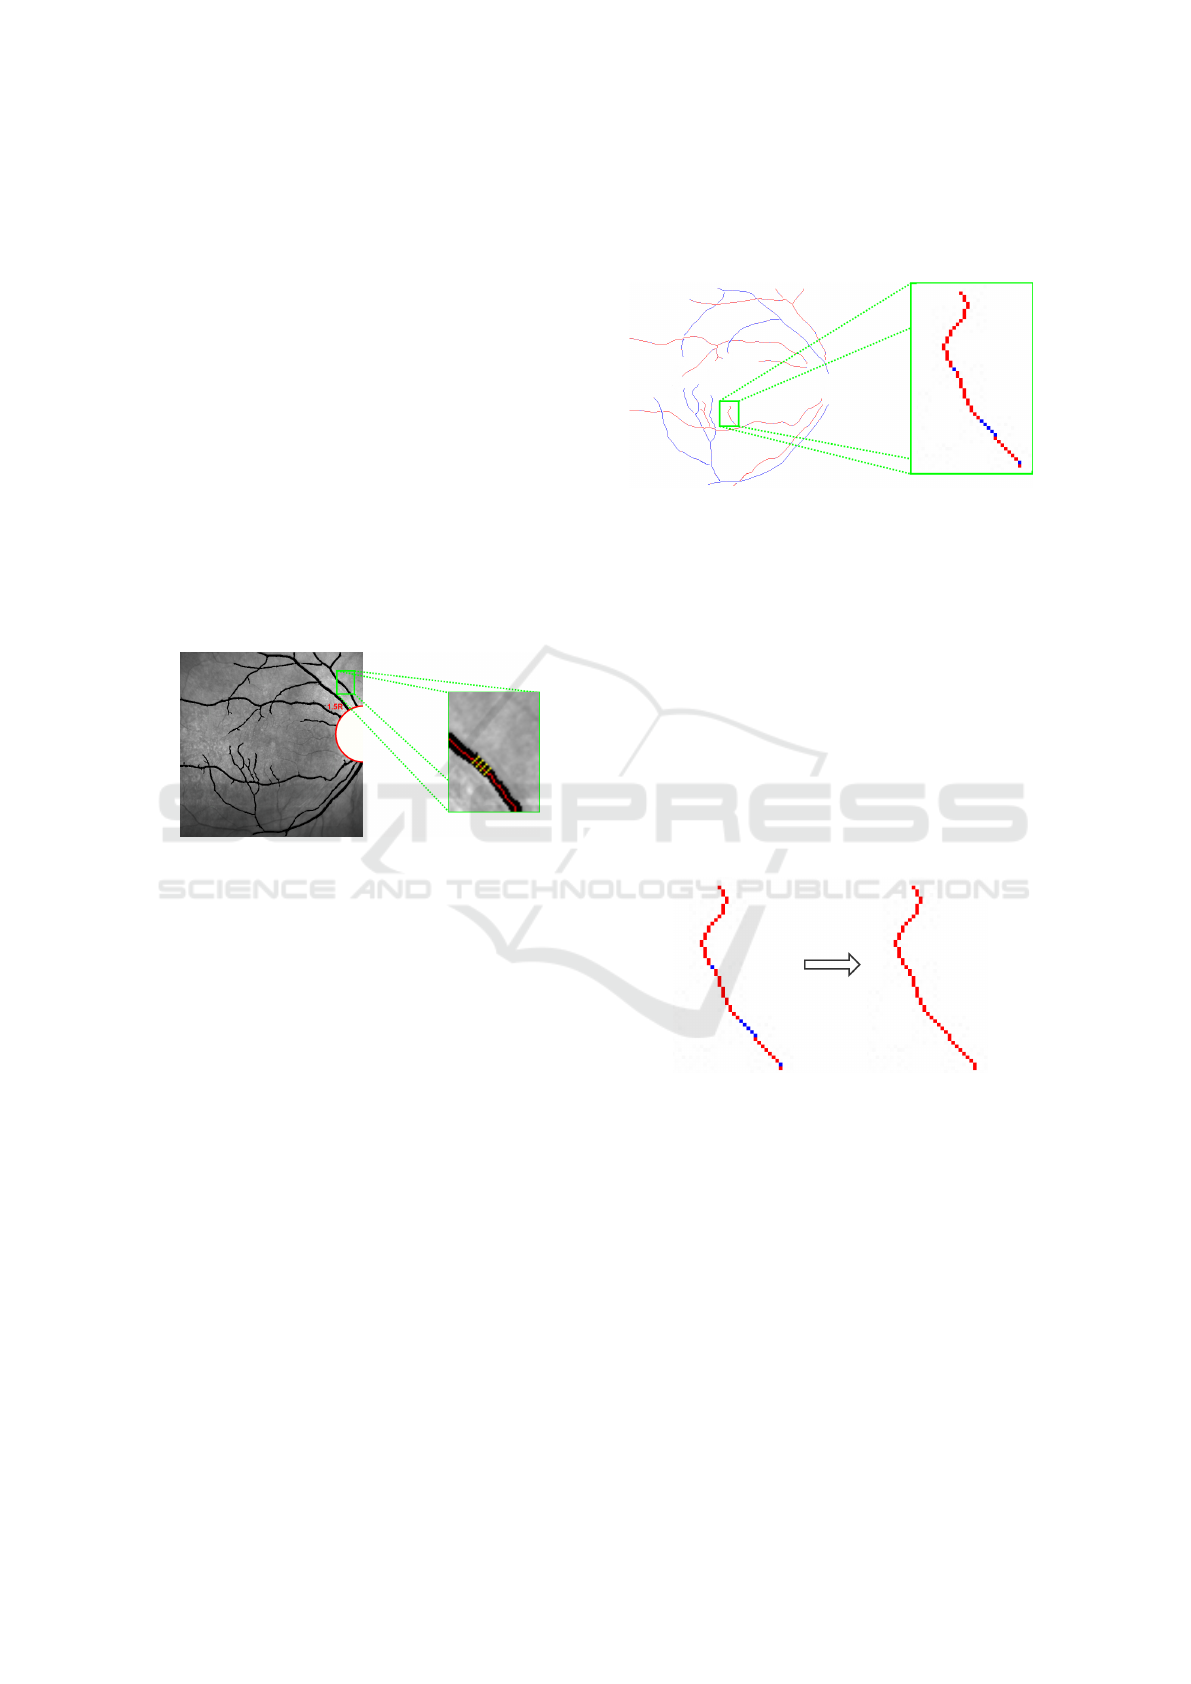
In this phase, we identify the vessel profiles to ex-
tract the feature vectors. For each point P of the cen-
terline, we get four equidistant points P
i
. We built the
vessel profile as the perpendicular line that is limited
by both vessel edges. The profiles are delimited by
the edges of the vessel. Figure 9 illustrates an exam-
ple of this approach.
Figure 9: Profile extraction of a vessel. The four yellow
lines perpendicular to the vessel centerline identify the ves-
sel profile at the point.
2.3.2 Phase 2: A/V Classification
With the vessel profiles, we obtain the information
used for the A/V classification through color profiles
of the vessels and create the feature vectors.
Feature vectors are obtained by means of the
methodology proposed by (Grisan and Ruggeri,
2003) which mainly consists of two components:
• µ(H) (from HSL color space).
• σ
2
(R) (from RGB color space).
The created feature vectors are the input of the
classifiers. In this approach, due to its simplicity
and computational efficiency, the K-means clustering
technique was selected. This algorithm calculate the
centroids for each one of the two clusters using as
mean the euclidean distance between the cluster cen-
troid and the value obtained in the feature vectors.
As result, each pixel of the vessel centerline is
classified as belonging to an artery or vein. In Figure
10, we illustrate the result of the classification process
over the centerline of a vessel. Red points represent
arteries whereas blue points are veins. We can appre-
ciate that there are points belonging to the same vas-
cular segment but classified into different categories.
Figure 10: Results of the A/V classification over the center-
line of a vessel. Red point, arteries; blue points, veins.
2.3.3 Phase 3: Propagation
Many times, points belonging to the same vascular
segment are classified into different categories. For
that reason, a post-processing to correct misclassifi-
cations was designed. To achieve this, a process of
voting over the entire vessel is done. The category
with higher number of votes is considered the one
that represents the vessel. Then, the method propa-
gates the results to all the pixels with the wrong class.
Figure 11 shows the result of applying the method of
propagation to correct misclassifications in the vascu-
lar segment.
Figure 11: Propagation of the winning class by a majority
vote of all points in the same vascular segment.
This process is repeated over the entire vessel tree,
achieving the final vasculature extraction and A/V
categorization. Figure 12 exposes an example of the
output of the methodology illustrating the final result
of the classification of the vessel tree into arteries and
veins.
3 EXPERIMENTAL RESULTS
The proposed method was tested with 19 patient scans
that, in addition to the OCT histological sections, in-
cluded the 19 near-infrared reflectance retinographies.
VISAPP 2017 - International Conference on Computer Vision Theory and Applications
374
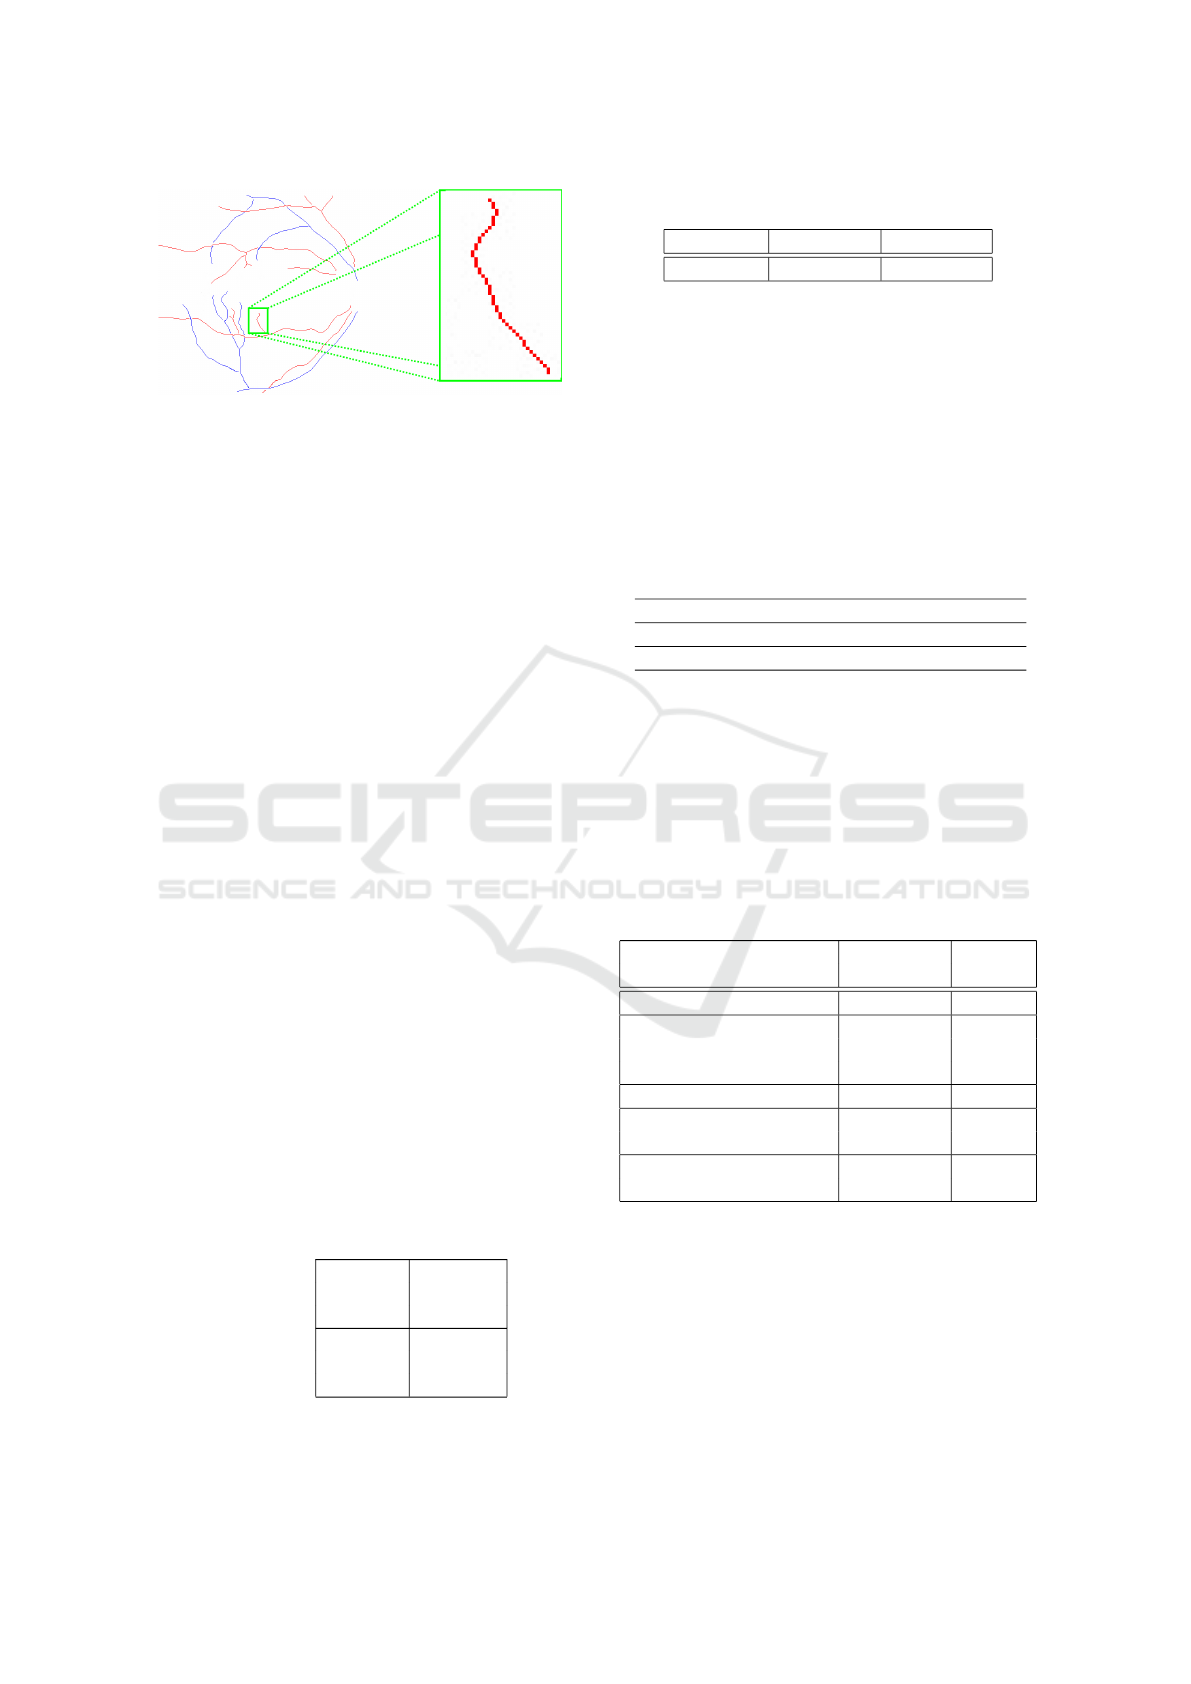
Figure 12: Final result of the methodology applied to the
classification of vessels between arteries and veins.
The images were taken with a confocal scanning laser
ophthalmoscope, a CIRRUS
TM
HD-OCT-Carl Zeiss
Meditec. The scans are centered in the macula, from
both left and right eyes of healthy patients, and with
a resolution of 1520 × 496 pixels. The blood vessels
have been manually classified by an expert clinician.
We have randomly selected 5 patient scans to de-
velop and train the algorithm and the remaining 14 as
the validation set. The classification results achieved
by our algorithm on the validation set were com-
pared to the manual labeling medical experts. A total
of 14,745 categorized points from 405 vascular seg-
ments were analyzed from the validation set.
Firstly, we analyze the performance of the method
in the entire vessel points. This analysis was made
before propagations phase to measure the robustness
of the A/V classification in individual vessel coor-
dinates. We evaluated the accuracy of the proposed
method using three metrics: accuracy, sensitivity and
specificity. Sensitivity measures the proportion of ac-
tual positives (arteries, in our case) that are correctly
identified whereas specificity measures the proportion
of negatives (veins in our case) that are classified ade-
quately. Table 1 presents the confusion matrix of our
system in comparison with the labeling of the expert
clinician. Moreover, Table 2 summarises the results
obtained for the classification between arteries and
veins in terms of accuracy, sensitivity and specificity
over all vessel coordinates.
Table 1: Confusion matrix of the A/V classification process.
Experts Experts
Positive Negative
Arteries Veins
System
Positive 6504 752
Arteries
System
Negative 961 6528
Veins
Table 2: Accuracy, specificity and sensitivity results in the
A/V classification process.
Accuracy Sensitivity Specificity
88.38% 89.63% 87.16%
We also calculated, in Table 3, the agreement be-
tween the methodology and the experts regarding the
final classification of the entire vessel segments (in-
cluding propagation). For this as said, we took 405
vessels labeled by experts to compare with the pro-
posal. The results are presented for both cases, veins
and arteries as well as the global result. We can verify
that the global success rate is around 93%.
Table 3: Agreement between the methodology and the ex-
perts in the classification of vascular segments.
Arteries Veins Total
Accuracy 186 191 377
Test set size 199 206 405
Success rate 93.46% 92.71% 93.08%
Despite that many approaches were tested in
private image datasets, we compared the proposed
methodology with other approaches of the state of the
art. Table 4 depicts the results of this comparison, pre-
senting the success rates that were obtained by each
method, showing that the best performance was pro-
vided by our proposal.
Table 4: Vessel classification performance comparative be-
tween the techniques found in the literature and our pro-
posal.
Method Algorithm
Error
Rate
V
´
azquez et al., 2013 k-means 89.80%
Dashtbozorg et al., 2014
LDA 88.30%
QDA 87.40%
KNN 70.00%
Yang et al., 2016 SVM 88.70%
Our method
k-means 88.38%
without Propagation
Our method
k-means 93.08%
with Propagation
4 DISCUSSION AND
CONCLUSIONS
In this paper, we have developed a new computer-
ized system for automatic retinal vasculature extrac-
tion and classification into arteries and veins using
the near-infrared reflectance retinography that is pro-
vided by OCT scans. The proposed algorithm exploits
Artery/vein Classification of Blood Vessel Tree in Retinal Imaging
375

the characteristics of each point of the vascular tree
structure to classify the vessels. We use the k-means
clustering technique with the feature vectors obtained
from the extracted vessel profiles. The employed fea-
tures consist of two components, the mean of the H
component (from HSL color space) and the variance
of the R component (from RGB color space).
The methodology was tested with 19 near-infrared
reflectance retinographies included in 19 OCT patient
scans. The method was trained with 5 images whereas
the validation set included the rest of 14 images. From
these images, 405 vessel segments and 14,745 vessel
coordinates were identified and manually labeled by
an expert clinician. As shown, the method offered
promising results. Regarding the vessel coordinates,
the method provided an accuracy of 88.38% as veins
or arteries. In the case of vascular segments, the re-
sults obtained are around a 93%. The reason of this
increase in the performance is the majority voting pro-
cess (propagation) that discriminates each vessel into
artery or vein. Finally, we made a comparison be-
tween various methods proposed in the literature. The
obtained results show a correct result in comparison
with the rest of the approaches.
Our study has some drawbacks. First, the differen-
tiation of retinal vessels depends on the image quality.
We can see that in the small vessels of the retina char-
acteristics are similar to both clusters. This indicates
the need of a study with a larger set of features. Sec-
ondly, this study does not consider the problems that
normally appear at the intersections: crossings and bi-
furcations. These landmarks provide important infor-
mation that can be used to construct a graph connect-
ing the vessel segments. Increasing vascular struc-
ture would enhance the efficiency of the methodology
mainly in the voting phase and propagation of classi-
fied points.
Despite of the promising results, there still ex-
ists some points that will be attempt as future works.
First of all, we need to improve the phases of the
method, in order to increase the success rates that
were achieved. A greater set of features can be con-
sidered as well as testing other classifiers can increase
the success rate. Future plans include development of
automated methods for calculation the arterio-venous
ratio (AVR). We validated the proposal with the near-
infrared reflectance retinographies that are provided
in combination with the histological sections of the
OCT images. Future versions of the methodology
will combine the depth information of the histologi-
cal sections to analyze the real layout, 3D, of the eye
fundus. Ultimately, this methodology could be incor-
porated into a computer-aided system for detection of
diabetic retinopathy, or other eye-related diseases.
ACKNOWLEDGEMENTS
This work is supported by the Instituto de Salud Car-
los III, Government of Spain and FEDER funds of
the European Union through the PI14/02161 and the
DTS15/00153 research projects and by the Ministerio
de Econom
´
ıa y Competitividad, Government of Spain
through the DPI2015-69948-R research project.
REFERENCES
Abu, A. (2008). Oct in diabetic dacular edema. Acta Oph-
thalmologica, 86.
Blanco, M., Penedo, M. G., Barreira, N., Penas, M., and
Carreira, M. J. (2006). Localization and extraction
of the optic disc using the fuzzy circular hough trans-
form. Artificial Intelligence and Soft Computing,
pages 712–721.
Brezinski, M. E. (2006). Optical coherence tomography.
Elsevier Academic Press, Burlington, Mass.
Caderno, I. G., Penedo, M. G., Barreira, N., Marino, C., and
Gonzalez, F. (2005). Precise detection and measure-
ment of the retina vascular tree. Pattern Recognition
and Image Analysis: Advances in Mathematical The-
ory and Applications, 15:523–526.
Calvo, D., Ortega, M., Penedo, M., and Rouco, J. (2011).
Automatic detection and characterisation of retinal
vessel tree bifurcations and crossovers in eye fun-
dus images. Computer Methods and Programs in
Biomedicine, 103:28–38.
Cordero, A. (2011). Scientific realism and the divide et im-
pera strategy: The ether saga revisited. Philosophy of
Science, 78(5):1120–1130.
Dashtbozorg, B., Mendonca, Maria, A., and Campilho,
A. (2014). An automatic graph-based approach for
artery/vein classification in retinal images. IEEE
Transactions on Image Processing, 23:1073–1083.
Duker, J. S., Waheed, N. K., and Goldman, D. (2014).
Handbook of retinal OCT.
Grisan, E. and Ruggeri, A. (2003). A divide et impera strat-
egy for automatic classification of retinal vessels into
arteries and veins. Engineering in Medicine and Biol-
ogy Society, 1:890–893.
Joshi, V. S., Reinhardt, J. M., Garvin, M. K., and Abramoff,
M. D. (2014). Automated method for identification
and artery-venous classification of vessel trees in reti-
nal vessel networks. PLoS ONE, 9(2).
Kondermann, C., Kondermann, D., and Yan, M. (2007).
Blood vessel classification into arteries and veins in
retinal images. Proc. SPIE, 6512.
Pascolini, DonatellaMariotti, S. P. (2011). Global estimates
of visual impairment: 2010. British Journal of Oph-
thalmology, 96(5):614–618.
V
´
azquez, S. G., Cancela, B., Barreira, N., Penedo, M. G.,
Rodr
´
ıguez-Blanco, M., Pena Seijo, M., de Tuero,
G. C., Barcel
´
o, M. A., and Saez, M. (2013). Improv-
ing retinal artery and vein classification by means of a
VISAPP 2017 - International Conference on Computer Vision Theory and Applications
376

minimal path approach. Machine Vision and Applica-
tions, 24(5):919–930.
Whiting, D. R., Guariguata, L., Weil, C., and Shaw, J.
(2011). Idf diabetes atlas: Global estimates of the
prevalence of diabetes for 2011 and 2030. Diabetes
Research and Clinical Practice, 94(3):311–321.
Wong, T. Y. (2005). Retinal arteriolar narrowing, hyperten-
sion, and subsequent risk of diabetes mellitus. Arch
Intern Med, 165(9):1060.
Yang, Y., Bu, W., Wang, K., Zheng, Y., and Wu, X. (2016).
Automated artery-vein classification in fundus color
images. Communications in Computer and Informa-
tion Science, 623:228–237.
Artery/vein Classification of Blood Vessel Tree in Retinal Imaging
377
