
Towards a Videobronchoscopy Localization System from Airway Centre
Tracking
Carles S
´
anchez
1
, Antonio Esteban-Lansaque
1
, Agn
`
es Borr
´
as
1
, Marta Diez-Ferrer
2
, Antoni Rosell
2
and Debora Gil
1
1
Computer Vision Center, Computer Science Department, UAB, Bellaterra, Spain
2
Pneumology Unit, Hospital Universitari Bellvitge, IDIBELL, CIBERES, Barcelona, Spain
Keywords:
Video-bronchoscopy, Lung Cancer Diagnosis, Airway Lumen Detection, Region Tracking, Guided Bron-
choscopy Navigation.
Abstract:
Bronchoscopists use fluoroscopy to guide flexible bronchoscopy to the lesion to be biopsied without any kind
of incision. Being fluoroscopy an imaging technique based on X-rays, the risk of developmental problems and
cancer is increased in those subjects exposed to its application, so minimizing radiation is crucial. Alternative
guiding systems such as electromagnetic navigation require specific equipment, increase the cost of the clinical
procedure and still require fluoroscopy. In this paper we propose an image based guiding system based on
the extraction of airway centres from intra-operative videos. Such anatomical landmarks are matched to the
airway centreline extracted from a pre-planned CT to indicate the best path to the nodule. We present a
feasibility study of our navigation system using simulated bronchoscopic videos and a multi-expert validation
of landmarks extraction in 3 intra-operative ultrathin explorations.
1 INTRODUCTION
Lung cancer is one of the most incidental neoplasms
in Europe with around 437, 773 new cases estimated
for 2015
1
. Screening programs increase lung can-
cer early diagnosis and, thus, may significantly reduce
the risk of death (Aberle et al., 2011). Screening pro-
grams are based on the detection of small pulmonary
lesions with low dose chest computed tomography
(CT) and its pathological confirmation. Pathologi-
cal confirmation requires either transthoracic needle
aspiration or an endoscopic examination. Transtho-
racic needle aspiration has some complications (Man-
hire et al., 2003), like pneumothorax (20%). Conven-
tional bronchoscopic diagnostic procedures are visu-
ally guided using radiating fluoroscopy and render a
suboptimal 34% of positive results for lesions < 2 cm
(Donnelly and Edwin, 2012). New endoscopy tech-
niques (like virtual bronchoscopy or electromagnetic
techniques) are expensive, require either manual in-
tervention or special gadgets, only increase diagnos-
tic yield to 70% (Aberle et al., 2011), and still radiate
the patient. The 30% undiagnosed pulmonary lesions
need CT follow-up or futile surgery procedures such
1
globocan.iarc.fr
as thoracoscopies (Aberle et al., 2011). Diagnostic
yield could be improved reducing radiation and costs
if imaging technology could better detect and guide
the bronchoscopist to the target lesion.
A main limitation of flexible bronchoscopy is the
difficulty to determine the correct pathway to periph-
erial lesions. CT Virtual Bronchoscopy (VB) can pre-
cede bronchoscopy to assess the optimal path using
virtual navigation. VB is a computer simulation of
the video bronchoscope image from the bronchoscope
camera (Reynisson et al., 2014) which is created from
the 3D CT volume, with the same view angle and
zoom settings. Despite different approaches to VB,
existing systems fail due to several aspects at plan-
ning and exploration time.
During exploration, VBs should accurately guide
the operator across the planned path to the biopsy
point. Standard protocols relying on fluoroscopy
have a diagnostic yield around 40%, last 20 min
per intervention and require 5-10 min of repetitive
patient and medical staff radiation (Asano et al.,
2013). Existing alternatives like image based systems
(LungPoint, NAVI) or electromagnetic navigation (in-
ReachTM,SPinDriveA) are far from meeting clini-
cian expectations. Image systems are based on multi-
modal registration of CT virtual projections to bron-
352
SÃ ˛anchez C., Esteban Lansaque A., BorrÃ
˘
as A., Diez-Ferrer M., Rosell A. and Gil D.
Towards a Videobronchoscopy Localization System from Airway Centre Tracking.
DOI: 10.5220/0006115803520359
In Proceedings of the 12th International Joint Conference on Computer Vision, Imaging and Computer Graphics Theory and Applications (VISIGRAPP 2017), pages 352-359
ISBN: 978-989-758-225-7
Copyright
c
2017 by SCITEPRESS – Science and Technology Publications, Lda. All rights reserved

choscopy frames and require manual intra-operative
adjustments of the guidance system (Eberhardt et al.,
2010). Electromagnetic systems require specific gad-
gets (Gildea et al., 2006), that alter the operating pro-
tocol and increase intervention cost.
The potential of image processing in enhancing
guiding capabilities has not been fully explored. To
display the correct position of the bronchoscope in the
CT-derived maps (structural maps of airways), scope
position should be tracked in videos. Some solutions
consist in hybrid algorithms (Lu
´
o et al., 2012) (fea-
ture tracking and multimodal registration) but most
of current solutions are based on multimodal registra-
tion (Reynisson et al., 2014) of CT virtual projections
to the actual videobronchosocpy frame (Mirota et al.,
2011). A main disadvantage is that the view from
the bronchoscope can be obscured by blood or mu-
cus, causing the tracking between video images and
CT to be disrupted. Another flaw is the sensitivity
to common sudden changes in image appearance and
camera motion.
An alternative to image registration is the use
of anatomical landmarks representing airway geom-
etry to match CT planning to current navigation path.
Some authors (Hofstad et al., 2015) use airways cen-
treline extracted using an electromagnetic tracking
sensor on the tip of the bronchoscope. Another option
is to extract landmarks representing the intrinsic local
geometry of airways which allows its identification
in, both, CT scans and videos without any extra de-
vice (S
´
anchez et al., 2015b). Such geometric features
can be encoded using a computational data structure
for path matching. Landmark extraction in interven-
tional videos is challenging due to the large variety of
image and motion artefacts and the unpredicted pres-
ence of endoscopic devices. Although recent works
(S
´
anchez et al., 2014; S
´
anchez et al., 2015a) have de-
veloped reliable processing methods to extract endo-
luminal structures, they are designed for 2D image
analysis and might fail applied to videos.
We propose a codification of airways as a binary
tree defined by bronchial branches to match lumen
centres between CT and videobronchoscopy. Lu-
men centres are tracked in images using a multi-
scale approach based on maximally stable external
regions (MSER) (Matas et al., 2004). Tracked cen-
tres together with detection of branching points are
used to match the VB planing and the current ex-
ploration. The feasibility of our landmark based CT-
Video matching is tested on several video sequences
simulated on a VB interface platform. The capability
for intra-operative matching is checked by assessing
the quality of the tracked centres in ultrathin real ex-
plorations. These first results show the potential of
our methodology to accurately reach most distal lev-
els in ultrathin navigation.
2 CT-VIDEO ANATOMICAL
MATCHING
The bronchial tree has a tubular geometry and, thus,
it is described as far as its central line (airway lu-
men centre) and walls (luminal area) are extracted.
In the case of bronchial navigation, the path can be
described using the lumen centre position and the
branching points of the bronchial tree structure.
Our CT-video path matching locates the current
position of the scope by comparing the bronchial tree
extracted from the CT used to plan the intervention to
a bronchial structure generated from the tracking of
lumen centres extracted from videobronchoscopic im-
ages during intervention time. Both anatomical struc-
tures can be computationally encoded by means of a
binary tree (S
´
anchez et al., 2015b) with nodes given
by the bronchial branching levels. The matching be-
tween CT-video bronchial structures is then given by
comparing the two binary trees.
2.1 Bronchial Anatomy Encoding from
the CT Scan
The whole bronchial tree to be matched to the current
exploration navigation path is encoded from the skele-
ton of a segmentation of the CT volume. The skeleton
is obtained using (Van Uitert and Bitter, 2007) with a
branch pruning based on its length. The 3D binary
volume containing the one-dimensional voxel skele-
ton is converted (Kerschnitzki and et al., 2013) into a
network graph described by nodes (skeleton branch-
ing points) and edges (branch joining two nodes) or
equivalently by the adjacency matrix.
The skeleton adjacency matrix is a symmetric ma-
trix with non-zero entries whenever two nodes are
connected by an edge and, thus, it codifies an undi-
rected graph with the 1st node at the trachea. The
graph is traversed to obtain the binary tree that en-
codes airways anatomy. Each node is visited by iter-
atively traversing the graph starting from the 1st node
to create a list of all the visited nodes. This list cor-
respond to all parents the node is connected to and it
is used to remove edges from the adjacency matrix to
get the tree structure.
The final binary tree is defined by labelling each
branch according to its bronchial level and orienta-
tion (left, right) with respect the splitting branch at
the previous level. The tree top node corresponds
Towards a Videobronchoscopy Localization System from Airway Centre Tracking
353
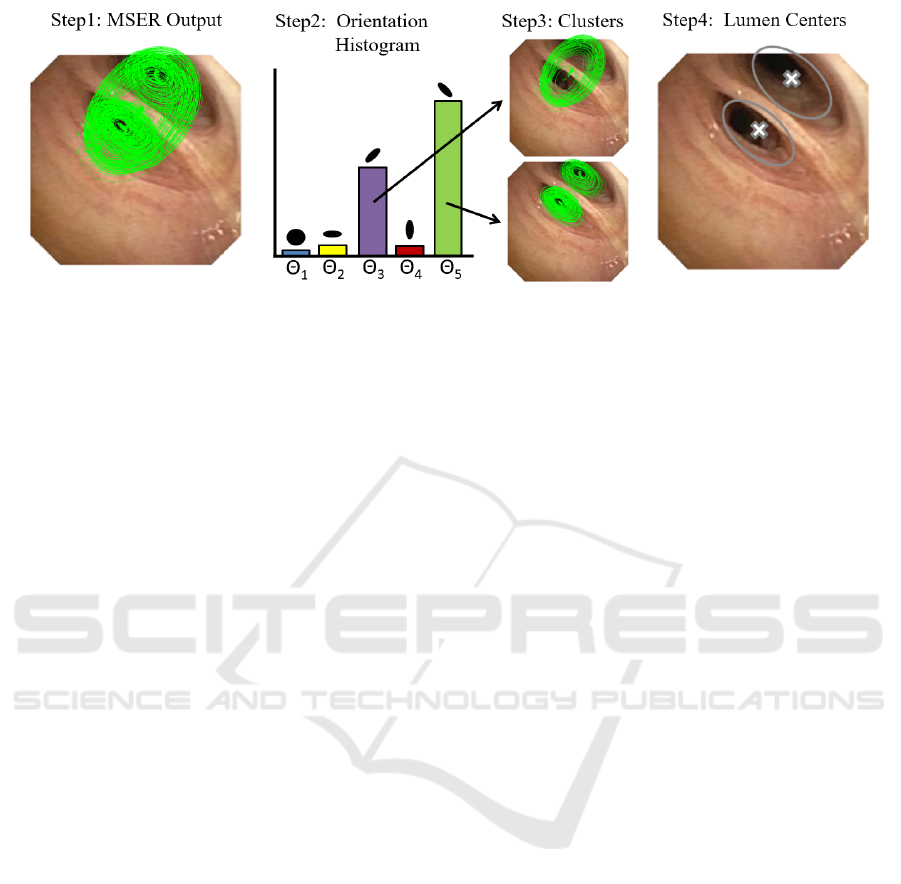
Figure 1: Extraction of Lumen Centres using a Multi-scale MSER.
to the tracheal entry point and it is labelled ”0”. At
each new branch, the added nodes are labelled ”0”
or ”1” depending on the anatomical branch orienta-
tion (”0” for left, ”1” for right). To label branches
at each level, we use the orientation of the current
and children nodes with respect to the current node
parent. Let P
n
= (x
n
, y
n
, z
n
), P
p
= (x
p
, y
p
, z
p
) and
P
ch
i
= (x
ch
i
, y
ch
i
, z
ch
i
) be the 3D positions in the air-
way skeleton of the current node, n, its parent, p, and
current node children, ch
i
, i = 1, 2. Taking P
n
as ori-
gin of coordinates, such positions define a coordinate
change in R
3
given by the vectors
−→
V
0
= P
p
− P
n
,
−→
V
1
= P
ch
1
− P
n
and
−→
V
2
= P
ch
2
− P
n
. Each children
node n
ch
i
is labelled ”0” or ”1” depending on the ori-
entation (clock wise or counter clock wise) of the ba-
sis given by
−→
V
0
,
−→
V
1
,
−→
V
2
. Since the orientation of
a coordinate change is determined by the sign of the
determinant of the matrix given by the vector coordi-
nates, children nodes are labelled according to:
Label(ch
1
) =
0 , if det((
−→
V
0
,
−→
V
1
,
−→
V
2
)) > 0
1 , otherwise
Label(ch
2
) = 1 − Label(ch
1
) (1)
for (
−→
V
0
,
−→
V
1
,
−→
V
2
) the matrix given by the column
vectors
−→
V
i
, i = 1, 2, 3.
2.2 Bronchial Path from Exploration
Videos
The computation of the navigated path has 2 stages:
extraction of lumen centres in images using a multi-
scale MSER over a likelihood map of lumen centre
location and tracking of MSER centres to endow con-
tinuity across the sequence.
Extraction of airway centres is based on likelihood
maps (S
´
anchez et al., 2014) with maximum values at
candidate centres. Under the assumption of a circular
luminal profile in central navigation, such maps use a
single scale isotropic Gaussian kernel to characterize
dark image areas prone to belong to airway lumen.
Unlike (S
´
anchez et al., 2014), we compute several
maps using a bank of anisotropic Gaussian filters with
different orientations and scales to model non-circular
lateral bronchi and small distal levels. Gaussian filters
have been normalized by their L
2
norm to obtain more
uniform responses comparable across different scales
and degrees of anisotropy.
To compute local maxima consistent across scales
and orientations, we use maximal stable extremal re-
gions (MSER) in the multi-scale scheme sketched in
fig.1. A set of MSER elliptical regions are extracted
for each likelihood map (fig.1, step1). To endow
stability across likelihood maps and, thus, different
scales and orientations, MSER regions are first split
according to their orientation using a histogram (fig.1,
step2). For each orientation, elliptical MSER regions
are sorted by their area and grouped into N clusters
(fig.1, step3). The union of all ellipses in each cluster
defines a set of N regions that are filtered using an in-
clusion criteria. The overlapping between regions is
computed and those having maximum overlap are se-
lected. The collection of MSER centroids for all valid
regions are the set of lumen centres for each frame
(fig.1, step4).
To endow centres with temporal continuity,
MSER candidates are tracked using a modified
Kalman filter (Haykin, 2004). For each lumen cen-
tre at a given frame, a Kalman filter (Haykin, 2004)
predicts its location in the next frame according to a
motion model (constant velocity, constant accelera-
tion). Such motion models are prone to fail in intra-
operative videos due to abrupt movements in scope
manual guiding and patient coughing. To reduce the
impact of these variations in motion model, we have
implemented a constant position tracker that uses a
state vector with zero velocity.
VISAPP 2017 - International Conference on Computer Vision Theory and Applications
354

2.3 CT-Navigation Matching
To match the navigation path to the binary tree en-
coding CT bronchial anatomy, we identify frames
traversing a higher bronchial level (binary tree level)
and orient the entering branches to chose the tree
node. A given frame at time, t, can be categorized
from the multiplicity of lumen centres, NLM, as:
1) Frame within same bronchial level (NLM
t+1
=
NLM
t
); 2) Frame approaching a bronchial level
(NLM
t+1
> NLM
t
); 3) Frame traversing a bronchial
level (NLM
t+1
< NLM
t
). Starting at the top node
of the binary tree, each time a frame traverses a
bronchial level, the tree level is increased and the path
node sequence is updated by adding ”1” or ”0” de-
pending on the entering branch orientation. The cen-
tre point with highest likelihood is considered to be
the scope current position and defines the entering
branch. Its orientation is defined by its relative po-
sition with respect the disappearing centres. If the
x-coordinate is larger than the average x-coordinate
of the vanishing points, we consider that the node is
labelled ”1” and ”0” otherwise.
Figure 2 illustrates the main steps involved in our
CT-video matching based on the codification of air-
ways anatomical landmarks. We show the skeleton of
a segmented CT scan (left image) that represents the
centre airway line and the final binary tree data struc-
ture for the first 3 bronchial levels (central image). We
have labelled the skeleton branching points according
to their corresponding binary tree nodes, so that the
green path would correspond to the node sequence
(1, 0, 1, 0). The most right images illustrate the iden-
tification of lumen centres and the matching to the bi-
nary tree (central image) representing the exploration
bronchial path. Lumen centres in right images are
plotted in green, with dots indicating the one corre-
sponding to the scope current position. We show two
representative cases: a frame within same bronchial
level (top images) and a traversing frame (bottom im-
ages). The node sequence associated to these frames
is shown on the central tree in green.
3 EXPERIMENTS
3.1 Experiment1: Tracked Centres
Accuracy
We have compared under intervention conditions the
quality of centres tracked using Section 2.2 (la-
belled MSER) to the method in (S
´
anchez et al.,
2015b) exclusively based on local maxima (labelled
LMx). Methods have been applied to 3 ultrathin bron-
choscopy videos performed for the study of peripheral
pulmonary nodules at Hospital de Bellvitge. Videos
were acquired using an Olympus Exera III HD Ultra-
thin videobronchoscope. For each video, we consid-
ered one proximal (up to 6th division) and one dis-
tal (above 6th) fragments. The maximum bronchial
level achieved in our ultrathin explorations was within
10th and 12th, which is in the range of the maxi-
mum expected level reachable by ultrathin navigation
(Asano et al., 2013). Fragments included the most
common artefacts of intra-operative videos: broncho-
scope collision with the bronchial wall, bubbles due
to the anaesthesia and patient coughing.
For each fragment, we sampled 10 consecutive
frames every 50 frames. Such frames were annotated
by 2 clinical experts to set false detections and the po-
sition of missed centres. Inspired in crowd sourcing
strategies (Maier-Hein et al., 2015), annotations were
blended to get a unique ground truth using the inter-
section of the two annotated point sets as illustrated
in fig.3. Ground truth sets were used to compute pre-
cision (Prec) and recall (Rec) for each set of consecu-
tive frames. These scores are taken for all such sets in
distal and proximal fragments for statistical analysis.
We have used a T-test for paired data to assess signifi-
cant differences across methods average precision and
recall and confidence intervals, CI, to report average
expected ranges. Tests and CIs have been computed
at significant level α = 0.05.
Table 1 reports CIs for each score and method at
proximal and distal levels, as well as, p-values for the
difference between MSER and LMx scores. At prox-
imal level, both methods perform equally, but MSER
keeps its quality scores at distal levels. This intro-
duces significant differences (p-val< 0.05) in dis-
tal and total Prec and Rec. Such differences are
larger for Rec, with a CI for the difference equal to
[0.05, 0.16] for distal bronchi and [0.03, 0.16] overall.
It is worth noticing that the proposed method always
has a 100% of precision and a recall over 86%, with
non-significant differences between distal and proxi-
mal levels (p-val > 0.7).
To validate the stability of our tracked centres in
full explorations, we have applied our MSER track-
ing to one of the complete videos. The chosen video
starts at carina, reaches the 11th level and includes
back and forth navigation with bronchoscope rota-
tion. Concerning image quality, there are saturation
illumination artefacts at most distal levels and some
fragments were recorded using narrow band imaging.
The original video with the tracked centres on each
image frame with a colour legend indicating candi-
date centres discarded by the Kalman filter, tracked
Towards a Videobronchoscopy Localization System from Airway Centre Tracking
355
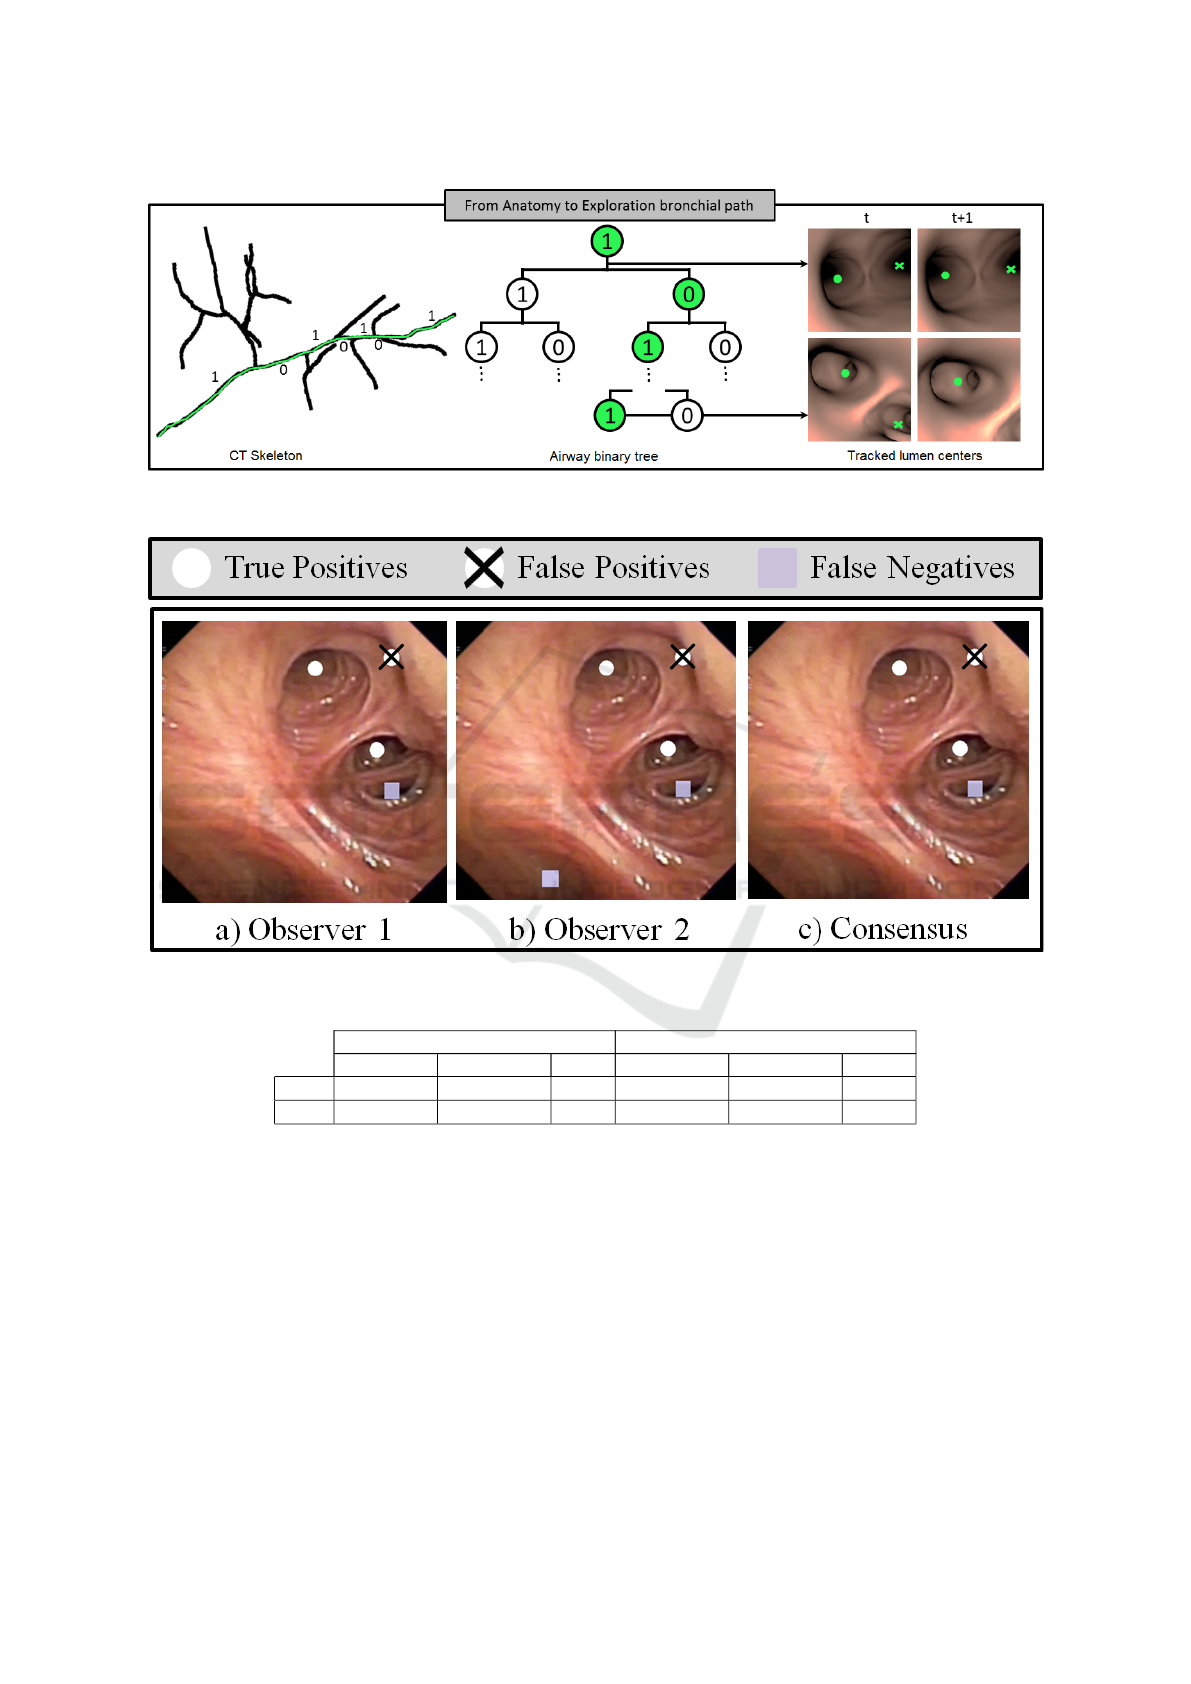
Figure 2: CT-Video Anatomical Matching. Codification of the bronchial anatomy from CT branch points (right image) and
binary tree coding for identification of the navigated path inside the bronchial tree (central and left images).
Figure 3: Manual Annotation of Tracked Centres.
Table 1: Average precision and recall confidence intervals for centre tracking.
Proximal Distal
MSER LMx p-val MSER LMx p-val
Prec [1.0, 1.0] [0.95, 1.0] 0.07 [1.0, 1.0] [0.93, 0.99] 0.02
Rec [0.86, 1.0] [0.81, 0.96] 0.4 [0.82, 0.97] [0.74, 0.87] 7e − 4
centres and scope position is available at https://
www.youtube.com/watch?v=h8kUrzDjSKo. Figure
4 shows representative frames at proximal (a,b) and
distal (c,d) levels.
3.2 Experiment2: Anatomical Matching
Accuracy
We have tested our methodology in virtual explo-
rations of CT volumes from 3 patients coming from
Hospital de Bellvitge. CT scans were acquired with
a 320-detector row Aquilion ONE, Toshiba CT scan
and 0.5 mm thickness. Each CT volume was man-
ually segmented using AMIRA to create a triangular
mesh in .obj format for navigation simulation. Virtual
explorations were generated using a simulation plat-
form developed in Unity (Borras et al., 2015), which
allows the modelling of the scope camera and inter-
active point of view navigation. For this experiment,
the bronchoscope was simulated in central navigation
without rotation around the scope long axis (see the
Discussion Section 4 for clarifications about this as-
sumption). The camera position inside the bronchial
VISAPP 2017 - International Conference on Computer Vision Theory and Applications
356
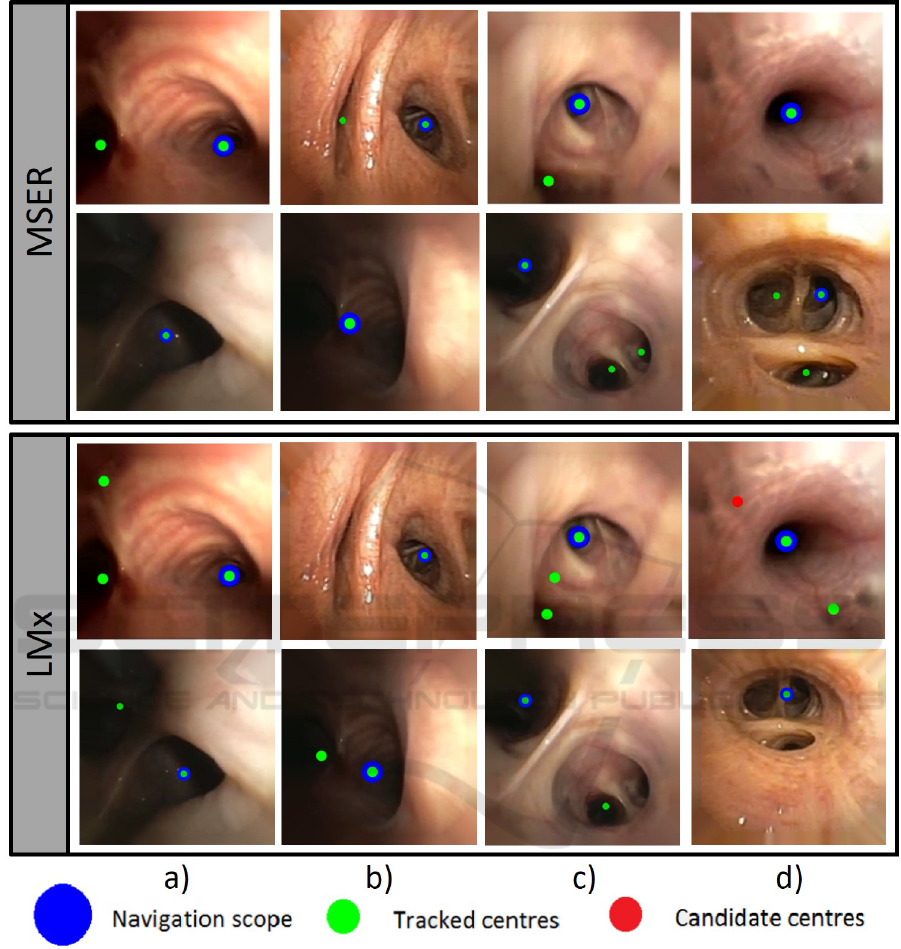
Figure 4: Representative frames at proximal, (a,b) and distal levels, (c,d).
tree was exported to define the codification of the
ground truth path in the binary tree.
For each CT scan, 15 virtual explorations with
different branching paths and bronchial levels (from
4th to 12th) were defined. For each path, the binary
tree node coding for the ground truth camera posi-
tion was compared to the code extracted from virtual
videos. Node path coding was compared in terms of
True Positives Nodes (TPN) and True Path Represen-
tations (TPR). For a given exploration, a node is con-
sidered to be a TPN if its label coincides with the GT
node label. The number of consecutive TPN achieved
from the 1st node divided by the path node length de-
fines TPR. As before, we have used a T-test to detect
significant differences across proximal and distal lev-
els and CIs at significance α = 0.05 to report average
TPN and TPR.
Table 2 reports CIs for average TPN, TPR per-
centages at proximal and distal levels and p-values
of the T-test for the difference. The detection rate of
Towards a Videobronchoscopy Localization System from Airway Centre Tracking
357
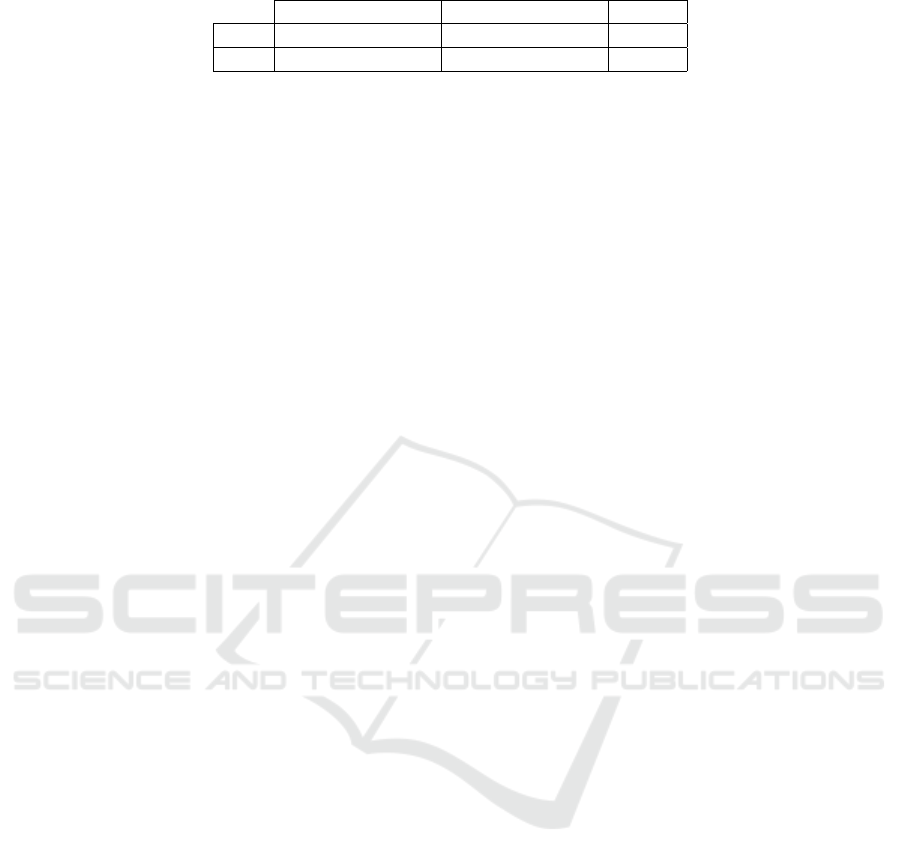
Table 2: Comparison of TPN and TPR at proximal and distal levels.
Proximal Distal p-val
TPN [70.32%, 85.86%] [67.32%, 81.18%] 0.4397
TPR [72.16%, 90.71%] [63.91%, 79.53%] 0.0370
nodes along the whole path is not significantly dif-
ferent at distal and proximal levels, with a CI for
the difference equal to [−6.1%, 13.8%]. Concern-
ing the percentage of correct paths reached from the
trachea, there are significant differences with a drop
between [1.3%, 15.9%]. This drop in performance
mainly arises from false distal centres due to illumi-
nation artefacts in simulated data and a suboptimal la-
belling of CTs (see Discussion Section 4 for details).
4 DISCUSSION AND
CONCLUSIONS
We have introduced a localization system for lung
cancer biopsy guidance based on identification of air-
ways centres. The system bases on a codification
of airways using a binary tree and an airway lumen
extraction from videobronchoscopy with an ultrathin
bronchoscope. Our experiments validate centre ex-
traction in 3 intra-operative ultrathin videos and the
CT-video path retrieval in simulated data.
Results in ultrathin bronchoscopy videos indicate
high equal performance of our centre tracker based
on maximal stable regions at proximal and distal
levels. In particular, there are not any false detec-
tions (Prec=1) and the rate of missed centres is un-
der 15% (Rec> 0.85). The decrease in recall is due
to the model assumptions used to compute the like-
lihood maps (S
´
anchez et al., 2014), which even us-
ing anisotropic Gaussians favour circular geometries.
This could be solved by considering the bronchial
structure of each patient extracted from the CT-scan.
This expected local configuration of airway centres
could be used during the tracking step to retrieve
missing lateral bronchi. Still, results are promis-
ing enough (see the full exploration at https://
www.youtube.com/watch?v=h8kUrzDjSKo) to en-
courage a use in a navigation system to explore the
benefits of using video information for biopsy guid-
ance to peripheral pulmonary nodules.
The potential of our centre tracking for CT-
navigation matching is illustrated in the experiment
with simulated data. It is worth noticing that the qual-
ity of tracked centres is enough to correctly match
80% of 6th level paths and 70% of 12th level paths us-
ing only multiplicity of the tracked centres. Of course
this matching criteria is not powerful enough to cope
with artefacts in centres detection, which introduce
false nodes in the tree path coding for distal paths. We
think that codification of the full MSER regions hier-
archy would provide a more solid representation of
bronchial branching in images and,thus, increase the
level successfully matched. Aside, the labelling of the
CT tree should take into account the local orientation
(Frenet basis) of the path traversing bronchial level
to obtain a labelling consistent with image projection
orientation. Finally, simulations were done assuming
central non-rotational navigation. This is not a critical
assumption, provided that the goal was to validate a
CT-video matching based on lumen anatomical land-
marks as alternative to image registration. However,
to have a system operative in clinical conditions, the
criteria used to label image centre lumens should be
modified to allow rotations of the bronchoscope. This
could be achieved by computing the intra-frame rota-
tion to adapt the position of centres in central naviga-
tion to the current exploration and it is future work.
ACKNOWLEDGMENTS
Work supported by projects DPI2015-65286-R, FIS-
ETES PI09/90917, 2014-SGR-1470 and Fundaci
´
o
Marat
´
o TV3 20133510. Also supported by CERCA
Programme / Generalitat de Catalunya. Finally, Deb-
ora Gil is supported by the Serra Hunter Program.
REFERENCES
Aberle, D., Adams, A., and et. al. (2011). Reduced
lung-cancer mortality with low-dose computed tomo-
graphic screening. N Engl J Med, 365:395–409.
Asano, F., Shinagawa, N., and et. al. (2013). Virtual
bronchoscopic navigation combined with ultrathin
bronchoscopy. arandomized clinical trial. AJRCCM,
188(3):327–333.
Borras, A., Gil, D., and et al. (2015). A virtual broncho-
scopic tool to explore the impact of physical restric-
tionsin bronchoscopy planning. In MICCAI IMIM.
Donnelly, E. and Edwin, F. (2012). Technical parameters
and interpretive issues in screening computed tomog-
raphyscans for lung cancer. JTI, 27(4):224–229.
Eberhardt, R., Kahn, N., and et. al. (2010). Lungpointa
new approach to peripheral lesions. JTO, 5(10):1559–
1563.
VISAPP 2017 - International Conference on Computer Vision Theory and Applications
358

Gildea, T., Mazzone, P., and et. al. (2006). Electromag-
netic navigation diagnostic bronchoscopy: a prospec-
tive study. AJRCCM, 174(9):982–989.
Haykin, S. (2004). Kalman filtering and neural networks,
volume 47. John Wiley & Sons.
Hofstad, E., Sorger, H., and et. at (2015). Automatic regis-
tration of ct images to patient during bronchoscopy- a
clinicalpilot study. In ECBIP.
Kerschnitzki, K. and et al. (2013). Architecture of the os-
teocyte network correlates with bone material quality.
JBMR, 28(8):1837–45.
Lu
´
o, X., Feuerstein, M., and et al (2012). Development
and comparison of new hybrid motion tracking for
bronchoscopicnavigation. Medical image analysis,
16(3):577–596.
Maier-Hein, L., Kondermann, D., and et. al. (2015).
Crowdtruth validation: a new paradigm for validat-
ing algorithms that relyon image correspondences. IJ-
CARS, 10(8):1201–12.
Manhire, A., Charig, M., and et. al. (2003). Guide-
lines for radiologically guided lung biopsy. Thorax,
58(11):920.
Matas, J., Chum, O., Urban, M., and Pajdla, T. (2004). Ro-
bust wide-baseline stereo from maximally stable ex-
tremal regions. IMAVIS, 22(10):761–767.
Mirota, D., Ishii, M., and Hager, G. (2011). Vision-based
navigation in image-guided interventions. Annual re-
view of biomedical engineering, 13:297–319.
Reynisson, P., Leira, H., and et. al (2014). Navigated bron-
choscopy: a technical review. JBIP, 21(3):242–264.
S
´
anchez, C., Bernal, J., and et al (2014). On-line lumen
centre detection in gastrointestinal and respiratory en-
doscopy. In MICCAI-CLIP, volume 8361 of LNCS,
pages 31–38.
S
´
anchez, C., Bernal, J., S
´
anchez, F. J., Diez, Marta an-
dRosell, A., and Gil, D. (2015a). Toward online
quantification of tracheal stenosis from videobron-
choscopy. IJCARS, 10(6):935–945.
S
´
anchez, C., Gil, D., and et al (2015b). Navigation path
retrieval from videobronchoscopy using bronchial
branches. In CLIP, LNCS 9401.
Van Uitert, R. and Bitter, I. (2007). Subvoxel precise skele-
tons of volumetric data based on fast marching meth-
ods. Medical physics, 34(2):627–638.
Towards a Videobronchoscopy Localization System from Airway Centre Tracking
359
