
Enriching What-If Scenarios with OLAP Usage Preferences
Mariana Carvalho and Orlando Belo
ALGORITMI R&D Centre, Department of Informatics, School of Engineering, University of Minho,
Campus de Gualtar, 4710-057, Braga, Portugal
Keywords: Business Intelligence, What-If Analysis, on-Line Analytical Processing, Usage Preferences,
Multidimensional Databases.
Abstract: Nowadays, enterprise managers involved in decision-making processes struggle with numerous problems
related to market position or business reputation of their companies. Owning the right and high quality set of
information is a crucial factor for developing business activities and consequently gaining competitive
advantages on business arenas. However, retrieving information is not enough. The possibility to simulate
hypothetical scenarios without harming the business using What-If analysis tools and to retrieve highly refined
information is an interesting way of achieving such advantages. In this paper, we propose an approach for
helping to optimize enterprise decision processes using What-If analysis scenarios combined with OLAP
usage preferences. We designed and developed a specific piece of software, which aims to discover the best
recommendations for What-If analysis scenarios’ parameters using OLAP usage preferences, which
incorporates user experience in the definition and analysis of a target decision-making scenario.
1 INTRODUCTION
What-If analysis (Golfarelli et al., 2006) processes
allow for creating simulation models aiming to
explore the behavior of complex business systems.
More pragmatically, they contribute for analyzing the
effects on the behavior of a particular business system
caused by a change of variables and values, which
usually cannot otherwise be discovered by a historical
data manual analysis process (Koutsoukis et al.,
1999). In a real system, the main advantage of
creating a simulation model through What-If analysis
is to be able to implement changes in characteristics
of the business without endangered it (Kellner et al.,
1999). What-If analysis techniques are one of the
most recently ways to achieve these goals. Decision-
makers need to create What-If analysis scenarios to
test and validate their business hypothesis and support
their decisions. In fact, What-If analysis can be the
safer solution towards some doubt and the decision
maker needs to assess to ensure, if possible, that the
subsequent decision will have some success.
Moreover, it allows for analyzing different scenarios
and perspectives of business, anticipating some
solutions.
Online Analytical Processing (OLAP)
(Harinarayan et al., 1996) systems are one of the most
predominant tools for decision-support systems. They
provide specialized means for business analytics as
well as multidimensional view over business data that
are very efficient logical ways for analyzing
businesses activities and organizations. A decision-
support analysis process is an interactive exploration
of multidimensional databases, often performed in ad
hoc manner that allows for users to see data from
different perspectives of analysis. Decision-makers
frequently post complex queries to OLAP systems,
which originate answers containing huge volumes of
data that are quite difficult for analysis and
consequent usage on business scenarios. Thus, it is
essential to filter this information in a way that
contents do not loose significance, being adjusted
according to users needs and business requirements.
The extraction of usage preferences according to each
analytic session promoted by users may come as an
advantage to decision-makers, since it provides a very
effective way to personalize analytical sessions and
multidimensional data structures acting as their
decision-making support. Currently, OLAP systems
technology already provides means for doing
interactive analysis of multidimensional data based
on a set of navigational operations usage and patterns
(Jerbi et al., 2009).
In this paper we present and discuss the
integration of OLAP usage preferences in
conventional What-If scenarios as a mean to improve
Carvalho, M. and Belo, O.
Enriching What-If Scenarios with OLAP Usage Preferences.
DOI: 10.5220/0006040402130220
In Proceedings of the 8th International Joint Conference on Knowledge Discovery, Knowledge Engineering and Knowledge Management (IC3K 2016) - Volume 1: KDIR, pages 213-220
ISBN: 978-989-758-203-5
Copyright
c
2016 by SCITEPRESS – Science and Technology Publications, Lda. All rights reserved
213

the quality and effectiveness of decision models
related to problems requiring perceptions from the
user point of view. This will avoid the lack of
expertise of the user in the implementation of What-
If scenarios and models. Thus, we designed and
implemented a decision-support system with the
ability to receive a What-If scenario supported by
analytical preferences, which provides us strong
arguments for improving the simulation of a given
system’s behavior based on the preferences of its
users. The system has the ability to suggest OLAP
preferences, providing to the user the most adequate
scenario parameters according to its needs. It was a
way that we find to enrich and make more valuable
What-If scenarios.
This paper is organized as follows. In section 2 we
present an overview about OLAP preferences and
applications. Next in section 3, we describe the entire
process: the database used for test case study, how the
association rules algorithm works, a brief formal
description of OLAP preferences and how we extract
the association rules of the data cube. In section 4 we
describe the lasts steps of our methodology: showing
how the What-If scenarios are created and enhanced
using the extracted OLAP preferences, moreover we
show how the application works, showing all the
steps between the extraction of the rules until the
definition of the What-If scenario. Finally, section 5
concludes the paper and discusses some possible
future research directions.
2 RELATED WORK
As stated before, the main purpose of this work is to
improve What-If scenarios using OLAP preferences;
in this section we show how preferences are used to
improve decision-making process, either in relational
databases, in OLAP environments, or even in daily
tasks, like traffic analysis. The research on databases
preferences goes back to Lacroix and Lavency
(1987), which was one of the first works that
presented and discussed a preference mechanism as
an extension of a query language. Later, in Agrawal
and Wimmers (2000) it was proposed a formal
framework for expressing and combining user
preferences to address the problem of the high
quantity of available on-line information. After this,
in Chomicki (2003) it was presented a logical
framework for formulating preferences and
embedding them into relational query languages,
which does not impose any restrictions on the
preference relations, and allows for arbitrary
operations and predicate signatures in preference
formulas. After this, a different approach to database
preferences queries presented in Hadjali et al. (2008)
discussed the way we can deal with preferences in a
logic manner using symbolic weights. At the same
time new approaches emerged, new applications
areas arose as well. See for example the work
presented in Letchner et al. (2006) in traffic analysis
where authors presented a set of methods for
including driver preferences and time-variant traffic
condition for in route planning.
OLAP preferences reflect the most interesting
data that decision-making agents selected and
analyzed in past OLAP sessions, using a specific set
of data cubes during certain periods of time
(Harinarayan et al., 1996). More recently, preferences
capture the attention of many researchers in the field
of databases, especially in the field of on-line
analytical processing, approaching the extraction of
preferences using data mining techniques over users’
MDX queries logs (Aligon et al., 2011) or the
specification of an algebra for OLAP preferences
(Golfarelli and Rizzi, 2009). Meanwhile, in
Giacometti et al. (2009) it was presented a
recommender system for OLAP users having the
ability to recommend to the user discoveries detected
on former sessions and in Ahmed et al. (2012) it was
introduced a new approach for user profile
construction based on the information contained in
OLAP query logs. Two years later, in Varga et al.
(2014), it was proposed another framework, but this
one to support users assisting them generally in the
automation of their activities in the context of the next
generation of business intelligence systems using
query recommendation support. Next, in Marcel
(2014) it was summarized various contributions for
developing user-centric OLAP, focusing on the use of
former queries to enhance subsequent analyses. They
show how it can be used in various query
personalization processes or query recommendation
approaches, which vary in terms of formulation
effort, pro activeness, prescriptiveness and expressive
power. To finish this section, just refer the work
presented in Kozmina (2015), which provided a
method for generation of report recommendations
that takes into consideration the preferences of the
users, and, more recently, the work presented in
Bimonte and Negre (2016) that showed the usefulness
of OLAP recommender systems on decision-making
activities.
KDIR 2016 - 8th International Conference on Knowledge Discovery and Information Retrieval
214
3 EXTRACTING OLAP
PREFERENCES
3.1 A General Overview
As stated before, we want to discover the best
recommendations for What-If analysis scenarios
based on past usage information. The main difference
between our approach and standard What-If analysis
methods is the introduction of a process of extraction
of usage preferences on a business multidimensional
database and using them before the simulation of the
model, which allows for having the basis to predict
the behaviour of a given scenario. The process of
extracting OLAP preferences considers five distinct
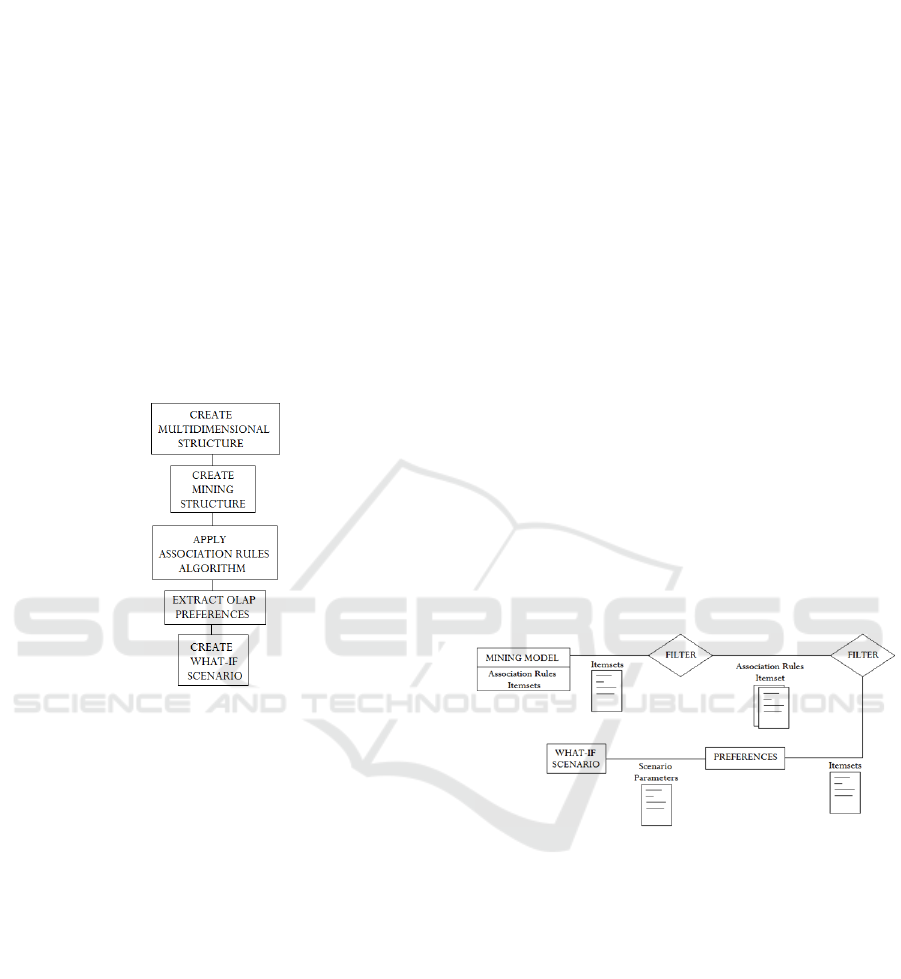
phases (Figure 1):
Figure 1: Enriching a What-If scenario.
Thus, firstly we start with a view selection process
over the data cube we selected to support our work.
We start with a small case study, which considers a
single fact table - “Internet Sales” - and related
dimension tables – “Dim Currency”, “Dim
Customer”, “Dim Product”, “Dim Promotion”, “Dim
Sales Territory”, and “Dim Date”. All these data
objects were extracted from the
“AdventureWorksDW2014” (Microsoft SQL Server
Product Samples: Database, 2015), a small data
warehouse provided by Microsoft as a product sample
for Microsoft SQL Server. In the second phase, we
create and analyze a specific data cube using the
previous data objects as an example for future
complex cases. With the reduction of the size of the
cube, the complexity of the database reduced as well,
and the same happens with the time need to extract
the data we use and process it. Next, we create the
mining structure and define the mining model to
support a mining association process that runs in the
third phase over the cube we created (Han, 1997).To
do that we selected the Microsoft Association Rules
algorithm (Agrawal and Srikant, 1994) that comes
with Microsoft Analysis Services. This Apriori based
algorithm fits well on mining processes that involves
recommendation engines or processes for finding
correlations between different attributes in a given
dataset – in our case we have a recommendation
engine for the suggestion of the items that are most
likely to appear together in a particular search of a
What-If scenario. As other Apriori based association
algorithms, we can define the minimum and the
maximum support values to control the number of
item sets that are generated, and we can also restrict
the number of rules that a model produces by setting
a value for a minimum probability. Even in this stage,
all the rules and item sets extracted are stored in the
mining model. An association mining model has a
simple structure organized in two blocks: 1) the
information about itself and its metadata, and 2) a flat
list containing item sets and rules. Item set nodes
include the definition of the item set, the number of
cases that it contains, and other diverse information
for support. In turn, a rule node describes a general
pattern for the association of items. Every node has
detailed information about the item set or the rule that
will be relevant in the next steps of the process. All
this is use for defining the OLAP preferences on the
fourth stage.
Figure 2: Extracting OLAP preferences.
The process of extracting OLAP preferences (Figure
2) starts with the choice of a user preference item
from a list of frequent item sets of the mining model
(ordered by probability). Next, it filters the list of
association rules taking in count the chosen item set,
returning only the association rules having the
support and confidence previously defined and
containing the chosen item set. The returned
association rule list is used then to form the set of
OLAP preferences for the user. This means that the
item sets of the association rules returned as outcome
are suggested to the user as its business preferences
and then they will be taken into consideration in the
What-If scenario as configuration parameters.
Knowing beforehand cube preferences can have a
significant impact on the outcome results of the
Enriching What-If Scenarios with OLAP Usage Preferences
215
analytical system. Using OLAP preferences, it is
possible to provide exactly the most relevant and
useful information to each specific user in a specific
analysis scenario. Aftermath, there is a significant
reduction of the cube implementation costs,
processing time and memory usage. The cube will
include in its structure only the data that match user
preferences and so it will returns only the data that
interest to user. Moreover, the entire analysis process
can be improved. As already noticed, a cube is a very
complex data structure and it can be difficult for an
analyst to acquire the information he want. With a
simple interface having the ability to recommend the
right queries based on the history of past analytical
sessions makes much simpler the process of
extracting information.
3.2 Dealing with Preferences
Now it is time to define formally what is a preference,
introducing it with a simple working example based
on the works presented in (Kießling, 2002; Ore and
Ore, 1962). Thus, given a set of attributes A, a
preference P is a strict partial order defined as P (A,
<P), where <P is an irreflexive, transitive and
asymmetric binary relation <P ⊆ dom(A) × dom(A).
If X <P Y, then ‘Y is preferred to X’. A preference P
= (A, <P) is an irreflexive, transitive and asymmetric
binary relation <P on the domain of values of
attributes set A. Let see how this works. If we
consider to analyze how sales vary with the number
of costumers having children living at home, to set its
preferences a user need to choose one of the elements
included in the set of the frequent item sets. This will
allows for choosing the rules that will be used to set
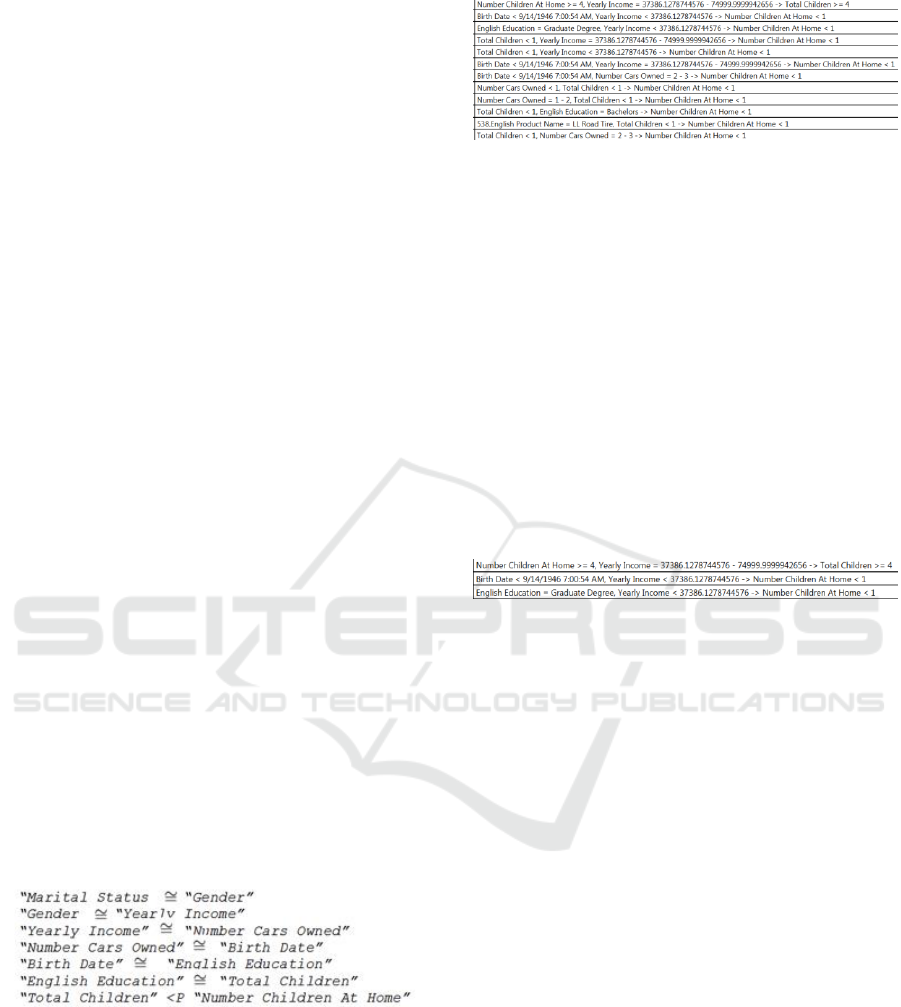
user preferences. Thus, assuming that the user
chooses “Number Children At Home”, using the
previous defined semantics, we have:
In other words, the attribute “Number Children At
Home” is preferred to the attribute “Marital Status”,
“Gender”, “Yearly Income”, “Number Cars Owned”,
“Birth Date”, and so on. Thus, “Marital Status” is
equivalent to “Gender”; “Gender” is equivalent to
“Yearly Income”, “Yearly Income” is equivalent to
“Number Cars Owned”, and so on. Based on this set
of previous preferences, it is possible to select a set of
association rules that contains the attribute “Number
Children At Home” (Figure 3).
Figure 3: The association rules for a given preference -
‘Number Children At Home’.
Accordingly its own business preferences, the user
may choose N association rules, for example the top
3 association rules (Figure 4) of the previous set
(Figure 3), which will be used later to define his
OLAP preferences. This means that the item sets
contained in the filtered association rules will be
suggested to the user as preferences. For example, if
the returned list of association rules is the list in
Figure 4, the recommendations to the user will are
“Number Children At Home”, obviously, “Birth
Date”, “Yearly Income”, “English Education” and
“Total Children”. After this step, the user chooses the
item sets of his preference that will be used as
configuration parameters in the What-If scenario.
Figure 4: A list of some filtered association rules.
4 ENRICHING What-If
SCENARIOS
Basically, What-If analysis can be described as a data
simulation technique whose goal is to inspect the
behavior of a complex system under some given
hypotheses, usually called as scenario. More
pragmatically, What-If analysis measures how
changes in a set of independent variables impact on a
set of dependent variables with reference to a given
simulation model. The integration of OLAP usage
preferences in What-If scenarios for business analysis
enhancement is not a very common thing.
The main focus of a What-If application is a
simulation model (Figure 5). Commonly, this model
is a representation of a real business model that
usually is organized into several application
scenarios. Each one of these scenarios considers a set
of business variables (the source variables) and a set
of setting parameters (scenario parameters). It is the
user that has the responsibility to edit such variables
and obtain some kind of prediction (a new scenario)
for the previous business application.
KDIR 2016 - 8th International Conference on Knowledge Discovery and Information Retrieval
216
Figure 5: A general overview of a What-If analysis process.
The use of What-If analysis allows for the user to
inspect the behavior of a given complex system. The
implementation of a What-If process provides for
several advantages to a business user. It makes
possible to study the behavior of a system without
building it or creating the circumstances to make it
happen in a real world system, clearly saving time and
reducing costs. Besides that, it provides the means to
modify business variables as needed in order to find
potential unexpected behaviors of the business
system, which gives to business managers the
possibility to be aware of the conditions that may lead
to an erratic system behavior and so create the basis
to avoid it in the future.
In order to improve this process, we use
preferences as recommendations to help enhancing
What-If application scenarios. The use of preferences
in this case can be beneficial. The main advantage is
to become possible to simulate a system behavior
based on past data extracted from OLAP sessions.
Preferences have the ability to recommend to the user
the axes of analysis that are strongly related to each
other, helping him to introduce valuable information
in the application scenario he is building. Preferences
are pieces of data that users give more attention in
OLAP sessions, conditioning their ad hoc analysis
and decision-making tasks. They can be defined
based on historical data provided by a simple business
application or from a more sophisticated piece of
software like a data mining system. Often a
preference reflects also hidden patterns that were
detected in the data set. Using association rules based
on preferences has the advantage that the user does
not need to know the business domain. Preferences
can also helping control over the returned
information, providing access to relevant information
and eliminating the irrelevant one. One may not know
the proportions of the outcome: it may be an empty
result, or an information flooding. Due to this, query
runtime can be enhanced against cases without
preferences. Consequently, in our process, we get
more focused and refined results, which helps both a
user who is not familiar with the business analysis and
an analyst who is familiar with the business modeling
data.
Our process proceeds as is shown in Figure 6.
Firstly, we use an OLAP data cube as input. The input
data will be used to define the application scenario
based on historical data extract from previous OLAP
sessions. Then, we define the scenario settings,
delineating the axis of analysis, the set of values for
analyzing, and the set of values to change according
to the goals defined previously. This last step usually
differs among distinct analysis tools. Then, the What-
If process proceeds with choosing a tool. To run a
simulation model (a scenario based on historical data)
it is required an appropriate tool (a What-If scenario
analysis tool), in order to get a prediction scenario.
The What-If analysis tool calculates and lets the user
to explore and analyze the impact of the changes in
the setting values of the entire application scenario. It
is the user that is responsible to accept the new data
cube, or return to change the settings of the
application scenario and make the changes required
over to the target data.
Figure 6: A general overview of a What-If analysis process.
Figure 7: The user interface of the application for What-If
analysis enrichment.
Now we will present an example of the business
application. As stated previously, the extraction of
association rules and OLAP preferences are used to
define the configuration parameters of the What-If
scenario. As a demonstrative example, we will
consider the following business application scenario:
our main goal is to analyze the evolution of the sales
amount (represented by the Y axis) according to the
number of customers’ children at home and year
(represented by the X axis) – value that is given by
the attribute “Number Children At Home”.
Without OLAP preferences (see points 4 and 5 of
Figure 7), an analyst may select for his application
scenario the attributes “Number Children At Home”,
“Sales Amount” and probably “Calendar Year”. If so,
we got a chart like the one presented in Figure 8. So,
with the results got it in the previous section we
Enriching What-If Scenarios with OLAP Usage Preferences
217
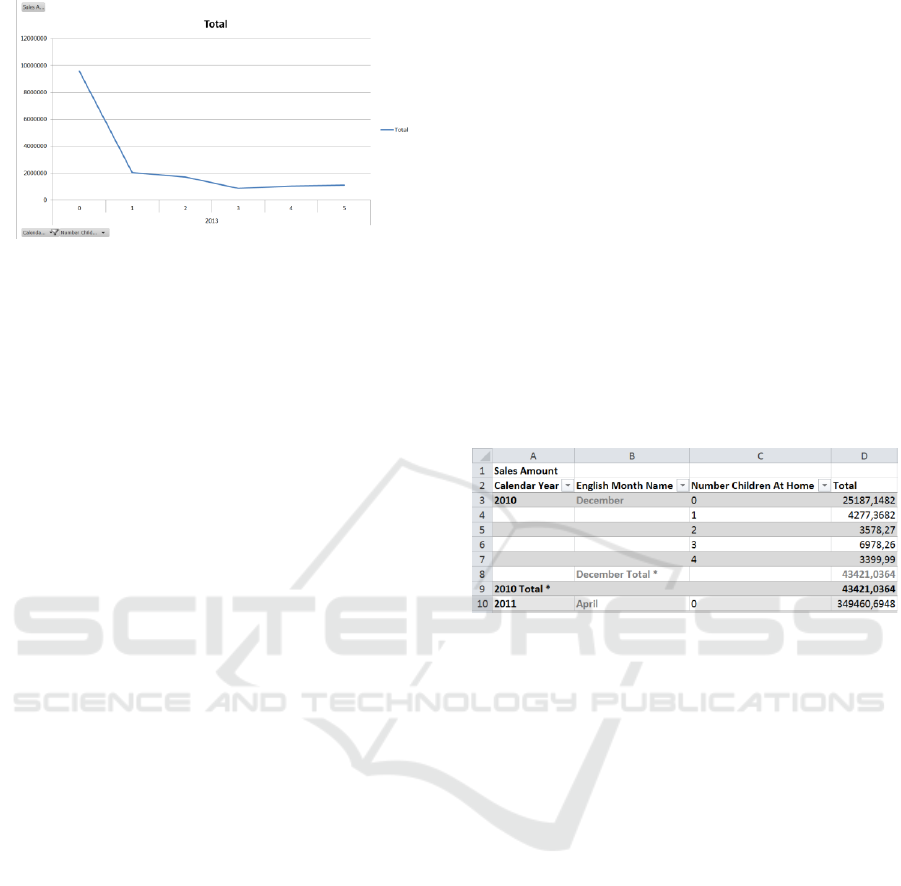
Figure 8: A scenario without OLAP Preferences.
realized that there are several attributes strongly
related to our target attribute – “Number Children At
Home” -, such as ‘Yearly Income’ and ‘English
Education, which means that these attributes would
significantly improve our analysis when toke as
configuration parameters in our business application
scenario.
To support and perform What-If analysis
processes we choose Microsoft Excel, since it allows
for creating PivotTable reports based on OLAP
source data. OLAP PivotTable Extensions is an Excel
add-in, which extends the functionality of
PivotTables on Microsoft Analysis Services
multidimensional structures. Excel can be used as an
OLAP analytical tool to easily analyze and modify
data stored on data cubes. It is possible to modify data
using a PivotTable and to recalculate all data as
necessary, and, if the outcome is acceptable, to
publish all changes so that they are copied into the
OLAP cube. It is this property of Excel that allows for
to do What-If Analysis and to create new application
scenarios with the data that was recalculated.
After choosing the parameters for the What-If
scenario, the user can make some changes – e.g.
increasing the total sales values by 10%. Then,
Microsoft Excel calculates how the new value will
modify the old values, based on the properties of
‘What-If Analysis Settings’. Microsoft Excel allows
for the user to calculate data with changes that were
made manually (the user decides when the changes
are made) or automatically (when each value is
changed), to choose the allocation method (‘Equal
Allocation’ or ‘Weighted Allocation’) and finally to
select the value to allocate - the value entered is
divided by the number of allocations or it is
incremented based on the old value. Next, the new
What-If scenario, the scenario with new calculated
values, will be displayed to the user.
In our study, the application we developed allows
for the user: to create What-If scenarios choosing the
available attributes of his choice (first tab in Figure
7); to consult the mining models’ item sets and
association rules (second tab in Figure 7); and both
options together, which we call the hybrid model
(third tab in Figure 7), which aims to create What-If
scenarios using preferences obtained with the mining
models’ association rules. For example, an analyst
wants to analyze how the sales evolve within a
specific customer profile (target audience), in order to
know how sales may vary with the number of cars
owned by the customer. The extraction of association
rules and the sales preferences of the customers may
show that the number of children at home is strongly
related with customers’ yearly income and education.
And with these three analysis axis (perspectives of
analysis), the What-If scenario would be more
accurate and specific, leading to better results, for
example, when a company manager wants to assign a
specific promotion or discount for a specific target
audience.
Figure 9: Example of a business application scenario in a
MS Excel PivotTable.
The Hybrid tab (Figure 7) is the main point of interest
of our application. It provides users with information
about association rules that were extracted from the
cube structure, creates preferences, and recommends
them to the user, in order to create a What-If
application scenario. In the first step of this process,
the user sets values to filter both the support and
probability of both item set and rules (as was seen
before in step 1). This way, it is possible to refine
users’ preferences, leading to a specific and filtered
outcome. The association rules extracted from the
mining model can also be filtered as the item sets (as
seen in step 3 of the process) and displayed ordered
by decreasing values of probability.
In a later phase, the application suggests a set of item
sets (contained in the chosen rules). The user chooses
the item sets, which will be part of the What-If
application scenario. For example, if the chosen item
sets are “Calendar Year”, “Number of Children”,
“Gender” and “Marital Status”, respectively. the
application creates the (partial) PivotTable presented
in Figure 9. We use this set of attributes, instead of
“Yearly Income” and “English Education” in order to
be easy to understand the What-If charts. The
KDIR 2016 - 8th International Conference on Knowledge Discovery and Information Retrieval
218
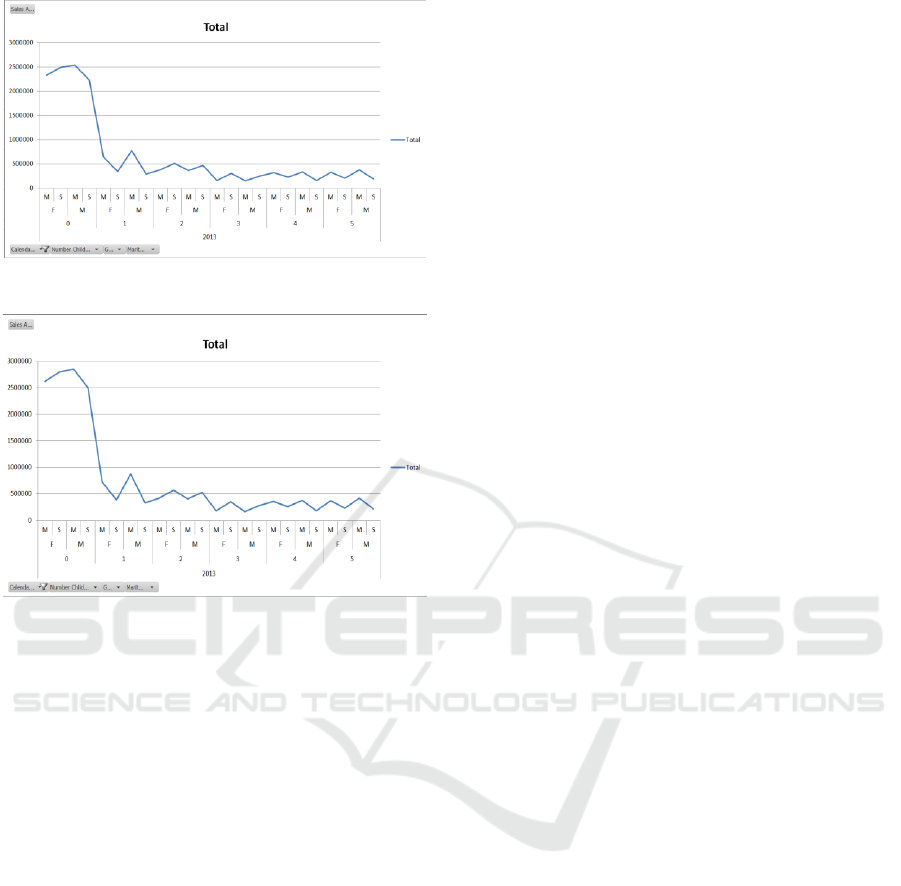
Figure 10: A possible business application scenario.
Figure 11: The enhanced What-If scenario.
business application scenario we created allows for
the user to see the current sales amounts and its
correspondent growth over the years (Figure 10).
Consequently, after analyzing the current sales
scenario (Figure 10), the user can assign an intended
new final value and analyze how could have been the
evolution of sales amount, in order to achieve the
desired sales amount values. In this case, the
pretended value is the double the final sales amount.
The What-If scenario that was created (Figure 11)
contains the same axis of the previous scenario, but
the values involved with are slightly different.
Nevertheless, there are some limitations associated to
the application we developed. We used one Excel
function, more specifically the What-If analysis
functions over a PivotTable. This function is
performed using the ‘AllocationMethod’ property
setting to ‘Weighted Allocation’ (instead of ‘Equal
Allocation’ setting). With ‘Weighted Allocation’,
Excel calculates the new What-If scenarios (overall
values of the PivotTable) by increasing or decreasing
the overall values in proportion, for example, if the
new final value is 10% higher than the monthly values
are increased by 10%. This must be improved in the
next version of the application for having a more
effective What-If scenario generation.
5 CONCLUSIONS
In this paper we show how OLAP preferences can
contribute for enhancing a What-If scenario,
improving the quality and effectiveness of decision
models where perceptions from the user point of view
can make the difference in a decision-making
process. We implemented a decision-support system
with the ability to receive a What-If scenario that
incorporates usage analytical preferences for
improving the simulation of a given business
application scenario. The system has the ability
provide to its users the most adequate scenario
parameters according to its needs taking into
consideration a set of OLAP preferences that were
extracted from past OLAP sessions. This contributes
significantly to enrich a make more valuable a What-
If scenario for a particular business domain. At this
point, we believe that the process we followed during
the design and implementation of our system can help
in the evaluation of business scenarios that integrate
process solutions for analytical data exploration
environments. Nevertheless there we also recognized
some limitations that need to be overcome, in order to
make the system more efficient, especially at the level
of the usage of Microsoft Office Excel functions and
within the What-If process itself. Additionally, we
need to free the system from some limitations
imposed by user’s choices done in the most parts of
the What-If process. This is must be avoid, because a
user that has limited knowledge about the business
domain or even about the simulation process to be
implemented influences the entire process negatively,
leading consequently to poor results.
Despite the several advantages of using
preferences, there are some drawbacks related to this
process. Due to the use of an association rules
algorithm, sometimes it is difficult to interpret the
results and so some information may be lost. A user,
who is not aware of this process, can have significant
difficulties for exploring meaningful associations.
Additionally, we can face some difficulties in the
What-If process. In a first stage of the What-If
process, if the goal analysis is not done correctly,
What-If questions and scenarios will be not correctly
defined or the preferences outcome will be not
reliable. Thereafter, performed What-If queries will
be not the most suitable process and thus the obtained
prediction will be different of what is expected as a
normal behavior of a real business system. One way
of avoiding this is to study potential and alternative
application scenarios, in order to take the best
advantages of the What-If scenario analysis tool.
Finally, the What-If Analysis results depend strongly
Enriching What-If Scenarios with OLAP Usage Preferences
219

from the data we want to analyze. If it contain some
errors, which is a very common situation, the result
will not be very useful. In order to overcome this kind
of drawbacks, we mainly aim at restructuring
automatically the What-If scenarios, discarding the
user’s dependency and finding a way of overcoming
the limitation we found in some Excel functions.
REFERENCES
Agrawal, R., Wimmers E., 2000. A framework for
expressing and combining preferences. ACM SIGMOD
Record. 29 (2).
Agrawal, R., Srikant, R., 1994. Fast algorithms for mining
association rules. In Proc. 20th int. conf. very large data
bases, VLDB. 1215, pp. 487-499.
Ahmed, E. B., Nabli, A., Gargouri, F., 2012. Building
MultiView analyst profile from multidimensional query
logs: from consensual to conflicting preferences.’ arXiv
preprint arXiv:1203.3589.
Aligon, J., Golfarelli, M., Marcel, P., Rizzi, S., Turricchia,
E., 2011. Mining preferences from OLAP query logs
for proactive personalization. Advances in Databases
and Information Systems. Springer Berlin Heidelberg.
Bimonte, S., Negre, E., 2016. Evaluation of user
satisfaction with OLAP recommender systems: an
application to RecoOLAP on an agricultural energetic
consumption datawarehouse. In International Journal
of Business Information Systems, 21(1), pp. 117-136.
Chomicki, J., 2003. Preference formulas in relational
queries. ACM Transactions on Database Systems
(TODS). 28(4), pp. 427-466.
Giacometti, A., Marcel, P., Negre, E., Soulet, A., 2009.
Query recommendations for OLAP discovery driven
analysis. In Proceedings of the ACM twelfth
international workshop on Data warehousing and
OLAP.
Golfarelli, M., Rizzi, S. Proli, A., 2006. Designing What-If
Analysis: Towards a Methodology. In DOLAP’06,
Arlington, Virginia, USA, pp. 51-58.
Golfarelli, M., Rizzi S., 2009. Expressing OLAP
preferences. Scientific and Statistical Database
Management. Springer Berlin Heidelberg.
Hadjali, A., Kaci S., Prade H., 2008. Database preferences
queries - A possibilistic logic approach with symbolic
priorities. Foundations of Information and Knowledge
Systems. Springer Berlin Heidelberg. pp. 291-310.
Han, J., 1997. OLAP mining: An integration of OLAP with
data mining.’ In Proceedings of the 7th IFIP.
p. 1-9.
Harinarayan, V., Rajaraman, A. Ullman, J., 1996.
Implementing data cubes efficiently. ACM SIGMOD
Record. 25(2).
Jerbi, H., Ravat, F., Teste, O., Zurfluh, G., 2009.
Preference-based recommendations for OLAP analysis.
Springer Berlin Heidelberg.
Kellner, Marc I., Madachy, R., Raffo, D., 1999. Software
process simulation modeling: why? what? how?.
Journal of Systems and Software. 46(2), pp. 91-105.
Kießling, W., 2002. Foundations of preferences in database
systems. In Proceedings of the 28th international
conference on Very Large Data Bases (pp. 311-322).
VLDB Endowment.
Kozmina, N., 2015. Producing Report Recommendations
from Explicitly Stated User Preferences. Baltic Journal
of Modern Computing, 3(2), pp. 110.
Koutsoukis, N., Mitra, G., Lucas, C., 1999. Adapting on-
line analytical processing for decision modelling: The
interaction of information and decision technologies.
Decision Support Systems. 26(1), pp. 1–30.
Lacroix, M., Lavency P., 1987. Preferences; Putting More
Knowledge into Queries. In VLDB. 87, 1987.
Letchner, J., Krumm J., Horvitz E., 2006. Trip router with
individualized preferences (trip): Incorporating
personalization into route planning. In Proceedings of
the National Conference on Artificial Intelligence.
21(2), pp. 1795.
Marcel, P., 2014. Log-driven User-centric OLAP. In
Information and Communication Technology,
Electronics and Microelectronics (MIPRO), 37th
International Convention. pp. 1446-1451.
Microsoft SQL Server Product Samples: Database (2015)
Available at:
[http://msftdbprodsamples.codeplex.com/]
[Accessed 13 fev. 2016].
Ore, O., Ore, Y., 1962. Theory of graphs (Vol. 38).
Providence, RI: American Mathematical Society.
Varga, J., Romero, O., Pedersen, T. B., Thomsen, C. 2014.
Towards next generation BI systems: The analytical
metadata challenge. In Data Warehousing and
Knowledge Discovery. pp. 89-101.
KDIR 2016 - 8th International Conference on Knowledge Discovery and Information Retrieval
220
