
IDAC: A Sensor-based Model for Presence Control and Idleness
Detection in Brazilian Companies
Rodrigo da Rosa Righi
1
, Gustavo Rostirolla
1
, Eduardo Souza dos Reis
1
, Gabriel Fischer
1
,
Victor Chang
2
and Muthu Ramachandran
2
1
Applied Computing Graduate Program, Universidade do Vale do Rio dos Sinos (Unisinos), S
˜
ao Leopoldo, RS, Brazil
2
School of Computing, Creative Technologies & Engineering, Leeds Beckett University, Leeds, U.K.
Keywords:
Location-awareness, Sensor Networks, Social Implications for IoT, Idleness Detection, Presence Control.
Abstract:
This article proposes a new model named IDAC for idleness detection and automatic clocking in Brazilian
companies. Based on the studies and the gaps identified in related work, we highlight the model features and
how it interacts with sensors, providing idleness detection based on the historical movement of the employees.
We developed a prototype that was evaluated through simulation, taking into account the architectural plant
and the employees behavior of five real Brazilian companies. The results reveals the benefits of using IDAC
both at the owner (control and productivity) and employees (the clocking actions occurs automatically) levels.
1 INTRODUCTION
Today, we perceive the growing adoption of the Inter-
net of Things (IoT), where RFID (Radio-Frequency
Identification) appears as the most used sensor tech-
nology to turn IoT into a reality (Ryu et al., 2013).
RFID is a wireless identification technology that can
locate physical objects and connect them to the virtual
world, allowing various applications, as the mobile
payment systems (Pedraza et al., 2010). In general,
the RFID technology is commonly employed in con-
text awareness or presenting the location and informa-
tion of objects precisely. Hence, through an informa-
tion management system composed by historical data
of each object, we can interact with them in order to
solve or minimize problematic situations of our daily
activities (Atzori et al., 2010; Narzt et al., 2015).
Among the various situations of our daily lives
that can be optimized using context-awareness, one
of them is the clocking (Akkaya et al., 2015). In this
context, the most used technologies are paper-based
card-points and magnetic card-peer systems. More-
over, some companies use safer technologies, includ-
ing biometric recognition and others work based on
the recording of entry and exit times by hand on a
time-sheet (Pereira, 2012). As a common feature, all
these forms depend on the employee decision to clock
in. They are not automated and if the employee forget
to clock in or out, his/her point-sheet remains incom-
plete. Furthermore, the usual point-sheet payroll sys-
tem allows the manager to know when the employee
entered and left the company, but may not identify
how this time interval is being spent by the employee:
he/she may take long breaks, which may be frequent.
In a company with hundreds or thousands of employ-
ees, it is virtually impossible to identify how produc-
tive the time spent by the employees at the company
actually is.
We witness how hard the manager’s task of con-
trolling the working ours of the employees can be.
Relying solely on the judgment of the manager to de-
cide about both idleness and activity of its employees
without any form of registration becomes a risky task,
with great chances of occasioning assessment errors.
Having identified this problem, we developed a model
named IDAC: a context-awareness model to both con-
trol presence and detect idleness using sensors to indi-
cate the movement of employees within the environ-
ment of Brazilian companies. The IDAC’s idea is to
allow not only to control entry and exit times, but also
to view, using a management tool, how much time
each employee spent on each of the company’s areas.
In this way, the manager can assess how long they are
active on their desk and how long they are idle, out
of their workplace or in recreation areas for instance.
The IDAC’s scientific contribution is emphasized on
its algorithm and framework for detecting idleness:
based on a set of rules that can be changed dynami-
cally, being able to identify situations that differ from
what the managers expect.
Righi, R., Rostirolla, G., Reis, E., Fischer, G., Chang, V. and Ramachandran, M.
IDAC: A Sensor-based Model for Presence Control and Idleness Detection in Brazilian Companies.
DOI: 10.5220/0005954304790486
In Proceedings of the International Conference on Internet of Things and Big Data (IoTBD 2016), pages 479-486
ISBN: 978-989-758-183-0
Copyright
c
2016 by SCITEPRESS – Science and Technology Publications, Lda. All rights reserved
479

The remainder of this article will first present the
related work in Section 2, the IDAC model in Sec-
tion 3, the evaluation methodology in Section 4 and
finally, the results and conclusion in Sections 5 and 6
respectively.
2 RELATED WORK
Based on the research theme, related works that solve
similar problems, or can be used as a base for possi-
ble solution attempts, were analyzed. The evaluated
works are presented in Table 1, which shows the fea-
tures, based on defined criteria, for each one of the
approaches.
Table 1: Comparative Table between Related Work.
Work Technologies Passage
Record
Identify
Location
Idleness
Detec-
tion
(Neiva,
2012)
RFID No Current No
(Pereira,
2012)
RFID and
Biometrics
Incoming
and outgo-
ing
No No
(Ahgora,
2015)
RFID and
Biometrics
Incoming
and outgo-
ing
No No
(CH&TCR,
2015)
RFID Incoming
and outgo-
ing
Current
and
traveled
route
No
There are currently an increasing number of trends
aiming to generate people records using the RFID
technology, although there are not so many trends
when the subject is the clocking systems. Consider-
ing the analyzed works we can notice that it is pos-
sible to use technology to record not only the time
spent by employees in companies, but also generate
an accurate record of the passages of these employees
through internal environments.
Based on the current state of the art and the gaps
identified in related work, one can see that it is possi-
ble to perform electronic time-card records using the
RFID technology, as well as identify the location of
a person within an environment. However, many of
the approaches are still based on the employee’s con-
scious choice to record his presence using a tag in
a reader, not exploiting the capacity of automatizing
this process. Also, most approaches do not seem to go
deep enough to identify where are the staff members
after the registration and who can identify their lo-
cation do not use these data in order to identify possi-
ble idleness patterns. Considering the aforementioned
gaps, this article presents the IDAC model for Pres-
ence Control and Idleness Detection inside Brazilian
companies.
3 IDAC: IDLENESS DETECTION
AND AUTOMATIC CLOCKING
IDAC aims to identify the entry and exit of employees
automatically using RFID technology, creating an ac-
curate and consistent point-sheet record. It also iden-
tify where employees are within the company’s en-
vironment and analyze these data in order to realize
when they are idle. The model assumes that there are
RFID readers scattered throughout the company envi-
ronment, which can identify employees who pass by
them. Each employee must have a tag that enables the
system to identify him and carry it with him through
their whole shift, furthermore, this tag must be linked
to a specific job by the employer.
The operation is based on the ability to schedule
the arrival and exit of each employee at the company’s
environment and register it in the point-sheet, gener-
ating reliable markings for the workday. It should also
record all the passages of employees through business
environments, so that whenever an employee stays
more than a certain time away from their worksta-
tions, the system is able to identify and store this in-
formation. Moreover, it identifies when groups of two
or more employees are out of their jobs, characteriz-
ing a grouping, and when an employee receives a visit
of others at his workstation.
The IDAC system is divided into five modules,
they are responsible for processing information from
its capture by the RFID reader to the final result,
which is displayed to the employees and managers
through a web application. Figure 1 presents the
framework proposed for the IDAC model and its mod-
ules are described below.
IDAC CaptureRFID is the module responsible
for receiving the data captured by RFID readers and
store it on the database. This step does not perform
any processing on the information. Thus, three infor-
mation are stored in the database for each capture: the
read tag’s identifier, a timestamp and the reader iden-
tifier. The final result is stored as Raw Data, since it
is the main entrance of data into the system, this mod-
ule must be able to capture information very quickly,
avoiding bottlenecks, so no further processing is ap-
plied, ensuring that the information is persisted as
soon as possible.
IDAC
Formatter is the module responsible for
performing the pre-processing of the Raw Data. At
this stage, the employee that owns the tag and the sen-
sor that read it are identified through the identifiers. If
RAIBS 2016 - Special Session on Recent Advancement in IoT, Big Data and Security
480
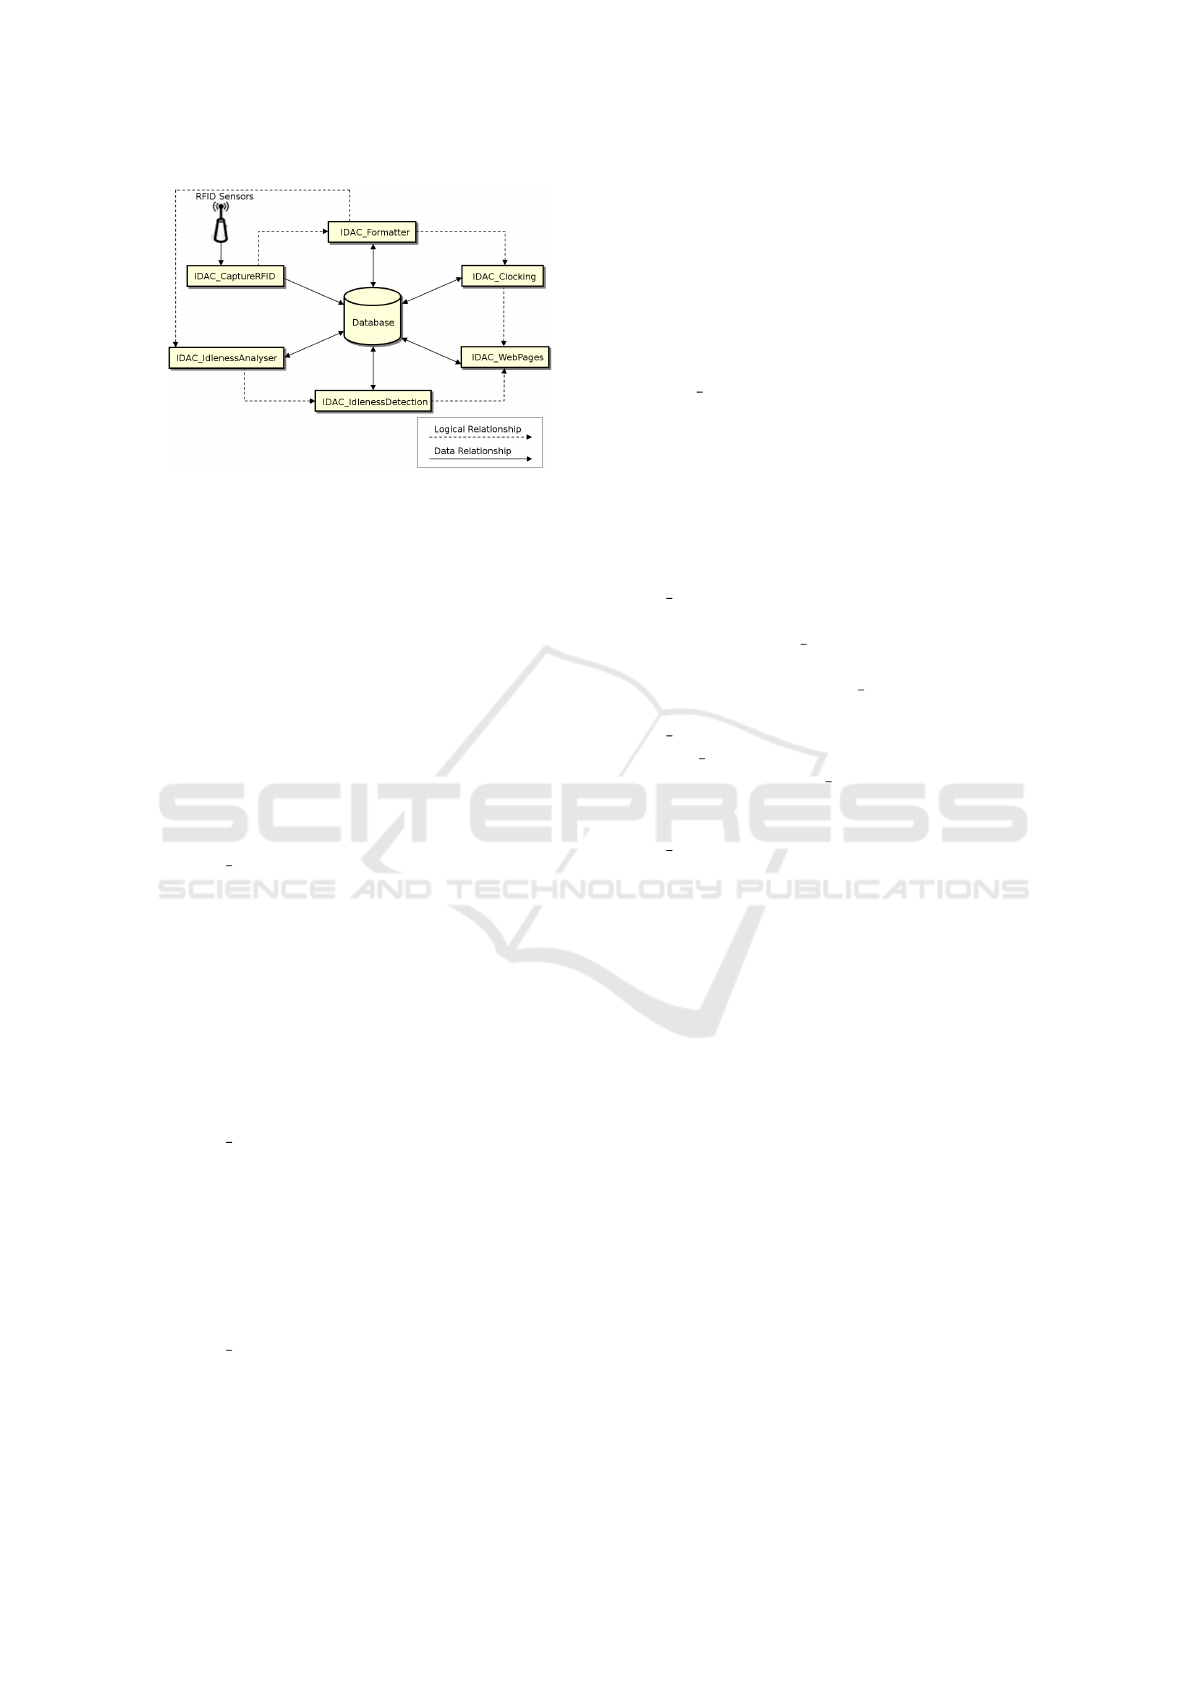
Figure 1: Framework IDAC. The logical relationship refers
to the data path between the modules, from data readings
by sensors until information visualization in the WebPages
module. The data relationship application refers to the ac-
tual course of the system data. No module communicates
directly with another module, communication is always car-
ried out through the database.
it is a time-card sensor, it creates a Clocking Marking,
otherwise it is instantiated as a Passing by Marking
and the final result is stored in the database. Since it
is a module that searches and makes a pre-processing
of the information, it runs the whole time on back-
ground, waiting for the arrival of new Raw Data. If
a very large batch arrives all at once, the system will
compute little by little, avoiding overloads in the ap-
plication.
IDAC Clocking is the module responsible for
performing the processing of the type Clocking Mark-
ing and Forced Marking. At this stage, a new type
of data is created Worked Day, which will store all
markings, forced or not, in a list based on the data and
the employee to which they belongs. After processing
all the marks received during the day, all data of the
type Worked Day is computed by identifying peers,
adding the time worked and storing this information.
In case of extra events such as: Notifications, Over-
time or Negative Time, data of same type is created
and stored in the database.
IDAC IdlenessAnalyser is the module responsi-
ble for performing the processing of the data type
Passing by Marking. At this stage, the passage of
the Employees through the company’s environments
are identified. Each pair of markers identifies the exit
from a place and the arrival into another and a new
data type called Pass is created. It stores the place
that the employee has been to, time spent in this place
and who is the employee.
IDAC IdlenessDetection is the module responsi-
ble for identifying the idleness of employees. It is
executed at the end of the day, after all appointments
have been processed and turned into passage records.
Based on the data type Pass, the workday of each em-
ployee is processed. This module identifies where the
employee has been too and his shift, as well as time
spent in each environment. Thus, if it is detected that
an employee has exceeded the stay time limit set by
the Manager, not complied with the minimum of daily
activity or was part of a grouping, the system identify
a idleness behavior. Furthermore, it is stored in the
database as a new type called Idleness.
IDAC WebPages is the view layer of all the in-
formation processed by the other application’s mod-
ules. This is the module that allow the Forced Mark-
ings to be included, overtime to be justified and mark-
ings/Idleness to be viewed. It is the second input of
data for the application, but unlike the capture mod-
ule, where information is received automatically, this
data is entered by users.
Information flow in the system starts from the
IDAC CaptureRFID module that receives the records
captured by RFID readers. Thus, the informa-
tion travels to IDAC Formatter module that pro-
duces two new treatment flows: in one of them,
the data is sent to the IDAC Clocking module that
performs the decision-making and delivers it to
IDAC WebPages, the other data stream is sent to
the IDAC IdlenessAnalyser module. After, the in-
formation travels to IDAC IdlenessDetection module,
which performs a new set of decision-making in or-
der to send processed data to be displayed in the
IDAC WebPages.
Currently, the IDAC system is available with two
types of actors, the Manager and the Employee. Each
one has responsibilities and interests that are relevant
to the model proposed here, besides specific access
rules. Manager is the user responsible for the ad-
ministration, he has the obligation to register a tag
for each of his employees and guide them to carry it
throughout the working hours. This actor must have
access to the markings of all employees, be able to
justify all situations that escape the normal workday,
make markings manually and validate justifications
and markings recorded by employees. Employee is
the main user of the system, he must have his mark-
ings automatically registered and have investigated
his idleness. Thus, he has the obligation to carry with
him a tag (RFID wristband) for identification.
In addition to actors, the system have three main
features, the first one is responsible for idleness
detection, the second for the clocking markings and
the last is a management tool. These features are
described in details below:
IDAC: A Sensor-based Model for Presence Control and Idleness Detection in Brazilian Companies
481

3.1 Idleness Detection
To perform idleness detection the system must have
the following features: (I) Inclusion of Places; (II)
Sensors Inclusion; (III) Passage Registration; (IV) In-
sertion of Event Logs; (V) Idleness Detection Core;
(VI) Detection of Groupings. In functionality (I),
based on the company’s building, each of its environ-
ments (rooms or departments) can be included as a
place and a type must be chosen for this place, which
can be a kitchen, restroom, meeting room, worksta-
tion, corridor, recreation room, warehouse or spare
room. Functionality (II) allows RFID readers to be
linked to the companies environments, reading the
employee’s location and gathering information that
can be used by the passage registration system. The
functionality (III) is responsible for whenever an em-
ployee passes by a sensor, the system checks which
place the sensor belongs to and stores both the time
and position in the database.
The functionality (IV) allows to add a log if there
are situations where the employee must be out of
his/her workstation (for a meeting, for example), so
not characterizing an idleness situation. The function-
ality (V) assumes that whenever the system identify
an employee out of his workstation for longer than
the time limit, must register a possible idleness in the
system. Finally, the functionality (VI) assumes that
whenever the system detects a stationary employee
out of his workstation for longer than the time limit,
you should check whether there are other employees
in the same place. When detected the existence of
two or more employees in the same place for longer
than the time limit set, the system starts to record the
possible grouping in the database, giving information
about the place, duration and employees.
The idleness detection algorithm starts at the end
of each working day. After the processing of all
employees by the IDAC IdlenessAnalyser module, it
does a search in the database to see if there is any
record of a Pass that has not been processed, these
records consists of: place, employee, incoming, out-
going, elapsed time and a flag that defines if it has
been processed or not. If all the markings have al-
ready been processed, the system stays in standby
state and repeats the procedure after a certain period
of time, but, if there is an unprocessed Pass marking,
the system gets the employee information and gathers
all his markings for that working day, sorting by the
incoming time. With all the employee’s Pass mark-
ings, the system starts a time counter that stores how
long the employee was out of his working station, so
this counter is incremented based on the difference
between the incoming and outgoing timestamps. The
algorithm goes into a loop that runs through the list
calculating the idleness period for all the Pass mark-
ings in which the employee was out of his working
station. The minimum time interval for which the
pass is considered idleness is defined by the Manager.
The process of verification of groupings consists
in the search for the passages of an employee for a cer-
tain environment that has last longer than defined by
the Manager. If the employee has a passage over the
time set as the minimum to check for groupings, the
system searches for registered groupings at that time
and place. If there is a grouping record, the employee
is registered as a participant of that group, otherwise it
searches in the database for other employees who re-
ported idleness in the same place and time, if positive
a new grouping record is created and both employees
are recorded.
3.2 Clocking Markings
For the system to perform clocking, it must have
the following features: Insertion of Marking Sen-
sors (I); Clocking record (II); Lunch Time Validation
(III); Time validation (IV); Extra and Negative Time
Record (V); Record Checking (VI); The functionality
(I) allows, based on loaded Places, RFID readers to
be linked to one of the possible entrances of the com-
pany, in order to record the entry and exit of employ-
ees. The functionality (II) assumes that whenever an
employee go through a marking sensor (a tag is read
by a reader), the system must store the time informa-
tion in the database as a Clocking Marking.
The functionality (III) assumes that at the end of
the workday the system should analyze how the em-
ployee spent his time in order to find longer than an
hour and less than two hours intervals and treat them
as lunch breaks. Functionality (IV) states that at the
end of the day the system should add the time spent
at the company for an employee in order to get actu-
ally worked time. Functionality (V), the system after
the marking and sum of total work time, check the in-
cidence of extra or negative hours of the employee,
recording it separately to enable the manager to treat
it correctly. The functionality (VI) assumes that the
application should be able to show the markings of
employees for themselves and, if there is any incor-
rect information, they can force a manual clocking
marking (Forced Marking) describing a justification
for it.
3.3 Management Tool
For the employees, the management tool should be
able to display the registered Clocking Markings, al-
lowing the inclusion of markings under justification,
RAIBS 2016 - Special Session on Recent Advancement in IoT, Big Data and Security
482
which should wait as “pending” validation. The em-
ployee must be able to view the extra and negative
hours too, allowing the inclusion of justifications,
which shall also wait for validation. As for the man-
agers, the management tool should be able to display
the clocking markings recorded for all the employees,
defining the pairs, besides allowing the inclusion and
exclusion of markings and the validation of the inclu-
sion justifications referred by their employees.
In order to evaluate the model, we implemented
the IDAC WebPages application, covering all the fea-
tures on the Management Tools for both Managers
and Employees, and the modules described on Fig-
ure 1. However, all features related to insertion and
maintenance of Places and Sensors, based on a vi-
sual representation of the business building plan were
not implemented. These features are not considered
important for data collection, nor for further analysis
through simulation.
4 EVALUATION
METHODOLOGY
To evaluate the IDAC system, it was decided that it
would be interesting to use two different approaches.
Thus the assessment methodology will be through
a quantitative analysis of the system, with two test
trends. The first will be the functionality tests, where
the system would run tests for a given scenario and
collect the application’s results for a theoretical group
of employees. Hence, being able to display the infor-
mation that will be available to the managers if the
system was running on a real company. The applica-
tion timeouts have been defined by the management
of the shirts making company. The second approach
would be through a stress test in order to verify the
limits on the load of the application that process in-
formation. In addition, the tests should check the cor-
relation between the run-time interface and the data
to be handled. Finally, identify the maximum number
of markings that the system is capable of processing
without generating a processing queue.
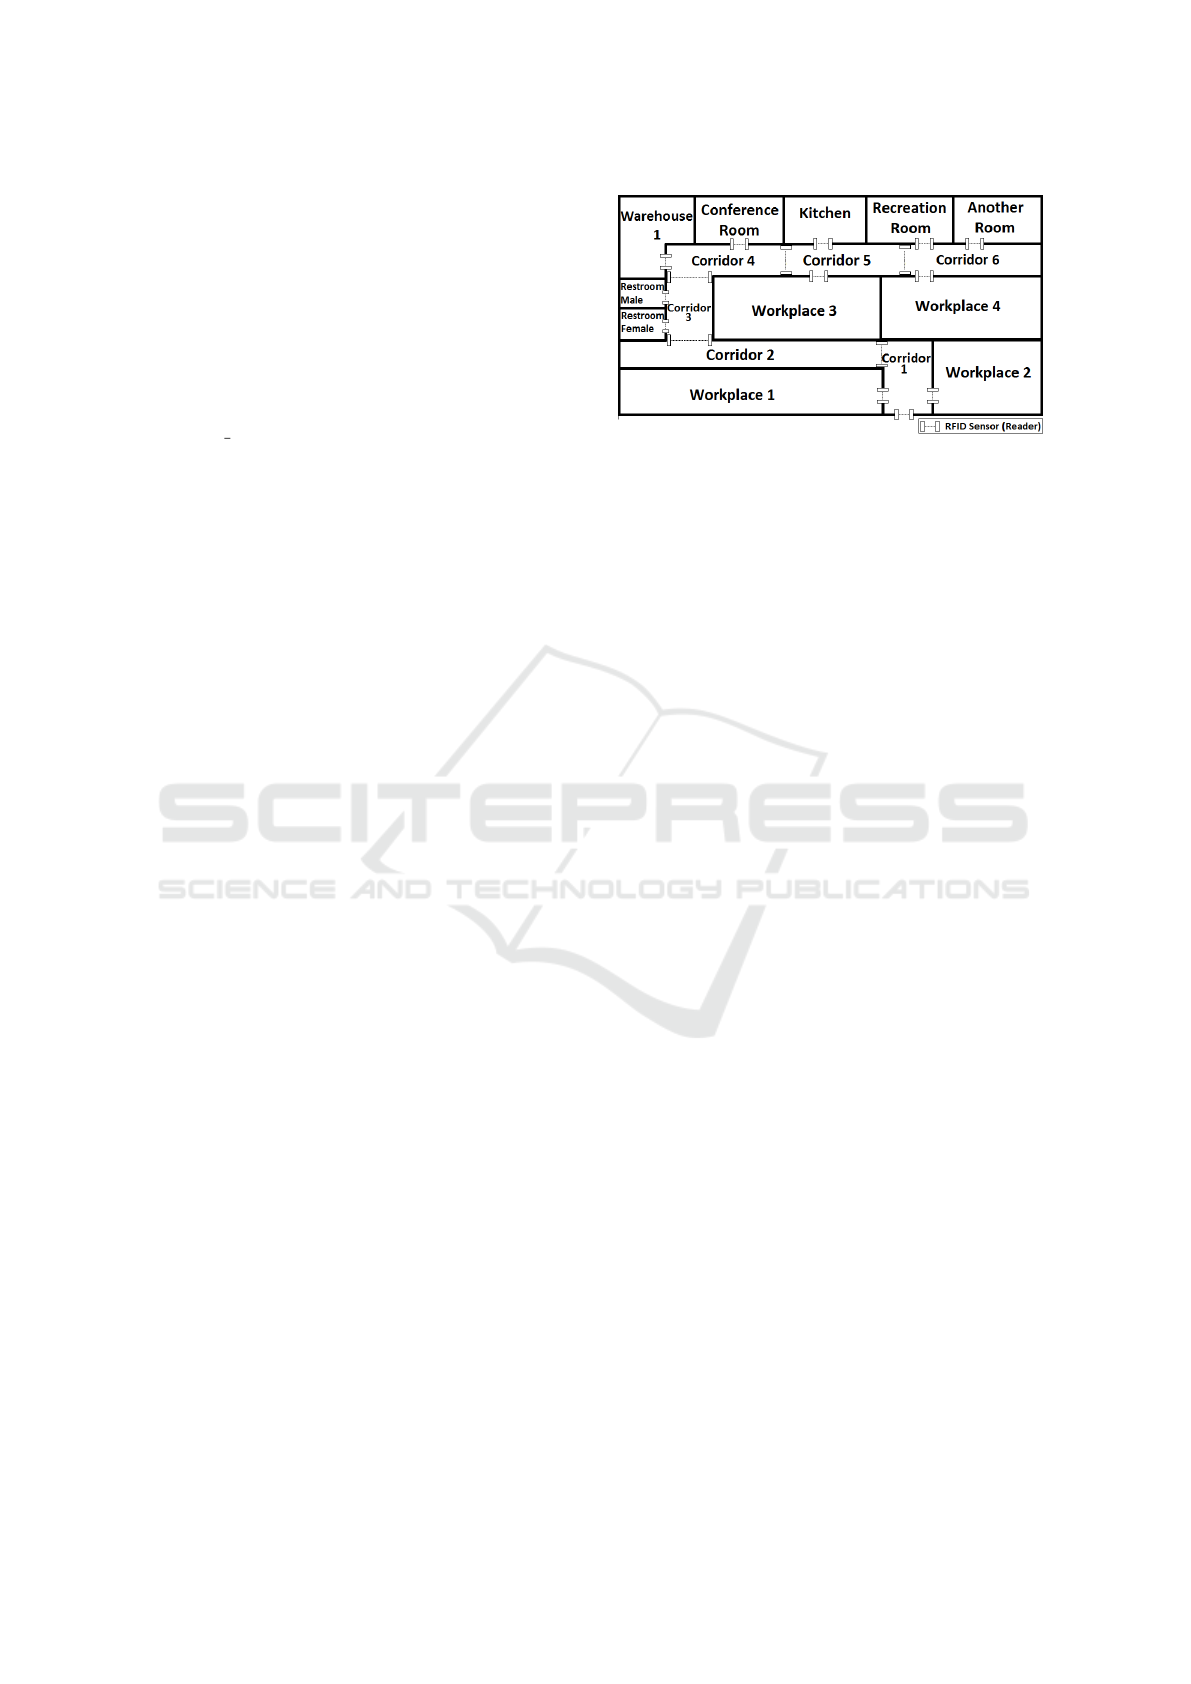
In order to enable the proposed approaches, a test
was previously developed and loaded on a theoreti-
cal business environment system (Figure 2). In this
company there are 17 distinct environments, each of
which is characterized as one of the possible places
where the system is prepared to apply specific rules in
order to detect idleness. The group of employees was
randomly generated and distributed among the avail-
able workplaces.
To test the application, a simulator was developed,
capable of reproducing the result that would come
Figure 2: Theoretical plant used in the tests.
from a functional capture module. This simulator
main function is constructing a path to be followed
by a theoretical employee in a working day of the
simulated company. After being decided whether the
employee will meet the minimum production time or
not, it is set the total period that he will remain idle
during that working day. Later, it determines how
long the employee will go for lunch that day, which
may be within the limit set by the law, or not.
Then the simulator enters a loop that defines the
employee’s activity. If the employee spend more than
half the time set at the beginning of simulation in
either working or idle state, the simulator force him
to fulfill the opposite scenario. Once the developer’s
time counter cross the half of the theoretical day, the
system sends that employee to lunch for as long as it
was previously defined. Upon returning from lunch,
again a random numbers generator defines a new
path to be followed. When the working time counter
reaches the day limit, the theoretical employee leaves
the company.
All the places to which the employee must go
are stored in a queue and processed immediately,
so they go through the shortest path from one place
to another, using the Dijkstra algorithm. After the
final path is finished, as well as all the intermediate
places, it is enqueued in a new queue and waits to
become markings. After all employees’ working
days are defined, through simulations, the simulator
starts to load the database. It started simulation clock
and as it is incremented, the situations stored in the
queues of each employee are effectively included in
the database. Thus, the simulation is closer to reality,
since first it processes everything that happens, at any
given time, for all the employees, not the whole day
of each employee sequentially. The simulation clock
increases ten seconds per iteration.
Survey data for analysis was gathered through
simulations performed for lots of employees, based
on staves of real companies. The numbers were
raised based on the Ranking “Great Places to Work”,
IDAC: A Sensor-based Model for Presence Control and Idleness Detection in Brazilian Companies
483
which is managed by the institute
1
. Thus, five plants
have been used as examples: Molas Weber manu-
facture of springs, which typically employs 80 em-
ployees; Perkins Engines manufacture of diesel en-
gines, which has 143 employees; Zanzini furniture
manufacturing of furniture, which has a staff of 356
employees; Jost Brazil auto parts, a manufacturing
industry for trucks, trailers and semi-trailers, which
employs 400 employees; And finally, the Portas Por-
made, doors manufacture, which has 482 employees.
5 RESULTS
For each batch of employees, based on the aforemen-
tioned companies, the simulation and the IDAC sys-
tem were executed in order to view the results gener-
ated by the application. For each simulation, a results
page was generated by the Web Pages application,
bringing information such as number of employees
at the test environment; amount of idleness records;
percentage of employees who had some idle record;
amount and percentage of employees who failed to
meet the minimum daily activity; amount of detected
groupings and the main environment in which those
occurred; peak time for idleness and grouping; num-
ber of employees who have not fulfilled the lunch
time; total overtime generated; and number of em-
ployees that generate this overtime.
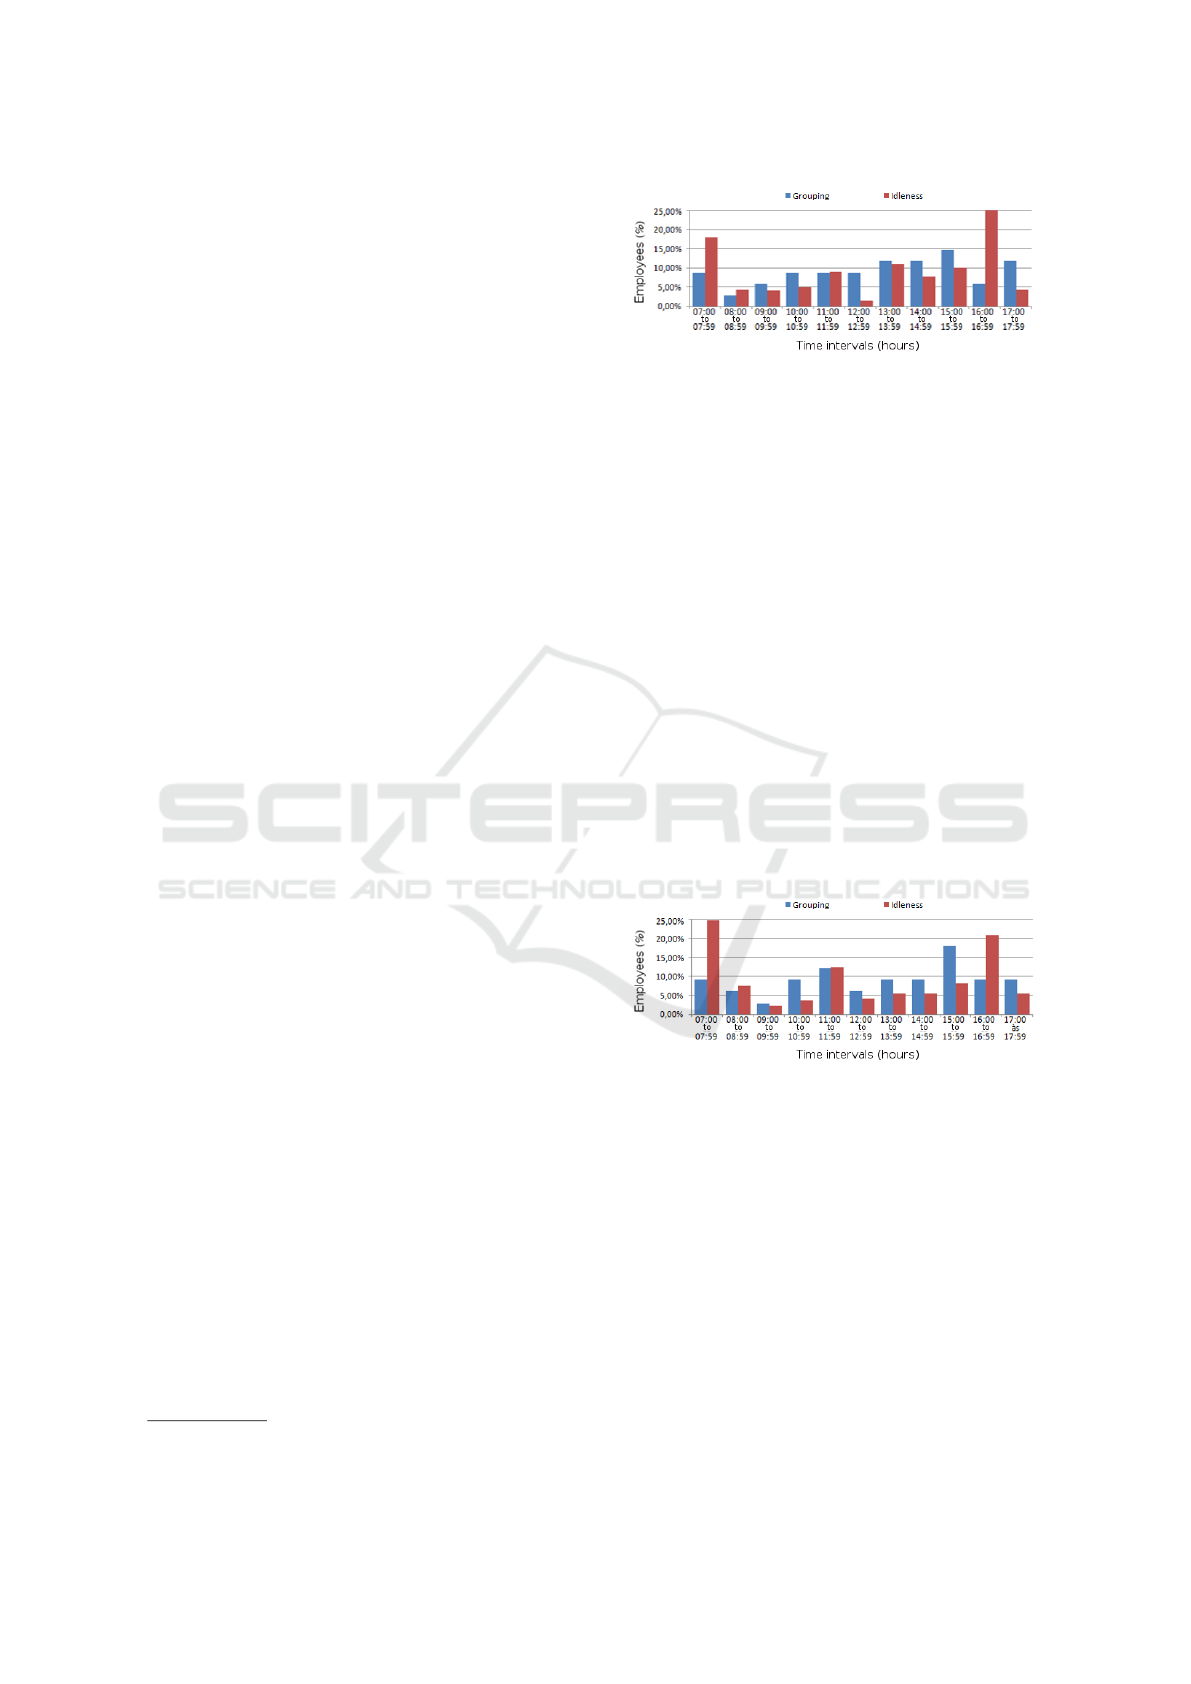
5.1 Experiment 1: 80 Employees
Simulation based on Molas Weber
In a group of 80 employees distributed by the com-
pany’s environment, a total of 350 idleness records
have been identified. Of total employees, 75 (93.75%)
had some idle record against five employees (6.25%)
who did not have any. 58 employees (72.5%) failed to
meet the minimum daily activity. The employee with
the highest idleness worked only 405 minutes during
the day (84.375% of his working hours). 33 group-
ings were identified, most of them occurred in the
“Restroom Male” environment. The peak of group-
ings registered at the same time (6) occurred between
15:00 and 15:59. The peak of idleness recorded at
the same time (72) occurred between 07:00 and 07:59
(Figure 3). 65 employees did not meet the lunch time
given by law. 2 employees generated overtime. The
total overtime paid on the day was 0:28 hours.
1
http://www.greatplacetowork.com.br
Figure 3: Groupings and idleness through time of experi-
ment 1.
5.2 Experiment 2: 143 Employees,
based on Perkins Engines
In a group of 143 employees distributed by the com-
pany’s environment, a total of 652 idleness records
were identified. Of total employees, 132 (92.3%) had
some idleness record, against 11 employees (7.69%)
who did not have any. 111 employees (77.62%) failed
to meet the minimum of daily activity. The employee
with the highest idleness worked only 405 minutes
during the day (84.375% of his working hours). 34
groupings that have taken place mostly in the “Recre-
ation Room” environment were identified. The peak
of groupings registered at the same time (5) occurred
between 15:00 and 15:59. The peak of idleness
recorded at the same time (136) occurred between
16:00 and 16:59 (Figure 4). 42 employees failed to
meet the lunch time given by law. 3 employees gener-
ated overtime. The total overtime paid on the day was
0:35 hours.
Figure 4: Groupings and idleness through time of experi-
ment 2.
5.3 Experiment 3: 356 Employees,
based on Zanzini Furniture
In a group of 356 employees distributed by the
company’s environment, a total of 1607 idleness
records could be identified. Of total employees, 320
(89.88%) had some idleness record, with 36 employ-
ees (10.11%) working all day without idleness . 270
employees (75.84%) failed to meet the minimum of
daily activity. The employee with the highest idleness
worked only 405 minutes during the day (84.375%
of his working hours). 39 groupings have been identi-
fied, which occurred mostly in the “Kitchen” environ-
RAIBS 2016 - Special Session on Recent Advancement in IoT, Big Data and Security
484
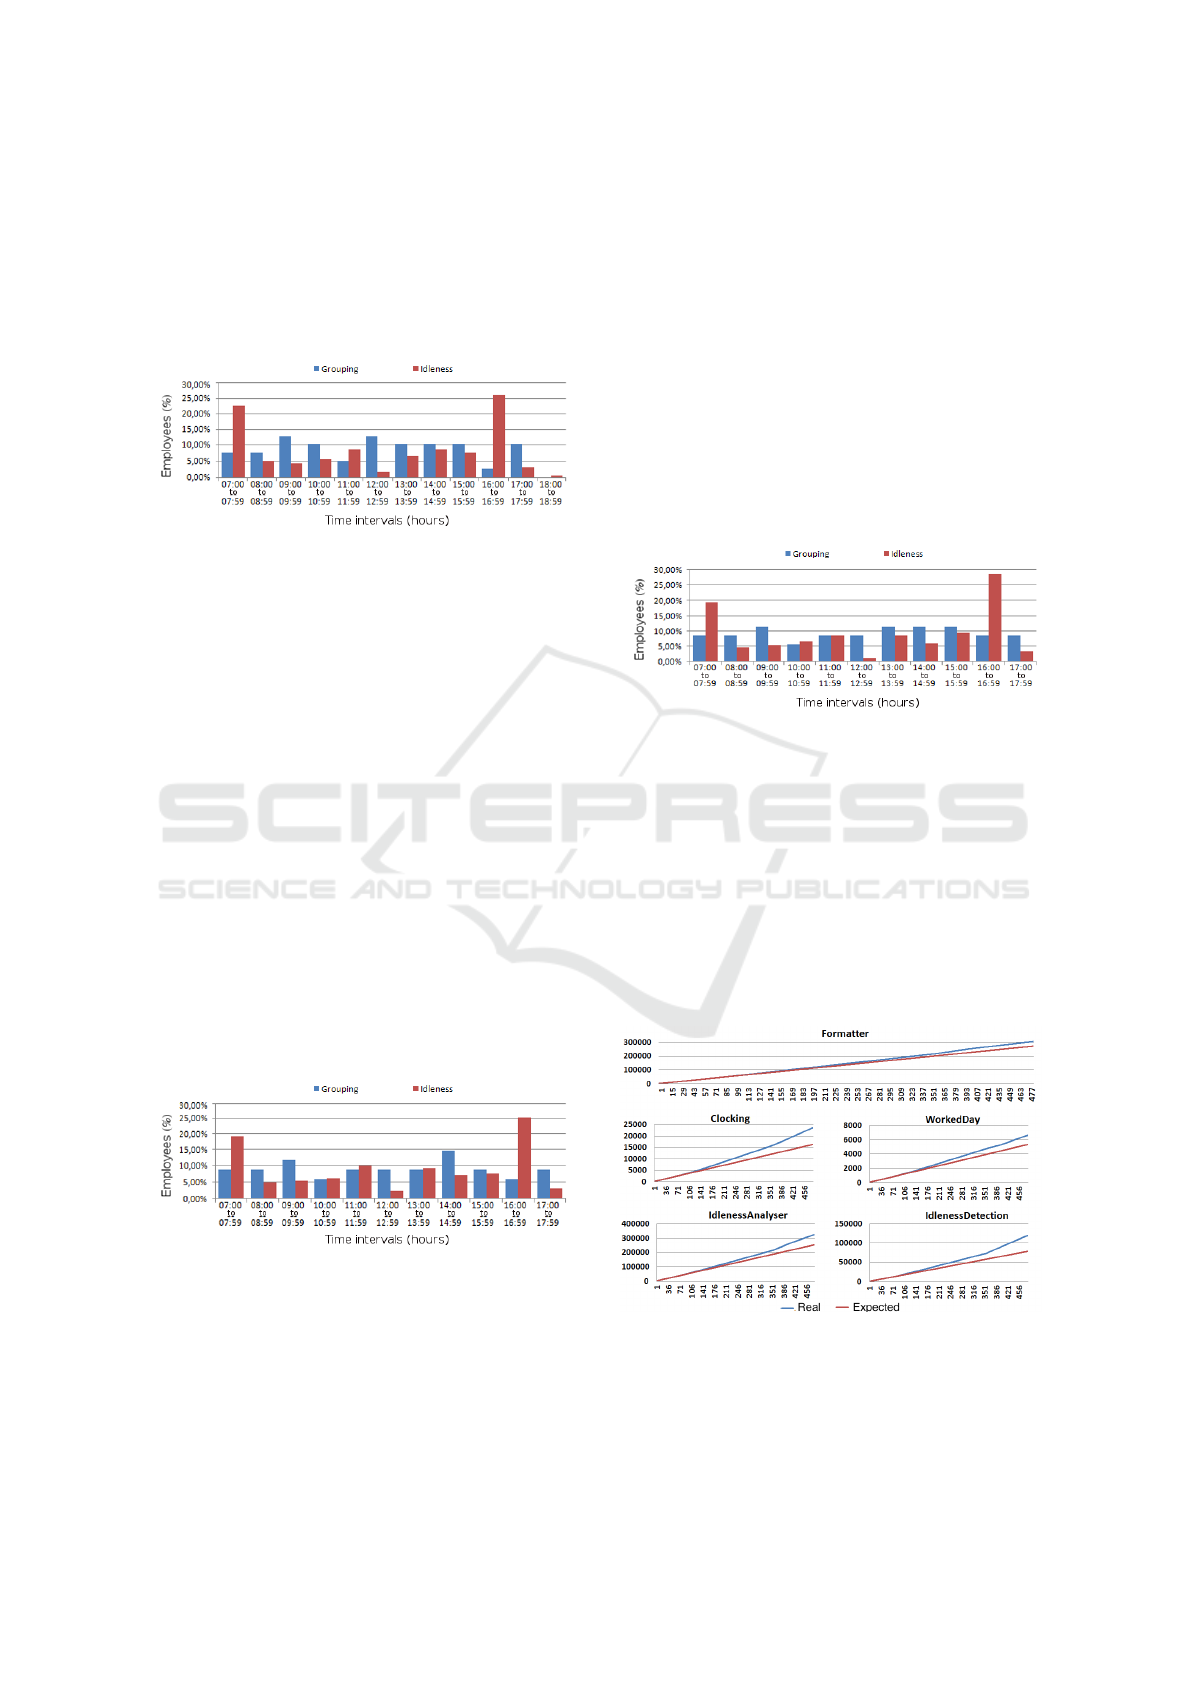
ment. The peak of groupings registered at the same
time (5) occurred between 09:00 and 09:59. The peak
of idleness recorded at the same time (348) occurred
between 16:00 and 16:59 (Figure 5). 115 employees
did not meet lunch time given by law. 5 employees
generated overtime. The total overtime paid for this
day was 1:06 hours.
Figure 5: Groups and idleness a function of time of experi-
ment 3.
5.4 Experiment 4: 400 Employees,
based in Jost Brazil
In a group of 400 employees distributed throughout
the company’s environment, a total of 1843 idleness
records could be identified. Of total employees, 377
(94.25%) had some idleness record, compared to 23
employees (5.75%) who worked all day without any
idleness record. 323 employees (80.75%) failed to
meet the minimum of daily activity. The employee
with the highest idleness worked only 405 minutes
during the day (84.375% of his working hours). 34
groupings have taken place mostly in the “Kitchen”
environment. The peak groupings registered at the
same time (5) occurred between 14:00 and 14:59. The
peak idleness recorded at the same time (383) oc-
curred between 16:00 and 16:59 (Figure 6). 130 em-
ployees did not respect the time for lunching given
by law. 10 employees generated overtime. The total
overtime paid for the day was 2:29 hours.
Figure 6: Groups and idleness a function of time of experi-
ment 4.
5.5 Experiment 5: 482 Employees based
on Portas Pormade
In a group of 482 employees distributed through-
out the company’s environment, a total of 2178 idle-
ness records were identified. Of total employees, 444
(92.11%) had some idleness record, compared to 38
employees (7.88%) who worked all day without any.
368 employees (76.34%) failed to meet the minimum
of daily activity. The employee with the highest idle-
ness worked only 405 minutes in the day (84.375%
of his working hours). They identified 36 groupings
that occurred mostly in the “Recreation Room” envi-
ronment. The peak groupings registered at the same
time (4) occurred between 09:00 and 09:59. The peak
idleness recorded at the same time (513) occurred be-
tween 16:00 and 16:59 (Figure 7). 138 employees did
not meet the lunch time defined by law. 11 employees
generated overtime. The total overtime paid for the
day was 2:43 hours.
Figure 7: Groups and idleness a function of time of experi-
ment 5.
5.6 Performance
In order to analyze the application’s performance, ex-
ecution times were captured, in milliseconds, for the
test scenarios of Experiments 1 to 5. In Figure 8
there are graphs relating the expected execution time,
calculated from the time raised as the lower case of
each module, with the execution time calculated by
the simulation.
Figure 8: Execution time for the modules responsible for
taking decisions on the IDAC system (Employees X Time).
The real time refers to the time that has actually been cap-
tured by the simulation, while the expected time is only a
representation of how the time would be if it were in linear
relation to the numbers of employees.
IDAC: A Sensor-based Model for Presence Control and Idleness Detection in Brazilian Companies
485

Finally, we performed successive load tests in or-
der to verify the maximum number of records that the
application is able to process on an interval of a sec-
ond. Furthermore, we identify how many employees
could go thorough a set of readers, at the same time,
without generating processing queues for database in-
clusions. After testing, we concluded that, on aver-
age, the system is able to process 230 markings in a
one second interval. Starting from the premise that
between one reader and another there is a physical
space that each employee takes about ten seconds to
cross, the system is able to process the passages of up
to 1150 employees in the same time interval.
5.7 Discussion
Based on the data collected through tests and simula-
tion, we note that there is evidence of system usability
and its ability to perform the clocking, as well as raise
all idleness and groupings for the theoretical groups
of employees. However, it is important to note that
this results can not be generalized. So we can say that
a absolute validation of the system would require its
implementation in a company’s environment.
Regarding performance, in the experiment with
the larger number of employees, the application took
13 minutes and 55 seconds to process all the informa-
tion generated by the simulator. The graphics bring
the execution time, depending on the number of em-
ployees, slightly above the linear, suggesting that the
system has an excellent performance, being able to
process even larger batches of employees.
6 CONCLUSION
This work presented the IDAC model, which is able
to evaluate the markings and the identification of
possible idleness (alone or in groupings) of employ-
ees in companies. Based on a set of rules that can
be changed dynamically, the system is able to iden-
tify situations that flee from the managers interests.
Been dynamic enables it to adapt to the reality of a
wider range of companies. As results, it is empha-
sized that the system was able to identify the idleness
and groupings of theoretical employees for every per-
formed experiment.
As a future work, developing the
IDAC
CaptureRFID module is the main objective,
in order to have all the proposed model effectively
constructed. Also, the Framework decentralization.
Therefore, the implementation of a distributed
database would be required, so that the modules
do not make requests to a single database. Thus,
the current limit for the system is database speed,
which may increase by several times the application
processing capability. Finally, it is expected to
implement the system in a real business environment
in order to have real data for a better validation of the
proposed application.
ACKNOWLEDGEMENTS
The authors would like to thank to the following
Brazilian Agencies: CNPq, CAPES and FAPERGS.
REFERENCES
Ahgora (2015). Ahgora PontoWEB. http://www.ahgora.c
om.br/sistema-pontoweb-online. Access in June,2015
Akkaya, K., Guvenc, I., Aygun, R., Pala, N., and Kadri, A.
(2015). Iot-based occupancy monitoring techniques
for energy-efficient smart buildings. In Wireless Com-
munications and Networking Conference Workshops
(WCNCW), 2015 IEEE, pages 58–63.
Atzori, L., Iera, A., and Morabito, G. (2010). The internet
of things: A survey. Computer Networks, 54(15):2787
– 2805.
CH&TCR (2015). CH&TCR - Soluc¸
˜
oes em Identificac¸
˜
ao.
http://www.controledeacessoeponto.com.br, Access
in July 2015.
Narzt, W., Mayerhofer, S., Weichselbaum, O., Haselbock,
S., and Hofler, N. (2015). Be-in/be-out with bluetooth
low energy: Implicit ticketing for public transporta-
tion systems. In Intelligent Transportation Systems
(ITSC), 2015 IEEE 18th International Conference on,
pages 1551–1556.
Neiva, J. P. B. (2012). Localizac¸
˜
ao e Orientac¸
˜
ao Indoor com
recurso
`
a Tecnologia RFID. Master thesis at integrado
em engenharia electrotecnica e de computadores, Fac-
uldade de Engenharia da Universidade de Porto, Por-
tugal.
Pedraza, G., Garc
´
ıa, I., and Debbabi, B. (2010). An rfid
architecture based on an event-oriented component
model. In Proceedings of the Fourth ACM Interna-
tional Conference on Distributed Event-Based Sys-
tems, DEBS ’10, pages 87–88, New York,USA ACM.
Pereira, C. L. A. (2012). Dispositivos de identificac¸
˜
ao. Mas-
ter thesis at sistemas e tecnologias de informac¸
˜
ao para
as organizac¸
˜
oes, Instituto Politecnico de Viseu, Escola
Superior de Tecnologia e Gest
˜
ao de Viseu, Portugal.
Ryu, W., Kwon, J., and Hong, B. (2013). Generation of
rfid test datasets using rsn tool. Personal Ubiquitous
Comput., 17(7):1409–1419.
RAIBS 2016 - Special Session on Recent Advancement in IoT, Big Data and Security
486
