An Input Support System for
Customized Scouting Charts of Baseball Games
Kazunari Uchiki, Yasuhiko Watanabe, Haruka Morimoto and Kenji Yasuda
Ryukoku University, Dep. of Media Informatics, Seta, Otsu, Shiga, Japan
Keywords:
Input Support System, Baseball, Pitch Combination, Customized Scouting Chart.
Abstract:
In physical education, it is important for students to learn how to observe, record, and analyze their activities.
Ryukoku University Baseball Team developed a customized scouting chart and records the type and course of
every individual pitch thrown by all the pitchers in the team and their rivals. However, it is not easy to record
the pitching data by using pens and paper. To solve this problem, we developed an input support system
for customized scouting charts of baseball games in Unity and C#. In preliminary experiments, our system
enables users to create pitch combination records easily and improves the readability of them.
1 INTRODUCTION
In physical education, it is important for students to
learn not only how to do physical exercises but how
to
• observe,
• record, and
• analyze their activities.
Many sports players and coaching staff observed and
recorded their games and analyzed their activities.
Take baseball for example. Baseball players and
coaching staff record baseball games by using base-
ball scorebooks. Figure 1 shows an example of base-
ball scorebook records. From the record in Figure 1,
we can read the leadoff hitter’s activities in the first
inning: Uchiki, the leadoff hitter, hit a single to left-
center field with the count one ball and two strikes.
Then, he stole second base and moved to third on a
sacrifice bunt by the next batter, Suzuki. Finally, he
reached home on Matsui’s single to center.
This record helps the baseball players and coach-
ing staff to look back on their activities in the game,
refine their training plans, and set up new tactics to
win games. Furthermore, some other information is
recorded in baseball scorebooks: date, place, weather,
wind speed and direction, umpires’ names, and so on.
However, information recorded in scorebooks is usu-
ally limited and not enough to set up new tactics to
win games. For example, we cannot read the course
and type of the pitch that Uchiki hit to left-center in
the first inning. In order to set up new tactics to win
Figure 1: An example of baseball scorebook records.
games, it is important to collect the following kinds
of information.
• What kinds of pitches can opposing team’s pitch-
ers throw.
• What courses and types of pitches opposing
team’s batters are good at hitting.
To solve this problem, the Major League Baseball
(MLB) records the type and course of every pitch
thrown by any pitchers in the MLB and provides
the data in the MLB website (http://www.mlb.com).
Detailed records are important to analyze players
and teams statistically and set up new tactics to win
games. For example, Uehara and Arai proposed a
model of tactical decisions for pitching based on the
MLB pitching data (Uehara and Arai, 2013). As a re-
sult, our university baseball team (Ryukoku Univer-
Uchiki, K., Watanabe, Y., Morimoto, H. and Yasuda, K.
An Input Support System for Customized Scouting Charts of Baseball Games.
In Proceedings of the 8th International Conference on Computer Supported Education (CSEDU 2016) - Volume 1, pages 513-518
ISBN: 978-989-758-179-3
Copyright
c
2016 by SCITEPRESS – Science and Technology Publications, Lda. All rights reserved
513

sity Baseball Team) records pitching data similar to
the MLB pitching data. However, it is not easy to
record the type and course of every pitch thrown by
all the pitchers in our team and rivals because the data
is recorded by using pens and paper. In order to re-
duce the burden of data recording, we developed an
input support system for customized scouting charts
of baseball games. We developed our system in Unity
and C# because Unity provides an integrated devel-
opment environment that enables computer program-
ming beginners to develop user friendly interfaces as
they want.
2 RELATED WORKS
In order to reduce the burden of recording data on
baseball scorebook, Terasawa et al. attempted to de-
velop input support system for baseball scorebook,
but not yet (Terasawa et al., 2013). On the other
hand, Komatsu and Kuwabara developed an input
support system for baseball scorebook using iPad
(Komatsu and Kuwabara, 2013). When we have score
data in baseball scorebooks, we can analyze play-
ers and teams statistically from various viewpoints.
Maruyama et al. developed a system that calcu-
late pitchers’ annual salaries of next year by using
Nippon (Japan) Professional Baseball Organization
(NPB) score data (Maruyama et al., 2010). Turocy
and Kira and Inakawa reported that the values of the
game (the equilibrium winning percentages for both
teams) could be solved with high accuracy by using
MLB score data and NPB score data, respectively
(Turocy, 2008) (Kira and Inakawa, 2014). When
we have more detailed data than baseball scorebook
records, we can analyzed players and teams more
widely and closely. In order to collect more de-
tailed data, the MLB installed PITCHf/x systems in
every MLB stadium and records the type and course
of every individual pitch thrown by any pitchers in
the MLB. Hamilton et al. and Hoang et al. applied
classification methods to PITCHf/x data and extend
the classification tasks to pitch prediction (Hamilton
et al., 2014) (Hoang et al., 2015). In order to set up
new tactics to win games, Ryukoku University Base-
ball Team has recorded pitching data similar to the
MLB pitching data. However, it is not easy to record
the type and course of every individual pitch thrown
by all the pitchers in our team and rivals because the
data is recorded by using pens and paper. In order to
record pitching data quickly and precisely, our univer-
sity baseball team developed a customized baseball
game scouting chart, pitch combination chart.
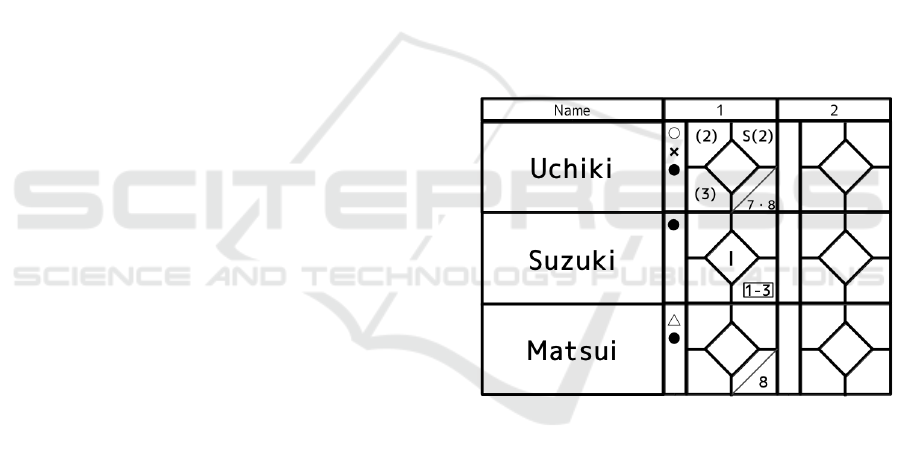
Figure 2: The structure of a pitch combination chart.
3 PITCH COMBINATION
CHARTS OF RYUKOKU
UNIVERSITY BASEBALL
TEAM
In order to record pitching data quickly and precisely,
Ryukoku University baseball team developed pitch
combination charts. Figure 2 shows the structure of
a pitch combination chart. A pitch combination chart
consists of
1. batter’s name column,
2. batting hand marker,
3. batting result column, and
4. the strike zone and the ball zone viewed from a
pitcher.
The strike zone is divided into 3 × 3 boxes.
Figure 3 shows an example of a pitch combination
record described on a pitch combination chart. The
record shows the pitch combination to Uchiki in the
first inning. The record is more informative than the
record in the scorebook shown in Figure 1. A pitch
combination record is described in the next way.
1. A recorder fills in the batter’s name column and
paints over one of the batting hand markers, right
or left, with black. Figure 3 shows Uchiki is a left
handed batter because the left batting hand marker
is painted over with black.
CSEDU 2016 - 8th International Conference on Computer Supported Education
514
Figure 3: An example of a pitch combination record de-
scribed on the pitch combination chart.
called strike / ball
swinging strike
foul
Figure 4: Symbols for indicating umpire’s decisions.
2. The recorder describes the ordinal number, loca-
tion, type, moving direction (in case of a break-
ing ball), and umpire’s decision of each individ-
ual pitch by using circles in the strike and ball
zones. In Figure 3, numbers in circles are the or-
dinal numbers of pitches. The circle painted over
with black means the last pitch. The locations of
the circles indicate the locations where the catcher
received the pitches. Circles that connected to
lines indicate breaking balls. The directions of
lines connected to circles are the moving direc-
tions of breaking balls. Superscripts to the right
of circles indicate umpire’s decisions: swinging
strike, called strike, ball, and foul. Figure 4 shows
symbols for indicating umpire’s decisions. Figure
3 shows the first pitch to Uchiki was a straight,
middle and inside, and a called strike. The second
pitch was a breaking ball moving toward inside
and downward, low and outside, and a swinging
strike. The third pitch was a breaking ball moving
downward, low and inside, and a ball. The fourth
pitch, the last pitch to Uchiki, was a straight, and
high and outside.
3. The recorder fills in the batting result column.
Figure 5: The overview of our system.
Figure 3 shows Uchiki’s batting result is a single
to left-center field.
It is not easy to record pitch combination data
by using pens and paper. This is because baseball
games often go rapidly and recorders have short time
to record information about every individual pitch. As
a result,
• information about pitches, and
• readability
are limited. For example,
• the detailed types of breaking balls are not
recorded, and
• umpire’s decisions are indicated only by symbols
that are often misinterpreted.
As a result, it is important to support recorders in
creating informative and readable pitch combination
charts easily and quickly.
4 INPUT SUPPORT SYSTEM FOR
PITCH COMBINATION
CHARTS
In order to support users in recording pitch combina-
tion data easily and quickly, we developed an input
support system for pitch combination charts in Unity
and C#. Unity providesan integrateddevelopment en-
vironmentthat enables computer programmingbegin-
ners to develop user friendly interfaces as they want.
In our system, it is important whether the interface is
designed as users want. This is because users have to
record pitch combination data quickly and precisely
in games. Our system works on Thinkpad T420 under
Windows 7. Figure 5 shows the overview of our sys-
tem. Our system not only reduces the burden of data
An Input Support System for Customized Scouting Charts of Baseball Games
515

Figure 6: The user interface of our system.
recording but enriches information on pitch combina-
tion charts and improves the readability of them. For
example, our system enables users to record
• pitcher’s name and
• the detailed types of breaking balls (curveball,
slider, forkball, and so on)
on the pitch combination charts. Also, our system en-
ables users to read information about umpire’s deci-
sions expressed in words, not in symbols.
Figure 6 shows the user interface of our system.
As shown in Figure 6, the user interface consists of
the following components:
1. a text input field for entering batter’s name,
pitcher’s name, and a batting result (
1
in Figure
6).
2. a button for submitting batter’s name (
2
).
3. a button for submitting pitcher’s name (
3
).
4. a button for submitting a batting result (
4
).
5. a text output field for displaying batter’s name
(
5
).
6. a text output field for displaying pitcher’s name
(
6
).
7. two markers for displaying batter’s batting hand,
left or right (
7
L and
7
R).
8. the strike zone (divided into 3 × 3 boxes) and ball
zone (
8
).
9. buttons for submitting the type of a pitch (
9
).
Figure 7: Information about batter’s name, pitcher’s name,
and batter’s batting hand is input to our system.
10. four buttons for submitting umpire’s decision
(
10
).
11. an output field for displaying the types of pitches
and umpire’s decisions (
11
).
12. a text output field for displaying a batting result
(
12
).
13. a button for creating next batter’s pitch combina-
tion chart (
13
).
Next, we tell how to use our system.
First, a user inputs batter’s name, pitcher’s name,
and batter’s batting hand to the system in the next
way: the user enters batter’s name to the text input
field (
1
in Figure 6) and push the button for submit-
ting batter’s name (
2
). Then, the user enters pitcher’s
name to the text input field (
1
) and push the button
for submitting pitcher’s name (
3
). Finally, the user
CSEDU 2016 - 8th International Conference on Computer Supported Education
516

(a) the system shows the location of the first pitch where
the user clicked (
8
).
(b) the system shows the type of the pitch and umpire’s
decision in the output field (
11
).
(c) the system shows the batting result of Uchiki in the text
output field (
12
).
Figure 8: Information about the locations, types, umpire’s
decisions of the pitches is input to our system.
selects one of the batting hand marker (
7
L or
7
R)
for indicating batter’s batting hand, left or right. As
shown in Figure 7, batter’s name, pitcher’s name, and
batter’s batting hand are displayed in the text output
field (
5
), the text output field (
6
), and the batting
hand marker (L) (
7
L) , respectively.
Next, the user inputs the location, type, and um-
pire’s decision of each pitch to the system in the next
way. First, the user clicks or touches the location in
the strike or ball zone (
8
) where the catcher receives
the pitch. Then, as shown in Figure 8 (a), the system
displays two circles with the same ordinal number in
the strike or ball zone (
8
) where the user clicked or
touched, and in the output field (
11
). Next, the user
clicks or touches one of the buttons of pitch types
(
9
) and one of the buttons of umpire’s decisions (
10
).
Then, as shown in Figure 8 (b), the system shows the
type of the pitch and umpire’s decision in the output
field (
11
). The user continues to input the locations,
types, and umpire’s decisions of the pitches until the
batting result is confirmed.
Finally, a user inputs the batting result to the sys-
tem in the next way: the user enters the batting result
to the text input field (
1
) and push the button for sub-
mitting a batting result (
4
). Then, the batting result
is displayed in the text output field (
12
). Figure 8 (c)
shows the pitch combination chart of Uchiki in the
first inning. When the user push the button (
13
), the
system creates a new pitch combination chart.
In preliminary experiments, members in Ryukoku
University Baseball Team reported that data record-
ing is easier and more quickly by using our system
than by using pens and paper. Furthermore, they re-
ported that pitch combination charts created by our
system are more readable than those created by us-
ing pens and paper. In the experiment, we used one
video of an at bat with four pitches. The video was
one minute and 30 seconds long. It started with the
scene where the umpire called “Play” and ended with
the scene where the pitcher got the batter to ground
out on the forth pitch. We showed the video to 10
members in Ryukoku University Baseball Team. All
of them were experienced in using pitch combination
charts. When 13 seconds passed from the start of the
video, the catcher received the first pitch. It was at
the moment that they started recording pitching data.
They took on average one minute and 38 seconds to
record pitching data when they used pens and paper.
On the other hand, they took on average one minute
and 23 seconds when they used our system. This time
lag is important because the next batter walked into
the batter’s box within one minute or less.
5 CONCLUSION
In order to set up new tactics to win games, our uni-
versity baseball team developed customized scouting
charts and records the type and course of every indi-
vidual pitch thrown by all the pitchers in our team and
rivals. However, it is not easy to record the pitching
data by using pens and paper. To solve this problem,
we developed an input support system for customized
scouting charts of baseball games in Unity and C#. In
An Input Support System for Customized Scouting Charts of Baseball Games
517

preliminary experiments, data recording is easier and
more quickly by using our system than by using pens
and paper. Furthermore, pitch combination records
created by our system are more informative and read-
able than those created by using pens and paper.
REFERENCES
Hamilton, M., Hoang, P., Layne, L., Murray, J., Padget,
D., Stafford, C., and Tran, H. (2014). Applying ma-
chine learning techniques to baseball pitch prediction.
In Proc. of the 3rd International Conference on Pat-
tern Recognition Applications and Methods (ICPRAM
2014), pages 520–527.
Hoang, P., Hamilton, M., Murray, J., Stafford, C., and Tran,
H. (2015). A dynamic feature selection based LDA
approach to baseball pitch prediction. In Proc. of
PAKDD 2015 Workshops, pages 125–137.
Kira, A. and Inakawa, K. (2014). On markov perfect equi-
libria in baseball. Data Science and Service Research
Discussion Paper, (24):1–20.
Komatsu, Y. and Kuwabara, T. (2013). Development of
a input support system for baseball scorebook using
ipad. In Proc. of The 75th National Convention of
Information Processing Society of Japan, volume 4,
pages 209–210.
Maruyama, T., Jishage, H., and Shohdohji, T. (2010). Study
on evaluating method for professional baseball pitch-
ers. In Proc. of the 53th Japan Joint Automatic Control
Conference, pages 22–25.
Terasawa, H., Arai, Y., and Ashida, K. (2013). Develop-
ment of a system supporting conclusively game man-
agement and reduction of work of a coach’s assistants
by mobile device. In Proc. of The 75th National Con-
vention of Information Processing Society of Japan,
volume 4, pages 883–884.
Turocy, T. L. (2008). In Search of the “Last-Ups” Advan-
tage in Baseball: A Game-Theoretic Approach. Jour-
nal of Quantitative Analysis in Sports, 4(2):1–20.
Uehara, T. and Arai, S. (2013). Pitching tactics estimation
based on probabilistic causal structure among game
components learned from the mlb detailed score data.
Technical Report of IEICE on Artificial intelligence
and knowledge-based processing (AI), 112(477):43–
48.
CSEDU 2016 - 8th International Conference on Computer Supported Education
518
