Optogentics and Optrode Technology to Brain Function
Manupulation
Mohammad Ismail Zibaii
1
, Leila Dargahi
2
, Abdolaziz Ronaghi
2
, Farshad Abedzadeh
1
,
Sareh Pandamoz
2
, Saeid Salehi
2
, Zahra Fattahi
3
, Abbas Haghparast
3
and Hamid Latifi
1
1
Laser and Plasma Research Institute, Shahid Beheshti University, Tehran, Iran
2
NeuroBiology Research Center, Shahid Beheshti University of Medical Sciences, Tehran, Iran
3
Neuroscience Research Center, Shahid Beheshti University of Medical Sciences, Tehran, Iran
{m_zibaye, latifi}@sbu.ac.ir, haghparast@yahoo.com, l.dargahi@sbmu.ac.ir
Keywords: Optogenetics, Optrode, Fiber Optic, Channelrhodopsin, Optical Stimulation, Neural Recording.
Abstract: Optogenetics comprises a growing family of related techniques for the optical interrogation and control of
excitable cells. Combining genetic targeting with light delivery systems makes it possible to drive or silence
subpopulations of neurons and the related behaviours, with a high spatiotemporal precision. Since optical
manipulation is fast, selective, and minimally invasive, it provides distinct advantages over traditional
electrical means or pharmacological approaches for cell perturbation. Here we showed in anesthetized rat that
optogenetic stimulation of nucleus accumbens (NAc) neurons increased neural activation. We labelled a
population of neurons activated with channelrhodopsin-2 (ChR2) and later optically stimulated these neurons
by using an optrode and recorded spontaneous action potentials from the one neuron.
1 INTRODUCTION
One of the main goals of systems neuroscience is to
understand the architecture and function of neural
circuits. These circuits consist of a complex network
of varying neural subtypes. The development of
technologies to regulate the activity of specific types
of cells is key to understanding how they contribute
to local network activity and overall brain function in
vivo. Classical neuronal manipulation techniques
such as electrical (Hales, 2010), pharmacological
(Gorostiza, 2008) and genetic ultrasound (Tufail,
2010) either simultaneously affect surrounding cells
and processes in addition to the target population or
have slow kinetics and poor reversibility.
To overcome these spatial and temporal
limitations, optogenetics have been developed based
on optical control of genetically targeted biological
systems (Deisseroth, 2006). Optogenetic techniques
provide a means of activating or inhibiting distinct
populations of neurons via light-sensitive microbial
membrane proteins at high temporal and spatial
resolution. As most neurons in the brain are not
naturally light-sensitive, selective expression of opsin
genes in targeted neural populations makes it possible
to specifically control the activity in these
populations, and the resulting fast on–off kinetics
make it possible to evoke or inhibit neural activity
within milliseconds, on a timescale relevant to the
physiological brain functions (Boyden, 2005) . A
remarkable feature of the optogenetic approach is the
ability to target probes to genetically defined cell
types and subcellular compartments, which allows the
probes to be used for investigating multiple levels of
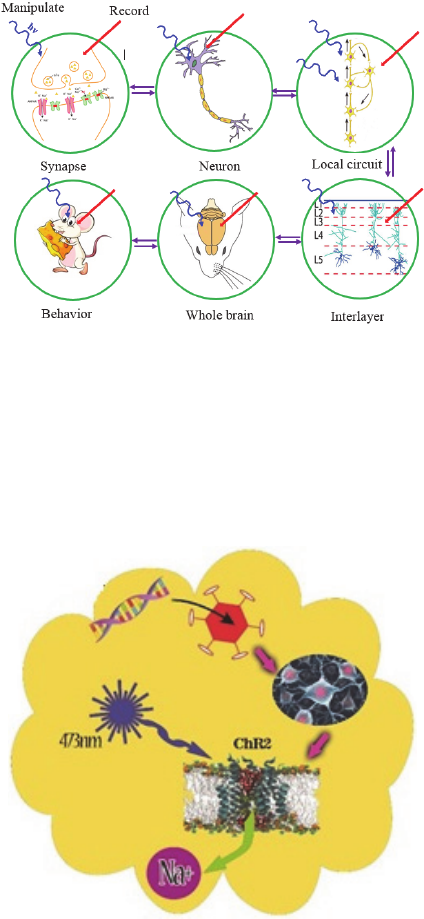
nervous system function. Fig. 1 illustrates the various
levels at which optogenetic strategies can be used to
manipulate function within mammalian neural
circuits.
The most common light-sensitive protein in use
today is channelrhodopsin-2 (ChR2), an algal protein
from Chlamydomonas reinhardtii. It is a light-
activated cation channel capable of transducing
millisecond long flashes of blue light into defined
spike trains as fast as 30- 50 Hz (Adamantidis , 2007;
Gunaydin, 2010).
Optogenetic approaches have been successfully
used in vitro to study basic synaptic properties of
specific neural circuits as well as in vivo to study the
role of such circuits in physiology and behaviour
(Berndt, 2011; Franklin, 2015;
Packer, 2015). The use
of optogenetic tools to stimulate or suppress the
activity of neural populations has potential
applications for both experimental and therapeutic
approaches (Krook-Magnuson, 2015).
Figure 1: Optogenetics can be applied at all levels of brain
function. A variety of applications use optogenetic probes
to both read out and manipulate activity. Specificity can be
achieved either by targeting probe expression to relevant
cellular compartments or network elements or by targeting
light to these elements. The ability to implement
optogenetics at different levels of nervous system function
provides a powerful way to make causal links between
these levels.
Figure 2: Making neurons react to light: For optogenetic
studies, neuroscientists insert opsin genes into brain cells
with the aid of engineered viruses. They can then trigger
neural activity on demand with flashes of light and observe
the effects on experimental animals’ behavior.
In this paper we presented several aspects
including challenges for light delivery in living brain
tissue, the combination of light delivery with
electrophysiological recordings and probe designs for
optogenetics technique. Also, we applied this
technique for simultaneous optical stimulation and
electrical recording by using a simple optrode in the
nucleus accumbens (NAc). In Figure 2 all of our
procedure were shown which includes viral
packaging, virus injection, gene expression in NAc,
and light stimulation of ChR2 ion channels.
2 PHYSICS OF OPTOGENETICS
Brain tissue is not transparent to visible light and one
of the main challenges for the use of optogenetics in
vivo is the limited light penetration and confinement
in deeper structures. Once the fibers is placed close to
the target area, light is emitted with a known power
density. However, as the light exits the fiber, it is
scattered and slightly adsorbed by the tissue, so that
the target area beyond the fiber will be actually
illuminated with a strong intensity gradient. The
properties of light transmission in brain tissue have
been largely characterized, and were shown to be
strongly dependent on the wavelength, with higher
absorption recorded for shorter wavelengths. Indeed,
due to light scattering and absorption, a usable
amount of visible light cannot easily reach deep brain
structures and illumination from an external source is,
in practice, limited to the cortex. Light intensity
attenuation and spread in brain tissue have been
measured and then fit with standard equations for
light propagation in scattering media to establish a
model for estimating the light power density at the
points further from the fiber exit.
The Beer–Lambert equation can be used to
estimate light attenuation after propagation in tissue:
z
z
eIzI
)(
0
)(
(1)
In Eq. (1), I (z) stands for the light intensity after
a travelled distance of z, I
0
is the initial intensity, and
μ
t
is the extinction coefficient. This coefficient can be
calculated from the absorption and scattering
coefficient in biological tissue, μ
a
(λ) and μ’
s
(λ),
respectively:
)()()(
sa
(2)
Both
)(
a
and
)(
s
depend on the
wavelength, λ. Note that light scattering in tissue is
anisotropic, meaning that light will scatter with
preferential angles. The value
)(
s
thus
incorporates an anisotropic factor, g:
)1( g
ss
(3)
Optical fibers thus offer a convenient alternative
to reach deeper structures. Two main aspects are
important when choosing the right fiber: the optical
fiber core size, which should be in the same order of
magnitude than the targeted area, and the optical fiber
numerical aperture (NA). The later influences the
transversal spread of the illumination volume and is
defined as
2
2
2
1
nnNA
(4)
where n
1
and n
2
are the refractive indices of the
fiber core and cladding, respectively.
Knowing these values and those of tissue optical
properties (extinction coefficients and refractive
index), one can easily estimate the effective
excitation volume at the fiber tip.
The complete relationship of light intensity to
tissue penetration distance was estimated by taking
the product of the measured transmission fraction
(remaining light not scattered or absorbed) and the
calculated fractional decrease in intensity due to the
conical geometry of emitted light at a given distance
in the absence of tissue scattering and absorption. The
half-angle of divergence θ
div
for a multimode optical
fiber is
)(sin
1
tis
fib
div
n
NA
(5)
where n
tis
is the index of refraction of gray matter
and NA
fib
is the numerical aperture of the optical fiber
(Ray, 1991 and Vo-Dinh, 2003).
Assuming conservation of energy, the geometric
decrease in intensity with distance from the fiber end
z was calculated (Aravanis, 2007):
2
2
)(
)0(
)(
z
zI
zI
(6)
Where
1)(
2
NA
n
r
(7)
where and r is the radius of the optical fiber. The
complete expression for intensity taking into account
both the scattering and geometric losses is
2
2
))(1(
)0(
)(
z
zI
zI
s
(8)
For neuron activation, the outer limit of this
volume that can be defined has the minimal intensity
value for action potential generation. This value will
differ from one protein to another and from one
subject to another since the membrane expression
level of the protein may vary. The volume of
activation can always be enlarged by increasing light
intensity at the fiber tip, but this intensity must be kept
below tissue damage threshold. This threshold will be
different for the different protocols used and
is
dependent on the stimulation duration and repetition
rate, but in most cases an intensity at the fiber tip
around 300 mW⁄mm
2
was reported to be safe.
However, for sustained stimulation, damages were
reported at levels above 100 mW⁄mm
2
. Using this
input intensity at the tip of an optical fiber of 200 μm
core diameter with an NA of 0.2, the limit for ChR2
activation (1 mW⁄mm
2
) is reached at a distance of ≈2
mm. The dashed line represents the1 mW⁄mm
2
activation threshold.
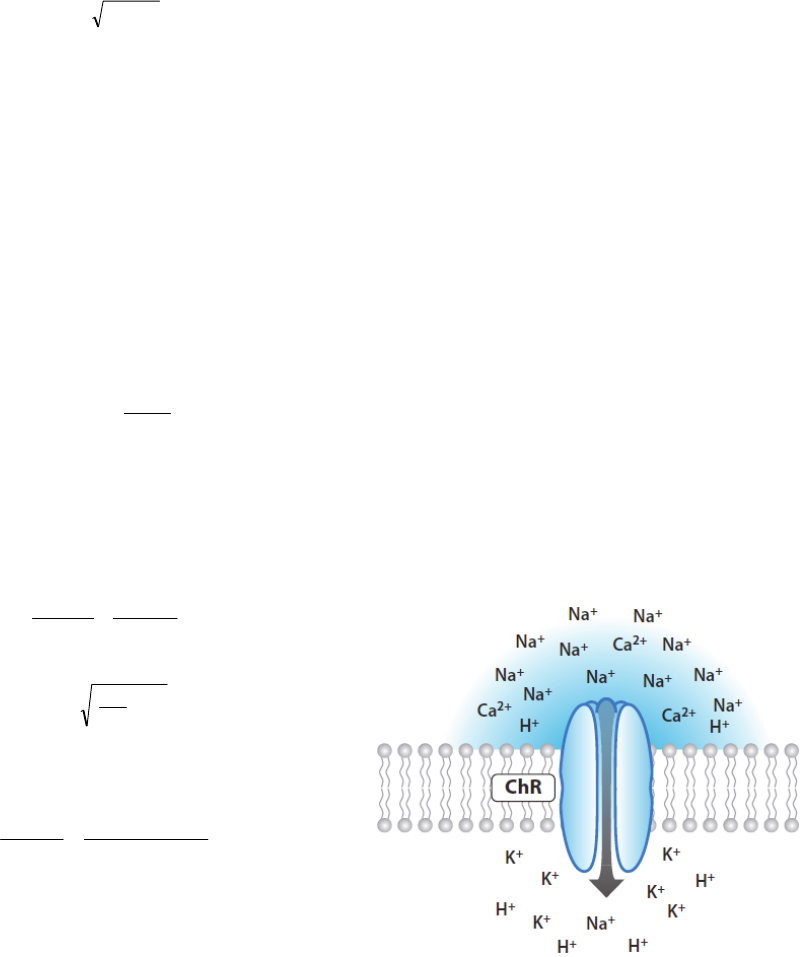
ChR2 is both light and voltage-sensitive. Figure 3
shows the schematic of ChR2 mechanism. The
conducting pore of the channel associates (via a
covalent bond) to retinal, which serves as the
chromophore (the light-sensing element). Interaction
of all-transretinal with a photon of the proper
wavelength (470 nm) leads to instantaneous
isomerization to 13-cis-retinal. This transition
triggers the opening of the ion channel allowing
cation movements down their electrochemical
gradient, with preferential selectivity to H
+
(Nagel,
2003; Lin, 2009). ChR2 at negative membrane
potentials provides exclusively inward current with a
reversal potential near 0 mV. The single channel
conductance for the wild type ChR2 is small
compared to classical excitatory ion channels (e.g.
sodium channels) with reported values ranging from
40–90 Fs (Zimmermann, 2008 and Nagel, 2003) to
0.25–2.42 ps (
Lin, 2009). Genetically engineered
mutants of ChR2, e.g. H134R yields larger
photocurrents relative to wild-type ChR2, but with
slower K
off
kinetics.
Figure 3: Channelrhodopsins conduct cations and
depolarize neurons upon illumination.
For a genetically based photostimulation method,
the magnitude of the response depends as well on the
total number of ChR2 proteins that are illuminated,
which is a function of the expression level. Although
single-channel studies have not been performed,
ChR2 has been estimated to possess a single-channel
conductance as low as 50 femtosiemens (Nagel, 2003).
This would imply that between 100,000 and
1,000,000 ChR2 molecules would have to be
generated and localized to the neuronal membrane to
achieve the observed currents in the range of 1 nA
which is starting from a resting potential of –70 mV
and neglecting space-clamp issues and changes in
driving force due to ion entry (Zhang, 2006).
3 MATERIAL AND METHODS
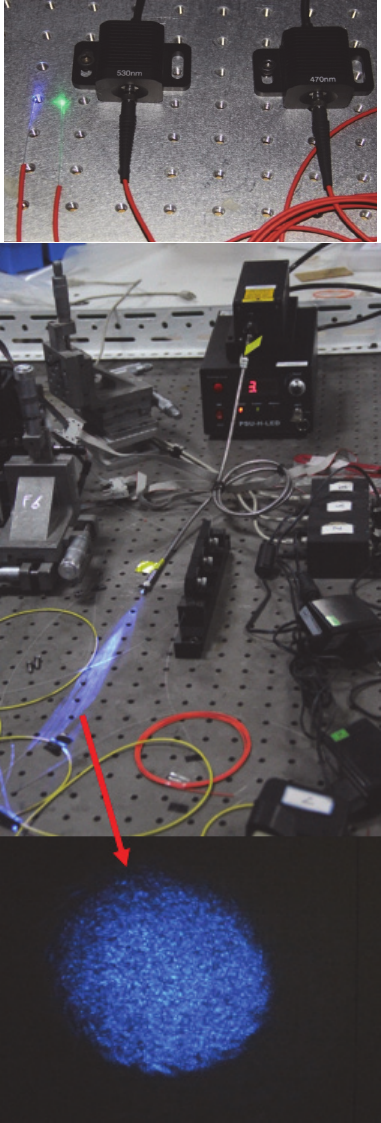
3.1 Light Sources
The choice of the light source is dictated by the
experimental needs in terms of light power and
frequency of light pulses. Either laser (diode or diode-
pumped solid state, DPSS) or light-emitting diodes
(LED) have been conveniently employed in
optogenetics experiments (Kale, 2015). Figure 4
show LEDs and a DPSS laser. Blue wavelengths are
needed for excitatory ChR while yellow wavelengths
are required for inhibitory Halorhodopsins. Lasers
have the advantage of having a very narrow spectral
linewidth (less than 1 nm), which is particularly
useful in the case of experiments with multiple opsins
with different peak activation wavelengths.
Moreover, laser beams have very low divergence,
allowing for an easy and straightforward light
manipulation by means of mirrors and lenses and
therefore a highly-efficient coupling into optical
fibers. Disadvantages of lasers are high cost,
especially for yellow lasers, long warming times, and
stability. Moreover, problems can be encountered
when high speed modulation is required, especially
for yellow DPSS lasers (
Aravanis, 2007).
LEDs are instead low cost, do not need complex
control electronics and can be easily modulated at the
millisecond scale. Main disadvantages of LEDs are a
relatively wide spectral linewidth (a few tens of nm)
and a pronounced beam divergence and broad
emission pattern, which hinders a good LED-to-fiber
coupling as needed to deliver high light powers.
LEDs integrated on the device to be implanted have
also been employed (
Kim, 2010). The main advantage
of using on-implant LEDs is that LEDs are driven by
an electrical signal, which allows using only electrical
connecting cables when combined with recording
electrodes. However, due to the poor coupling with
optical fibers, local LEDs have been mostly
employed as local light source for surface
illumination or implanted in the tissue as miniaturized
micro-LEDs (
Grossman, 2010). Using local LEDs
enable the realization of wireless systems where the
LED driving electrical power is transmitted and/or
modulated with a radio link. As a main drawback, full
operation of these systems is limited by the generated
heat.
Figure 4: LED and DPSS laser as light source in optognetic
technique.
3.2 Fiber Optic Approaches for Light
Delivery in Vivo
Different experimental paradigms adopted for
optogenetic actuation of neurons correspond to
specific spatio-temporal light delivery approaches.
For example, short light pulses and small duty cycles
are used in the case of bistable optogenetic control
(
Yizhar, 2011 and Sileo, 2015), whereas continuous
light delivery is needed for inhibition of neurons
(
Yizhar, 2011). As well, different light delivery
methods need to be employed for different target
regions. Microscope objective are mostly used for
optogenetic control of cortical layers (
Bovetti, 2015
and Losonczy, 2010), while fiber optics-based implants
are the most widely spread technology for accessing
deep brain regions.
Using a standard fiber optic is by large the most
employed approach for optogenetic investigation of
deep brain targets. However, the implantation of a
fiber optic invariably causes a certain degree of
mechanical damage to the brain tissue and often
localized bleeding, especially when large core fibers
are used for high light power delivery needs. For
applications requiring multipoint illumination
(Warden, 2014 and
Sileo, 2015), such as in bilateral
stimulation, illumination of large volumes, or
illumination of multiple sites with specific spatial
patterns, using multiple standard optical fibers leads
to major invasiveness issues.
Technological efforts have been made to realize
miniaturized, micro-fabricated waveguides (
Abaya,
2012 and Zorzos, 2012), which were also integrated
with recording electrodes or with LEDs (
Stark, 2013).
The first optical neural interface successfully used
for optogenetic neural interfacing in anesthetized
(
Aravanis, 2007) and freely behaving (Adamantidis,
2007) rodents. In this approach, a cannula is
implanted in the skull above the target region and
used as the guide for both the needle used for viral
injection for opsins genetic encoding and the fiber
optic. This system assures the co-registration between
opsin-expressing and illuminated brain volumes,
allows targeting regions with different depths and,
remarkably, it permits to combine optogenetic and
pharmacological manipulations.
A second largely employed system consists on the
use of a permanently implanted fiber, connectorized
at one end with a ceramic ferrule which remains just
outside the skull (
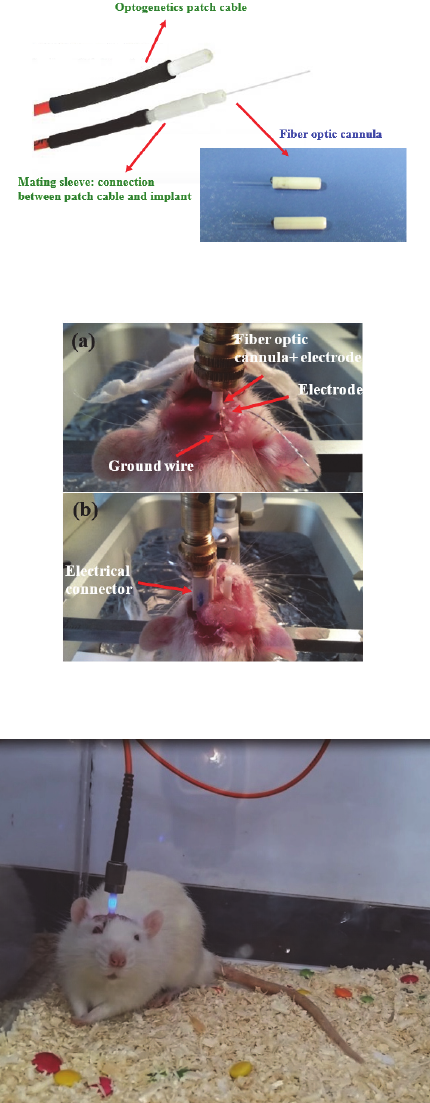
Sparta, 2012 and, Zhang, 2010). Figure
5 shows a fiber optic cannula. Connection with the
light source through a patch cord is made only at the
time of the experiment with the mating sleeve system.
Figure 5: Fiber optic patch cable connected to a fiber optic
cannula.
Figure 6: Impelantation of (a) fiber optic cannula and (b)
electrode for freely moving.
Figure 7: Inmplanted fiber optic cannula in freely moving
rat.
Figure 6 shows a fiber optic cannula which is
stereotactically implanted in the target area. As is
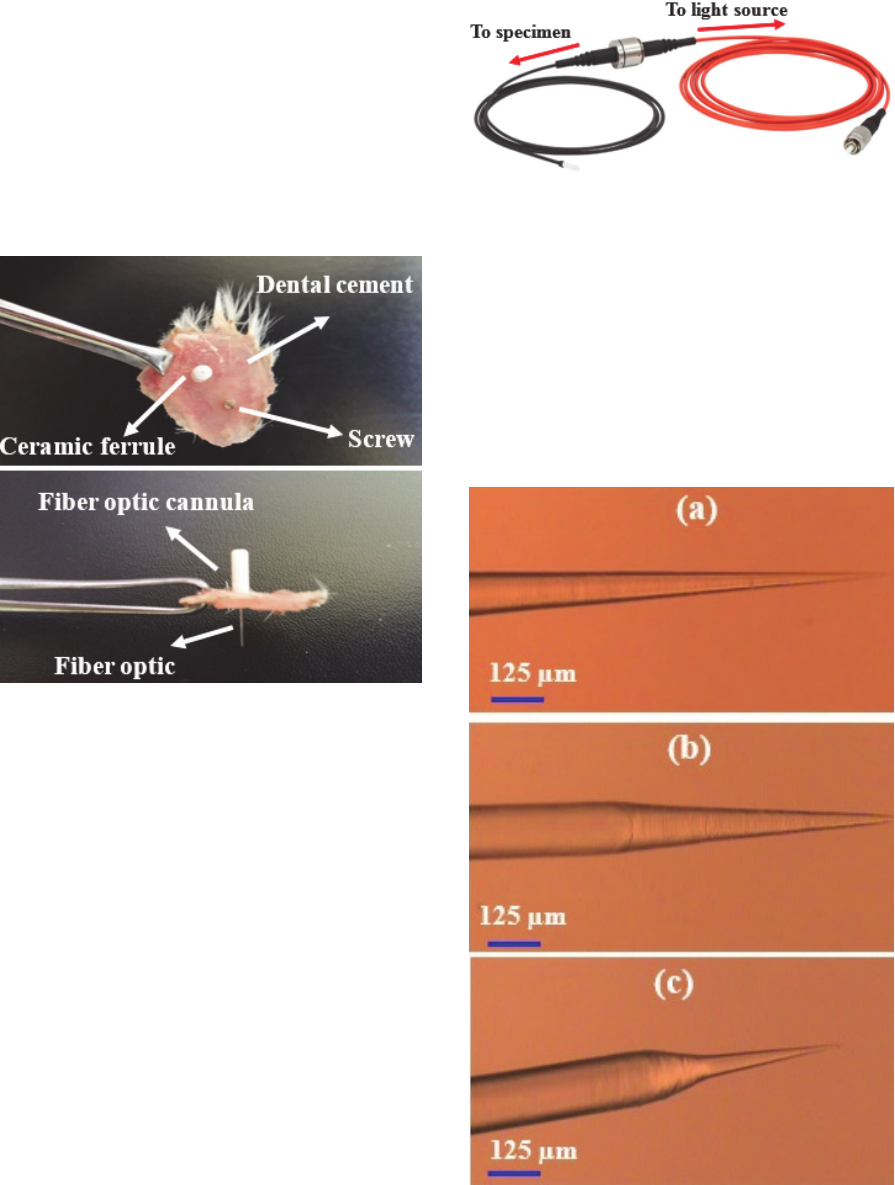
shown in figure 7 in experiments with freely moving
animals the fiber is coupled with a light source.
This system has the advantage of reducing tissue
damage from repeated fiber insertions, as well as the
risk of infection. Although the co-registration
capability of the cannula system is lost, the ferrule
implant system is ideal for high-throughput
behavioral experiments with chronic implants. Figure
8 shows a fiber optic cannula after removing of
implantation.
Figure 8: Fiber optic cannula after removing of
implantation.
Also, in optogenetics experiments with live
animals for the free movement of animal and fiber
optic cables with a minimum of torque while
maintaining excellent light transmission can be used
a fiber optic Rotary Joint (FORJ). Figure 9 shows a
FORJ which fiber optic leads of these cables are
permanently attached to the rotary joint for higher
performance and provide a one piece, integrated fiber
optic solution. For compatibility with a wide range of
cannulae, light sources, and experimental setups,
there are rotary joint cables using fibers with different
core sizes and NAs. There are cables with different
connectors or any length of fiber on each end of the
joint. For best performance, the fiber core size should
be 200 µm or greater.
Figure 9: A FORJ for coneting of the light source to
implanted fiber optic cannula for freely moving
experiments.
Two point light delivery can be simply realized
with two separately implanted cannulas or ferrules,
the minimum distance between the two target sites
becoming the main limitation. Using more than two
fibers for studying photo-activation patterns becomes
prohibitive with standard approaches. Some
alternative approaches have been proposed for
multipoint light delivery with standard optical fibers
and tapered fibers (Pisanello, 2014, Dufour, 2015).
Figure 10: Tip fiber optic with different tip profiles.
Tapered fibers, i.e. fiber optics with a tip that is
chemically (Andre, 2015) or thermo-mechanically
etched down to sub-micrometer diameters have been
used to reduce the insertion damage of fiber optics.
However, their use for optogenetic light delivery
is limited by the lack of a complete optical
characterization, even when peculiar light emission
properties of tapered fibers can potentially explain
new optogenetic manipulation capabilities, which
cannot be achieved with a standard optical fiber
(
Royer, 2010). Figure 10 shows different tapered fiber
tips which are fabricated with chemical etching
method (Andre, 2015). A SEM photo of tapered fiber
tip is shown in figure 11.
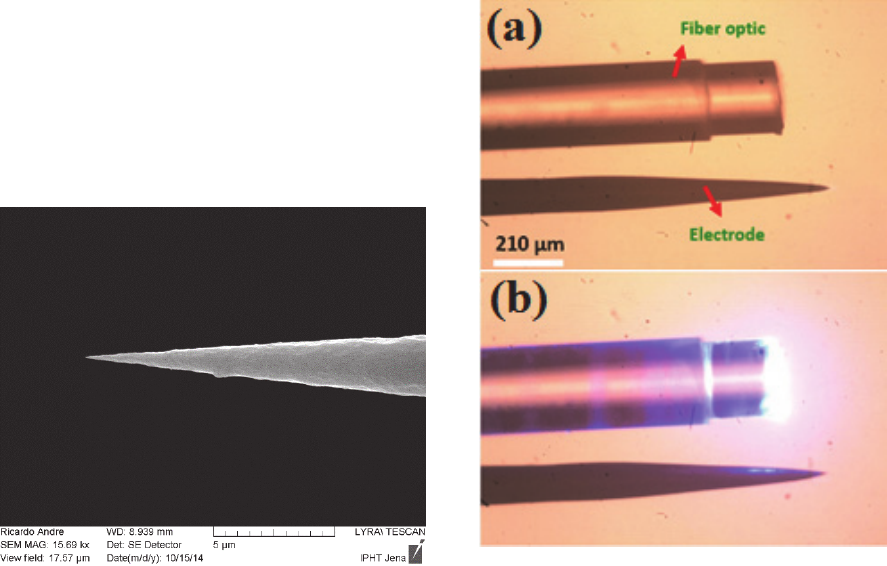
Figure 11: SEM micrographs of tapered fiber tips.
3.3 Optrode Fabrication
Compared with electrical stimulation, the optical
method offers a seamless solution to the problem of
cross-talk generated by simultaneous electrical
stimulation and recording. To optically manipulate
and electrophysiologically record neural activity for
anesthetized animal, we developed a dual-function
device which is named optrode. As is shown in figure
12 the optrode is made by simply gluing a step index
fiber optic with core diameter 200 μm to a tungsten
microelectrode for anesthetized recording. The total
fiber diameter with cladding is 20 to 30 μm larger,
thus resulting in an overall implant cross section of
few hundreds of micrometers.
It should be noted that the optical excitation
generates photoelectric artefacts that interfere with
electronics (Kozai, 2015). One important
characteristic of the photoelectric effect is that
electrons are only dislodged by the photoelectric
effect if light reaches or exceeds a threshold
frequency, below which no electrons can be emitted
from the electric conductor regardless of the
amplitude and temporal length of exposure of light.
In this study for controlling of photoelectric effect the
fiber tip is placed in certain distance of the electrode.
Figure 12: (a) The self-designed optrode, and (b)
illumination of blue light from tip of fiber.
3.4 Stereotactic Implantation of the
Guide Cannula
Male Wistar rats weighing about 280 g were
anesthetized with Ketamine (80 mg/kg, i.p.) and
xylazine (10 mg/kg, i.p.) with supplemental doses as
required. After mounting the animal into the
stereotactic frame, a first incision is made to open the
skin above the skull. The skin is gently pulled to the
side to reveal the cranial sutures. After quickly wiping
the skull with hydrogen peroxide, the bregma and the
lambda can be easily identified (marked spots). With
a dental drill a small craniotomy was created at the
desired location on the skull, without puncturing the
dura. The dura is later removed using fine forceps to
minimize damage to the cortex. A guide cannula is
then implanted on the skull targeting nucleus
accumbens in right brain hemisphere. Metabond and
dental cement are used to secure the cannula guide to
the skull. The animal is allowed to rest in a recovery
cage after surgical implantation. The surgery was
conducted according to established animal care
guidelines and standard protocols (Riahi, 2015).
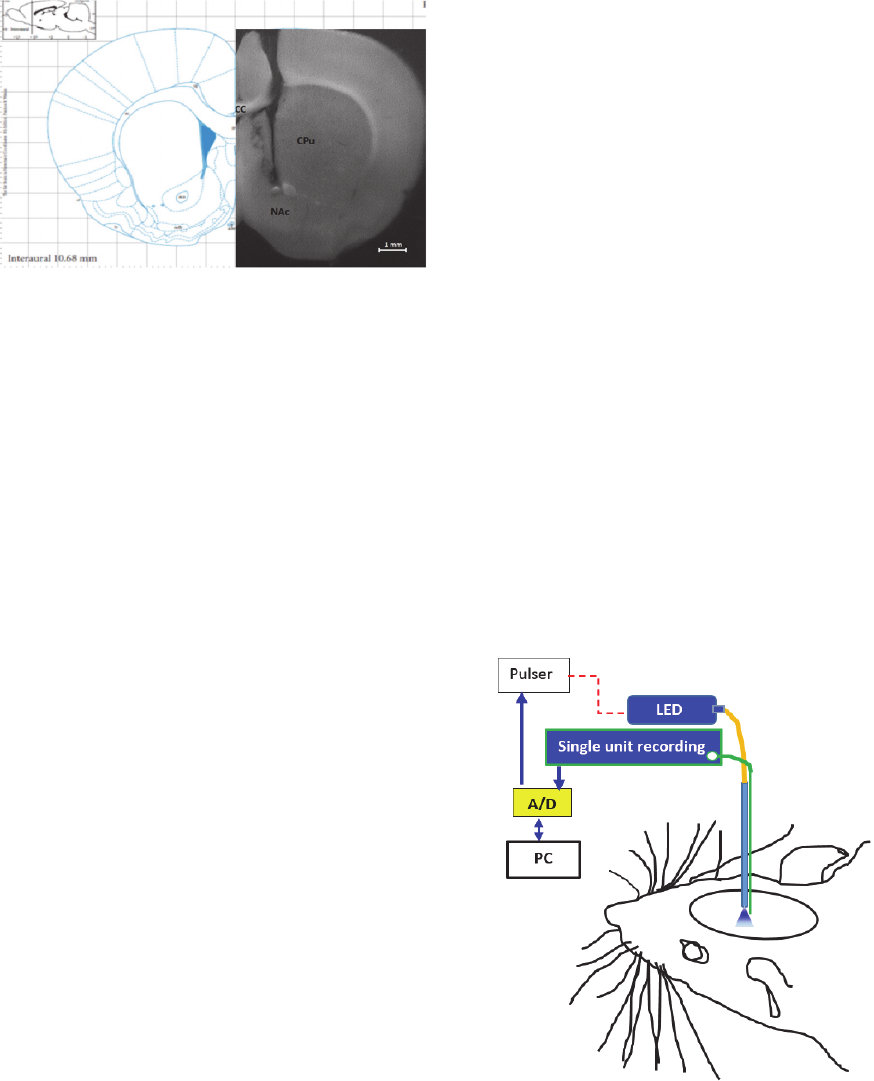
Figure 13: A coronal photomicrograph of unilateral
microinjection and optic fiber sites in the nucleus
accumbens of rat. aca, anterior commissure, anterior part;
CC, corpus callosum; CPu, caudate putamen (striatum);
NAc, nucleus accumbens.
3.5 Virus Injection
ChR2 can be stably introduced into tissues through
techniques such as viral delivery, creation of
transgenic lines or electroporation. Lentiviral
technology provides a convenient combination of
stable long-term expression and ease of
electrophysiological validation of functional
expression. Unlike the generation of transgenic
animals, lentiviruses can be produced in days, and
stable gene expression can be observed as early as 8
days after infection.
In this study we used lentiviral plasmid DNA
encoding ChR2 (pLenti-CaMKIIa-hChR2(H134R)-
mCherry-WPRE, Optogenetics.org), obtained from
Stanford University and amplified using standard
methods in molecular biology (MidiPrep,
QIAGEN).Viral injection for ChR2 expression was
conducted 24 h after guide cannula implantation with
consequent three times by interval 72 h.
A convection driven injector with a hypodermic
needle (G32 Hamilton) was slowly driven into the
pre-defined NAc through the guide cannula. Prior to
actual injection, we advanced the needle beyond the
target depth by 100 μm and retracted it by the same
distance to create a vacuous cavity. Injection was
made in target place with coordination of 1.7 mm AP,
+1.4 mm ML and -7.0 mm DV according to the atlas
of Paxinos and Watson, 6
th
Ed. Viral solution was
injected at a speed of 0.1 μL min
−1
and volume of 1
μL. After injection solution the needle leaved in place
for 10 additional min to allow the virus to diffuse in
the target zone.
To confirm transgene expression,
immunohistochemical analysis was performed on
paraffin-embedded brain coronal sections using
antibody against mCherry and HRP-DAB
visualization system, after electrophysiological
recordings.
4 EXPERIMENTAL SETUP
Three weeks after last virus injection, rats were
deeply anesthetized with Urethane (1.5 g/kg, i.p.,
with supplemental doses as required; Sigma–Aldrich,
Germany) and mounted into the stereotactic frame.
To reduce the respiratory efforts and maintain an
open airway during the recording, the rats were
subjected to surgical tracheostomy.
To record the neural activity in NAc area under
optical stimulation, a homemade single unit recording
setup was used. The electrical signal was filtered
(300–6,000 Hz) and amplified. The optrode was
propagated via the mechanical drive to the recording
site at least 30 min before the experiment to ensure
stable recordings. Optical stimulation was applied
through an optical fibre attached to the fibre-ferrule
of the optrode. For optical stimulation of the NAc in
ChR2-expressing rat, we used a blue laser diode (λ
=473 nm, thorlabs) pulsed at 20 Hz, with 25 ms pulse
width and a power density of 60–160 mW mm
−2
at
the tip of the fiber. Before starting any stimulation,
the input–output function of the laser should be tested
Figure 14: Schematic of experimental setup for
simultaneous optical stimulation and electrical recording by
using optrode, containing optrode, LED, Pulser, single unit
recording system, A/D, and PC.
with the optical power meter. The light power at
different distances from the fiber tip was estimated as
a function of both wavelength and the power of light
at the fiber tip. Only a low total output power may be
needed to achieve ChR2 activation. For instance, 2
mW at the tip of a 200-μm core diameter fiber
corresponds to 64 mW mm
− 2
, well above the minimal
effective range for in vivo stimulation. Schematic of
experimental setup is shown in figure 14.
5 EXPERIMENTAL RESULTS
Depending on targeted cell type, the maximal evoked
firing frequency will vary. Spiking properties in
targeted cells depend on spike and illumination
history as well as on membrane expression level of
ChR2 and local illumination intensity; for any given
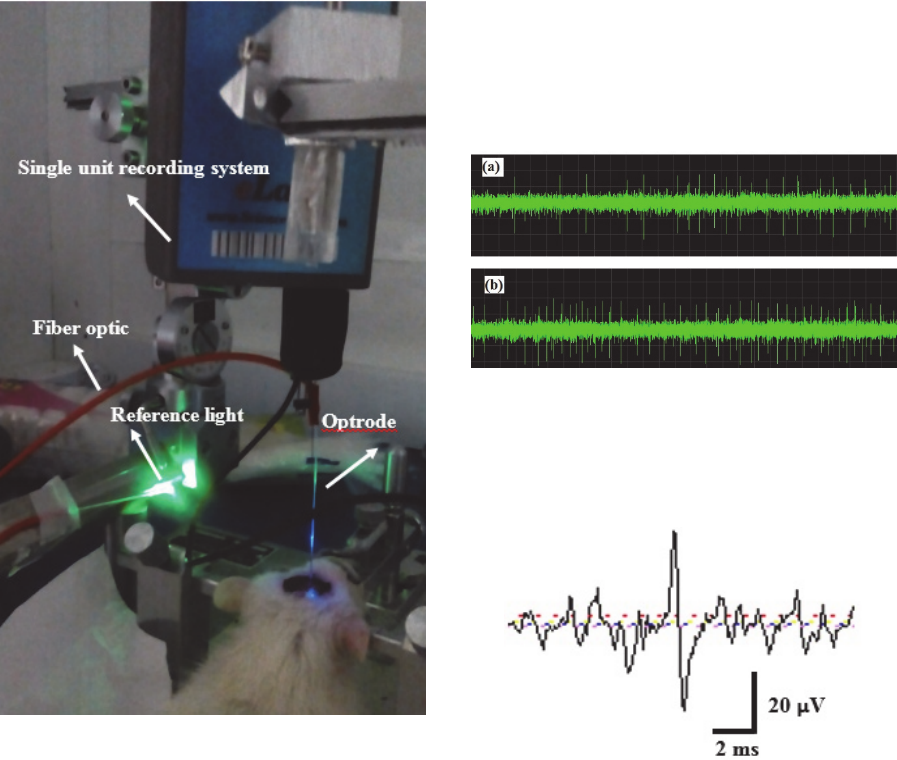
Figure 15: A photo of anesthetised rat optical stimulation
and electrical signal recording by using optrode in
optogenetic technique, containing fiber optic, optrode and
reference light.
cell type and circuit, a detailed characterization
should be carried out to determine the efficacy of light
evoked spike trains. To track and validate activity
modulation, optrode recordings can be carried out in
vivo. Artifacts, although much smaller than for
electrical stimulation, can be occasionally observed;
when present, such artifacts are correlated with the
onset and offset of the light pulse; amplitude depends
on light power and can be reduced with proper
grounding and use of electrodes with coating
extending to the tip and staggered relative to the
optical fiber by 300–500 μm, as is typically important
in any case for proper illumination of the recorded
area (
Ozden, 2013).
The neuron activity in the NAc area under
different optical stimulations were recorded by using
optrode. A photo of experimental setup for optical
stimulation of anesthetized rat is shown in figure 15.
Typical raw electrophysiological recordings before
and after optical stimulation were shown in figure 16.
The raw data shows that with optical stimulation the
firing rate of the same neuron can be increased. A
typical expanded waveform of a spike generated form
one of the NAc neurons in an anesthetized rat was
shown in figure 17.
Figure 16: Raw data of the neuron activity recorded from
anesthetized ChR2-expressing rat by using optrode. The
trace (a) representing recording of single unit activity from
the NAc of an anesthetized rat. The trace (b) representing
recording of single unit activity from the same neuron after
optical stimulation.
Figure 17: An expanded waveform of a spike generative
form one of the NAc neurons.
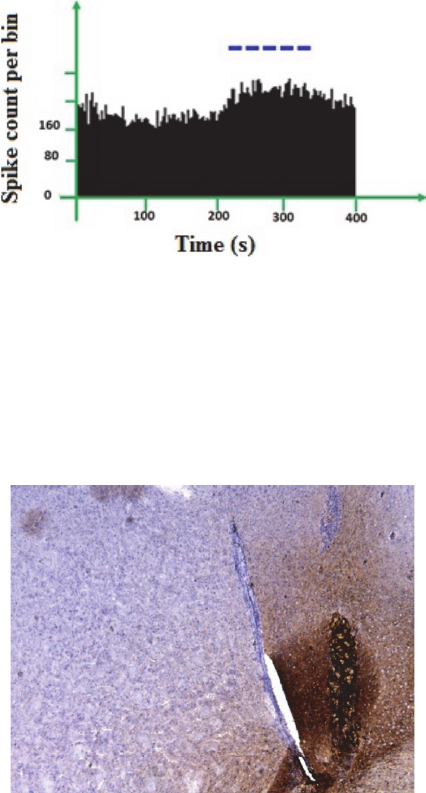
The figure 18 shows the histogram of spike firing
rate per bin. As shown in this figure optical
stimulation caused to significant in histogram bars.
The dash line indicate the duration of light
illumination.
Figure 18: Histograms representing spike count per bin over
the entire recording the firing frequency of one recorded
neuron. Stimulation by blue light increased the firing
frequency of the recorded neuron.
After the electrophysiological experiments, the rat
was sacrificed to check the virus expression and fiber
tip position. Figure 19 shows a representative coronal
brain section immunostained against mCherry.
Figure 19: Coronal section of rat brain immunostained for
mCherry, at 10x objective magnification.
6 CONCLUSIONS
We employed optogenetic manipulations based on
viral transduction of ChR2 in the brain region of NAc
and by using an optrode in the same time, signal of
one neuron was recorded. The results demonstrated
that optogenetic activations of the excitatory neurons
expressing CaMKIIߙ in the NAc able to activate the
neuron. Moreover, this study has provided a novel
method to optically stimulation of the neuron. Also,
Optrodes are important in the study of brain function,
especially using the method of optogenetics. We
believe the optogenetics and optrode technology will
likely play a crucial role in contributing to our deep
understanding of how diverse classes of neural circuit
components interact to give rise to complex
behaviors, pathological conditions, and therapeutic
responses.
ACKNOWLEDGEMENTS
This work was supported by the Cognitive Science
and Technologies Council of Iran (CSTC). We thank
Prof. Fereshteh Motamedi and Prof. Abolhassan
Ahmadiani for useful discussion.
REFERENCES
Abaya, T., V., Blair, F., S., Tathireddy, P., Rieth, L.,
Solzbacher, F., A., 2012. 3D glass optrode array for
optical neural stimulation, Biomed. Opt. Express, vol.
3, pp. 3087–3104.
Adamantidis, A.R., Zhang, F., Aravanis, A.M., Deisseroth,
K. & de Lecea, L., 2007. Neural substrates of
awakening probed with optogenetic control of
hypocretin neurons. Nature 450, 420–424.
Aravanis, A., M., Wang, L., P., Zhang, F., Meltzer, L., A.,
Mogri, M., Z., Schneider, M., B., Deisseroth, K., 2007.
An optical neural interface: in vivo control of rodent
motor cortex with integrated fiber optic and optogenetic
technology, J. Neural Eng., vol. 4, pp. S143–156.
André, R., M., Becker, M., Dellith, J., Manfred Rothhardt,
M., Zibaii, M., I., H. Latifi, H., Marques, M., B.,
Bartelt, H., Frazão, O., 2015. Bragg grating fabrication
on tapered fiber tips based on focused ion beam milling.
Proc. SPIE 9634.
Berndt, A., Schoenenberger, P., Mattis, J., Tye, K.M.,
Deisseroth, K., Hegemann, P., Oertner, T.G., 2011.
High-efficiency channelrhodopsins for fast neuronal
stimulation at low light levels. Proc Natl Acad Sci USA;
108(18):7595–7600.
Boyden, E.S., Zhang, F., Bamberg, E., Nagel, G.,
Deisseroth, K., 2005. Millisecond-timescale,
genetically targeted optical control of neural activity.
Nat Neurosci.; 8(9):1263–1268.
Bovetti, S., T. Fellin, T., 2015. Optical dissection of brain
circuits with patterned illumination through the phase
modulation of light, Journal of Neuroscience Methods,
vol. 241, pp. 66-77.
Deisseroth, K., Feng, G.P., Majewska, A.K., Miesenbock,
G., Ting, A., Schnitzer, M.J., 2006. Next-generation
optical technologies for illuminating genetically
targeted brain circuits. J Neurosci.; 26(41):10380–
10386.
Dufour, S., De Koninck, Y., 2015. Rewiev: Optrodes for
combined optogenetics and electrophysiology in live
animals, Neurophotonics 2(3), 031205-14.
Feldbauer, K., Zimmermann, D., Pintschovius, V., Spitz, J.,
Bamann, C., et al. 2009, Channelrhodopsin-2 is a leaky
proton pump. Proc Natl Acad Sci USA 106: 12317–
12322.
Franklin, G.F., Powell, J.D., and Emami-Naeini, A., 2015.
Feedback control of dynamic systems. (New York:
Prentice Hall).
N. Grossman, V. Poher, M.S. Grubb, et al.: Multi-site
optical excitation using ChR2 and micro LED array, J.
Neural Eng. vol. 7, pp. 16004, 2010.
Gorostiza, P., Isacoff, E.Y., 2008. Optical switches for
remote and noninvasive control of cell signaling.
Science.; 322(5900):395–399.
Gunaydin, L.A., Yizhar, O., Berndt, A., Sohal, V.S.,
Deisseroth, K., Hegemann, P., 2010. Ultrafast
optogenetic control. Nat Neurosci.; 13(3):387–392.
Hales, C.M., Rolston, J.D., Potter, S.M., 2010. How to
culture, record and stimulate neuronal networks on
micro electrode arrays (MEAs) J Vis Exp.;
30(39):2056.
Kale, R., P., Kouzani, A., Z., Walder, K., Berk, M.,
Susannah J. Tye, S., J., 2015. Review: Evolution of
optogenetic microdevices, Neurophotonics, vol 2(3),
031206.
Kim, T., I., McCall, J., G., Jung, Y., H., Huang, X., Siuda,
E., R., Li, Y., Song, J., Song, Y., M., Pao, H., A., Kim,
R., H., Lu, C., Lee, S., D., Song, S., Shin, G., C., Al-
Hasani, R., Kim, S., Tan, M., P., Huang, Y., Omenetto,
F., G., Rogers, J., A., Bruchas, M., R., 2013. Injectable,
cellular-scale optoelectronics with applications for
wireless optogenetics, Science, vol. 340, pp. 211–216.
Kozai, T., D., Y., Vazquez, A., L., 2015. Photoelectric
artefact from optogenetics and imaging on
microelectrodes and bioelectronics: new challenges and
opportunities, J. Mater. Chem. B, vol. 3, pp.4965-4978.
Krook-Magnuson, E., Armstrong, C., Bui, A., Lew, S.,
Oijala, M., and Soltesz, I. 2015. In vivo evaluation of
the dentate gate theory in epilepsy. J. Physiol.
Lin, J.,Y., Lin, M.Z., Steinbach, P., Tsien, R.,Y., 2009.
Characterization of engineered channelrhodopsin
variants with improved properties and kinetics. Biophys
J 96: 1803–1814.
Losonczy, B.V. Zemelman, A. Vaziri, et al.: Network
mechanisms of theta related neuronal activity in
hippocampal CA1 pyramidal neurons, Nat. Neurosci.,
vol. 13, pp. 967–972, 2010.
Nagel, G., Szellas, T., Huhn, W., Kateriya, S., Adeishvili
N, Berthold, P., Ollig, D., Hegemann, P., Bamberg, E.,
2003. Channelrhodopsin-2, a directly light-gated
cation-selective membrane channel. Proc Natl Acad Sci
USA 100: 13940–13945.
Ozden, I., Wang, J., Lu, Y., May, T., Joonhee Lee, J., Goo,
W., Shea, D.J., Kalanithi, P., Diester, I., Diagne, M.,
Deisseroth, K., Shenoy, K.V., Arto V. NurmikkO,
A.V., 2013. A coaxial optrode as multifunction write-
read probe for optogenetic studies in non-human
primates. J. Neurosci. Meth. 219, 142– 154.
Packer, A.M., Russell, L.E., Dalgleish, H.W.P., and
Hausser, M., 2015. Simultaneous all-optical
manipulation and recording of neural circuit activity
with cellular resolution in vivo. Nat. Methods 12, 140–
146.
Pisanello, F., Sileo, L., Oldenburg, I., A.3, Pisanello, M.,
Martiradonna, L., Assad, J., A., Sabatini, B., L., De
Vittorio, M., 2014. Multipoint-emitting optical fibers
for spatially addressable in vivo optogenetics,” Neuron
82(6), 1245–1254.
Rays A., G., Fibers C., S., M., 1991. Fiber optics.
Riahi, E., Arezoomandan, R., Fatahi, Z., Haghparast, A.,
2015. The electrical activity of hippocampal pyramidal
neuron is subjected to descending control by the brain
orexin/hypocretin system, Neurobiol. Learn Mem.,
119, 93–101.
Royer, S., Zemelman, B., V., Barbic, M., Losonczy A,
Buzsáki, G., Magee, J., C., 2010. Multi-array silicon
probes with integrated optical fibers: Light-assisted
perturbation and recording of local neural circuits in the
behaving animal, Eur. J. Neurosci., vol. 31, pp. 2279–
2291.
Sileo, L., Pisanello, M., Patria, A., D., Emhara, M., S.,
Pisanello, F., Massimo De Vittorio,M., 2015. Optical
Fiber Technologies for in-vivo Light Delivery and
Optogenetics. Transparent Optical Networks (ICTON).
Sparta, D., R., Stamatakis, A., M., Phillips, J., L., Hovelsø,
N., Van Zessen, R., Stuber, G., D., 2012. Construction
of implantable optical fibers for long-term optogenetic
manipulation of neural circuits, Nature Protocols, vol.
7, pp. 12-23.
Tufail, Y., Matyushov, A., Baldwin, N., Tauchmann, M.L.,
Georges, J., Yoshihiro, A., Tillery, S.I., Tyler, W.J.,
2010. Transcranial pulsed ultrasound stimulates intact
brain circuits. Neuron. 66(5):681–694.
Vo-Dinh, T., 2003. Biomedical Photonics Handbook (Boca
Raton, FL: CRC Press).
Warden, M., R., Cardin, J., A., K. Deisseroth, K., 2014.
Optical neural interfaces, Annu. Rev. Biomed. Eng., vol.
16, pp. 103-129.
Wu, F., Stark, E., Im, M., Cho, I., J., Yoon, E., S., Buzsáki,
G., Wise, K., D., Yoon, E., 2013. An implantable neural
probe with monolithically integrated dielectric
waveguide and recording electrodes for optogenetics
applications, Journal of Neural Engineering, vol. 10,
pp. 056012.
Yizhar, O., Fenno, L., E., Davidson, T., J., Mogri, M.,
Deisseroth, K., 2011. Optogenetics in neural systems,
Neuron, vol. 71, pp. 9-34.
Zhang, F., Wang, F.L., Boyden, E.S., Deisseroth, K., 2006.
Channelrhodopsin-2 and optical control of excitable
cells, Nat. Methods 3(10), 785-792.
Zhang, F., V. Gradinaru, V., A.R. Adamantidis, A., R., ,
Durand, R., Airan, R., D., de Lecea, L., Deisseroth K.,
2010. Optogenetic interrogation of neural circuits:
Technology for probing mammalian brain structures,
Nat. Protocols, vol. 5, pp. 439–456.
Zimmermann, D, Zhou, A., Kiesel, M., Feldbauer K.,
Terpitz, U., Haase, W., Schneider-Hohendorf, T.,
Bamberg, E., Sukhorukov, V.L., 2008. Effects on
capacitance by overexpression of membrane proteins.
Biochem Biophys Res Commun 369: 1022–1026.
Zorzos, A., N., Scholvin, J., Boyden, E., S., Fonstad, C., G.,
2012. 3-dimensional multiwaveguide probe array for
light delivery to distributed brain circuits, Opt Lett., vol.
37, pp. 4841–4843.
