
Ecosystem Health Evaluation of Yima Coal-Mining Area based on
Fuzzy Synthetic Evaluation Method
Xiaoyan Tao and Jiulong Zhu
School of Economics & Management, Zhongyuan University of Technology, Zhengzhou City, Henan Province, China
{taoxiaoyan322177, zhujiulong7699}@163.com
Keywords: Coal-Mining Area, Ecosystem Health Evaluation, Fuzzy Mathematics, Entropy Method, Analytic Hierarchy
Process.
Abstract: Evaluation of ecosystem health can help people realize the situation and developing trend of the ecological
system of the area. An evaluation index system of ecosystem health of coal-mining area based on Pressure-
Status-Response model was constructed. Then evaluation model based on fuzzy synthetic evaluation
method was established. Finally ecosystem health condition of Yima Coal-Mining Area situated at Henan
Province during 2005 and 2013 was evaluated. Results show that ecosystem of Yima Coal-Mining Area
belongs to critically healthy grade in 2005, 2006, 2008 and 2009 and belongs to relatively unhealthy grade
during other years. There is a tendency of gradual deterioration in ecosystem of Yima Coal-Mining Area
with the exception of 2008 and 2009. The study can provide scientific guidance for the formulation of
resource and environment management decisions and sustainable development strategies of the mining area.
1 INTRODUCTION
Coal-mining area is a typical community which is
based on the development and utilization of coal
resource to promote economic and social
development of the region. Compared with general
natural ecosystem, ecosystem of coal-mining area
has its particularity. Firstly, almost all of the
activities of coal-mining area are focused on the
flow of coal resource. Therefore, ecosystem of coal-
mining area has changed the attribute of natural
ecosystem. Secondly, coal-mining area need not
only import material flow and energy flow from the
outside world but discharge wastes to the outside
world. Therefore, ecosystem of coal-mining area is
open, dependent, and non-autonomic. Thirdly,
ecosystem of coal-mining area is affected by human
activities and coal-exploiting and coal-utilizing.
Therefore, ecosystem of coal-mining area is
integrated, dynamic and non-linear. Ecosystem of
coal-mining area has the characteristics of
inevitability, irreversibility, heterogeneity,
burstiness, hysteresis and complexity. Compared
with general natural ecosystem, ecosystem of coal-
mining area is more easily to be disturbed by
changes in anthropogenic and environmental
conditions. Therefore, ecosystem of coal-mining
area is more fragile and complicated.
For a long time, coal-mining method in China is
extensive and predatory. In the course of coal
producing and processing, emissions including
waste gas, waste water and waste residue pollute
atmosphere, water, landscape and land resource
around mines seriously. Therefore, ecological
environment problem of coal-mining area is
particularly prominent. Mainly ecological problems
of coal-mining area are as follows. Firstly, air
pollution of coal-mining area is serious. Sources of
air pollution of coal-mining area mainly include gas
and coal dust produced in the course of coal mining
and transporting and harmful gases discharged by
coal gangue and industrial production and residents
around coal-miming areas. Secondly, water resource
of coal-mining area is scarce and polluted seriously.
Water resource in China is scarce and per capita
water resource accounts for only one-fourth the
world average. Water and distribution in China is
unbalanced. Water quantity of North China and
West China is less, while water quantity of South
China and East China is much. On the contrary, coal
quantity of North China and West China is much,
while water quantity of South China and East China
is less. We find that coal-rich regions are often
water-deficient areas. According to statistics, 71
percent of coal-mining areas are suffering from
water shortage, 40 percent of coal-mining areas are
486
486
Tao X. and Zhu J.
Ecosystem Health Evaluation of Yima Coal-Mining Area based on Fuzzy Synthetic Evaluation Method.
DOI: 10.5220/0006029104860491
In Proceedings of the Information Science and Management Engineering III (ISME 2015), pages 486-491
ISBN: 978-989-758-163-2
Copyright
c
2015 by SCITEPRESS – Science and Technology Publications, Lda. All rights reserved

suffering from acute water shortage, and more than
80 percent of coal workers can not drink clean
water. Water pollution around coal mining areas is
mainly caused by coal mining and harmful
substances discharged by coal gangue. Thirdly, land
resource is damaged seriously. The reason lies in
that coal-mining method under the shaft causes
ground collapse, coal-mining method in the open
damages lands, and solid wastes occupy lands.
These ecological problems have endangered the
sustainable development of coal-mining areas
seriously.
D. Rapport (1989) and D. J. Schadffer (1988)
proposed the concept of ecosystem health for the
first time in the late 1980s. Many scholars have
studied the concept of ecosystem health. D. Rapport
defined ecosystem health as the stability and
sustainability of an ecosystem, namely potential to
recover after perturbation. Costanza (1992) thought
that an ecosystem was healthy or had integrity if it
was stable and sustainable. This to say, if the
ecosystem was active and could maintain its
organization and autonomy over a period of time
and was resilient to stress while providing for human
needs, the ecosystem was healthy. Some scholars
extended the definition of ecosystem health and
advanced that a health ecosystem should has the
abilities to meet reasonable demands of human
beings and to maintain and refresh ecosystem
structure. The International Society for Ecosystem
Health defined ecosystem health as a science to
study the precautionary, diagnostic and prognostic
characters of ecosystem management and the
relation between ecosystem health and human
health. Presently viewpoint of Constanza has been
widely accepted by the scientific community. The
concept of ecosystem health proposed by Constanza
includes inner stability, free of disease, diversity or
complexity, vigor, resilience and the balance among
the elements.
A series of methods to assess ecosystem health
have appeared, such as principle component analysis
method, analytic hierarchy process method, foot
print method, fuzzy comprehensive evaluation
method, neural network method, landscape
ecological structure method, etc. These assessment
methods have different characters and apply to
different situations. Therefore, the adoption of
evaluation method depends on actual situations. As a
mathematical method to deal with the fuzzy
phenomena, fuzzy synthetic evaluation method
describes the objects in quantity according to their
attributes of “both A and B”. Ecosystem of coal-
mining area is also fuzzy, because the borderline
between health or sickness of the ecosystem is
ambiguous. A more reasonable answer is that the
ecosystem has some healthy elements as well as
unhealthy ones, which means that the evaluation of
the ecosystem health is a fuzzy aggregation.
Consequently, evaluation model of ecosystem health
based on fuzzy mathematics is more coincident with
actual conditions. In addition, most of the studies
aim at city, forest and watershed. Systematic studies
on ecosystem health evaluation of coal-mining area
are less. We set up an evaluation index system of
ecosystem health of coal-mining area based on
Pressure-Status-Response model, establish an
evaluation model based on fuzzy synthetic
evaluation method, and take Yima Coal-Mining
Area as an example to carry out the analysis. The
aim is to provide scientific guidance for the
formulation of resource and environment
management decisions and regional sustainable
development strategies of the area.
2 RESEARCH METHOD
2.1 Construction of Evaluation Index
System
Evaluation index system of ecosystem health of
coal-mining area in this paper is based on PSR
model proposed by David J. Rapport in 1979. The
model is composed of pressure, status and response.
Pressure represents the effect on environment
around coal-mining areas caused by economic and
social activities. Status represents environmental
conditions and changes within a certain period of
time. Response represents countermeasures taken by
individuals and management departments to
alleviate negative effect on environment and even
better ecological environment of coal-mining areas
as far as possible. Considering the realities of Yima
Coal-Mining Area, following the principles of
scientificity, measurability, availability,
comprehensiveness and comparability and referring
to concerned research findings, we set up an
evaluation index system of ecosystem health of coal-
mining area. The evaluation index system is
composed of four layers. The first layer is goal layer,
namely ecosystem health exponent of coal-mining
area. The second layer is system layer, the third
layer is element layer, and the fourth layer is index
layer containing 37 indexes. Evaluation index
system of coal-mining area is shown in Table 1.
Ecosystem Health Evaluation of Yima Coal-Mining Area based on Fuzzy Synthetic Evaluation Method
487
Ecosystem Health Evaluation of Yima Coal-Mining Area based on Fuzzy Synthetic Evaluation Method
487
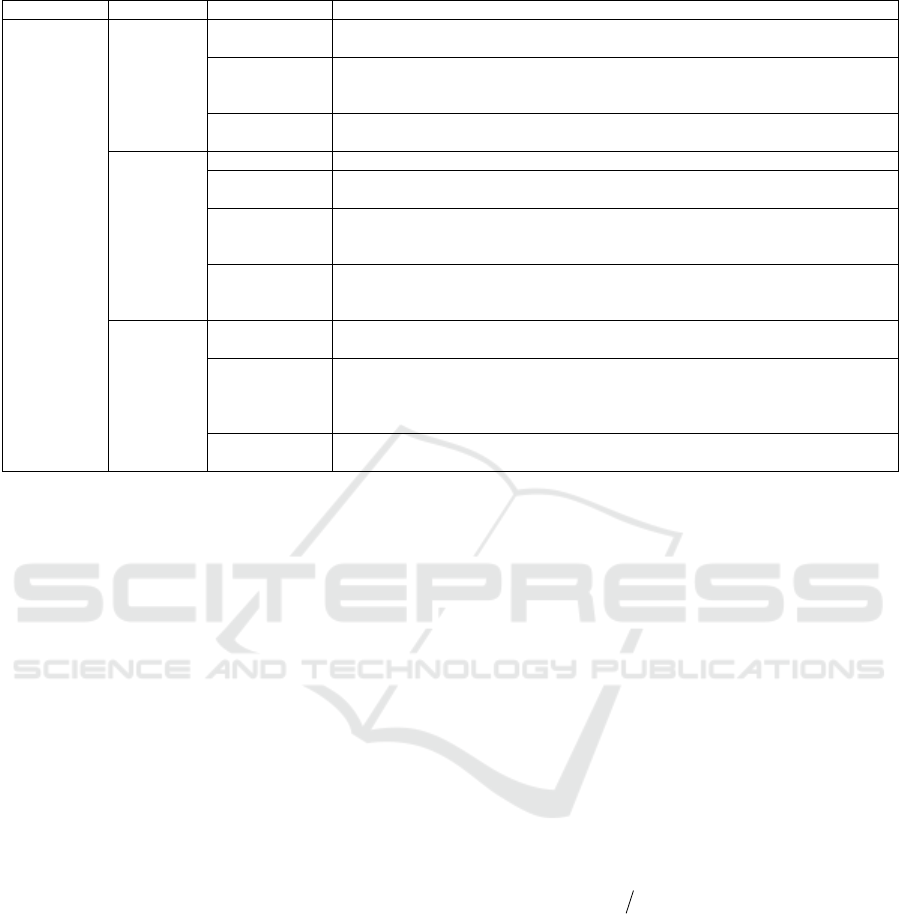
Table 1: Evaluation index system of ecosystem health of coal-mining area.
Goal layer System layer Element layer Index layer
Ecosystem
health
exponent of
coal-mining
area
Pressure
Resource
pressure
Per capita cultivated area (I
1
), average soil erosion exponent (I
2
), per capita water
amount (I
3
), consumption rate of coal reserves (I
4
)
Environment
pressure
Emission intensity of industrial fumes per 10000 RMB of GDP (I
5
), COD emission
intensity per 10000 RMB of GDP (I
6
), emission intensity of solid wastes per
10000RMB of GDP GDP (I
7
), proportion of goaf area to coal-mining area (I
8
)
Social pressure
Natural growth rate of population (I
9
), registered unemployment rate (I
10
), Engel
coefficient of residents (I
11
)
Status
Economic status Per capita GDP (I
12
), proportion of tertiary occupation in GDP (I
13
)
Energy status
Consumption proportion of raw coal (I
14
), energy consumption per 10000 RMB of
GDP (I
15
), water consumption10000 RMB of GDP (I
16
)
Resource status
Biological abundance exponent (I
17
), forest coverage rate (I
18
), greenery coverage
rate (I
19
), per capita public green area (I
20
), soil organic matter content (I
21
),
proportion of soil erosion area to coal-mining area (I
22
)
Environment
status
Air pollution exponent (I
23
), compliance rate of drinking water (I
24
), regional
environment mush (I
25
), annual average of inhalable particles concentration (I
26
),
acid rain rate (I
27
), natural disaster exponent (I
28
)
Response
Economic
response
Proportion of environmental investment in GDP (I
29
), proportion of educational
investment in GDP (I
30
)
Environment
response
Compliance rate of industrial waste water emission (I
31
), recycle rate of industrial
water (I
32
), comprehensive utilization ratio of industrial solid wastes (I
33
),
comprehensive utilization of coal gangue (I
34
), reclamation rate of subsidence land
(I
35
)
Social response
Average life expectancy (I
36
), persons of higher academic degree per 10000 people
(I
37
)
We divide ecosystem health level of coal-mining
area into five grades, namely unhealthy grade,
relatively unhealthy grade, critically healthy grade,
relatively healthy grade and healthy grade. Then we
determine critical values of evaluation indexes
corresponding to the five grades, which is a key
point in ecosystem health evaluation. We consult the
suggested value of ecological city and environment
protection model city commonly recognized as
critical value of healthy grade and the international
or national minimum value as critical value of
unhealthy grade. By consulting concerned
environmental protection experts, we determine
critical values of other grades. Critical values of
evaluation indexes corresponding to the five grades
are shown in Table 2.
2.2 Setup of Evaluation Set
Based on evaluation evaluation indexes and objects,
we set up the index set X=(x
1
, x
2
, …, x
n
) and
assessment set V=(v
1
, v
2
, …, v
5
), where v
1
, v
2
, …, v
5
represent unhealthy grade, relatively unhealthy grade,
critically healthy grade, relatively healthy grade and
healthy grade respectively.
2.3 Setup of Relatively Membership
Degree Matrix
Relatively membership degree is used to compare
the advantages and disadvantages of different things
and its formula is different for a positive index (the
bigger the index value, the more healthy the
ecosystem) and a negative index (the bigger the
index value, the more unhealthy the ecosystem) .
Firstly, calculation formula of relatively
membership degree of a positive index is as follows
(s
i,j
denotes critical value of the ith index
corresponding the yth health grade, i=1,2,...,n;
j=1,2,...,5).
If actual value of x
i
is less than unhealthy grade,
membership degree corresponding to unhealthy
grade is 1 and membership degrees corresponding to
other grades are 0. This means that if x
i
<s
i,j
,
0,1
54321
iiiii
rrrrr
(1)
If s
i,j≤
x
i≤
s
i,j+1
,
1,,,1,,1,
1,
jijijijijiiji
rrsssxr
(2)
If actual value of x
i
is greater than healthy grade,
membership degree corresponding to healthy grade
is 1 and membership degrees corresponding to other
grades are 0. This means that if x
i
>s
i,j
,
0,1
43215
iiiii
rrrrr
(3)
Secondly, calculation formula of a negative index is
similar to the above.
If x
i
>s
i,j
,
0,1
54321
iiiii
rrrrr
(4)
ISME 2015 - Information Science and Management Engineering III
488
ISME 2015 - International Conference on Information System and Management Engineering
488

Table 2: Classification standard of indexes.
Index layer Unit Unhealthy grade Relatively unhealthy grade Critically healthy grade Relatively healthy grade Healthy grade
I
1
hm
2
0.02 0.03 0.05 0.08 0.1
I
2
t/km
2
·a 5000 4000 3000 2000 1000
I
3
m
3
1000 3000 5000 7000 9000
I
4
% 70 60 45 30 25
I
5
kg 2 1.5 0.75 0.3 0.1
I
6
kg 6 5 3 2.25 1.5
I
7
kg 300 250 150 75 50
I
8
% 50 40 30 20 10
I
9
‰ 11.2 9.6 8 5 4
I
10
% 4.2 3.6 3 2.5 1.2
I
11
% 50 40 35 30 25
I
12
10
4
RMB 0.7 3 5 10 20
I
13
% 30 40 50 60 80
I
14
% 55 47.5 35 25 20
I
15
tce 1.5 1.25 0.75 0.3 0.1
I
16
m
3
300 225 175 75 50
I
17
-
25 35 55 75 80
I
18
% 30 35 40 45 50
I
19
% 20 25 30 40 50
I
20
m
2
7 10 12 16 18
I
21
% 0.7 1.5 3 4 5
I
22
% 15 12.5 8 4 2
I
23
-
3 2.5 1.6 0.9 0.6
I
24
% 80 85 92.5 97.5 100
I
25
db(A) 60 57.5 52.5 47.5 45
I
26
mg/m
3
0.15 0.12 0.10 0.06 0.04
I
27
% 30 25 10 5 0
I
28
-
0.8 0.6 0.4 0.2 0.1
I
29
% 1 1.5 2 3 5
I
30
% 1 1.5 2 3 5
I
31
% 80 85 92.5 97.5 100
I
32
% 20 30 50 70 80
I
33
% 30 50 70 90 100
I
34
% 40 60 70 80 90
I
35
% 10 20 35 50 70
I
36
Year 65 68 73 76 78
I
37
Person 300 450 650 1000 1200
If s
i,j+1≤
x
i≤
s
i,j
,
1,,1,,,1,
1,
jijijijiijiji
rrssxsr
(5)
If x
i
<s
i,j
,
0,1
43215
iiiii
rrrrr
(6)
Then we obtain a relatively membership degree
matrix:
nmnn
m
m
h
rrr
rrr
rrr
R
21
22221
11211
(7)
Where r
ij
is the relatively membership degree of x
i
in
X responding to the yth grade in V,
1
21
imii
rrr (i=1,2,...,n; j=1,2,...,5).
2.4 Calculation of Indexes Weights
Methods to give indexes weights involve subjective
and objective methods. The methods of the two
category have their advantages and disadvantages.
Objective methods don’t consider the subjective
intention of decision makers, while subjective
methods are influenced by the subjective intention of
decision makers to a large extent. Combining the
two methods can make up their respective
disadvantages. We use entropy method and AHP
method to give indexes weights.
Steps of entropy method are as follows:
The first step is to establish original data matrix
X=(x
ij
)
n×m
(n is number of evaluation objects and m is
number of evaluation indexes). To alleviate the non-
metrizability of indexes caused by different
dimensions and units, the indexes must be non-
dimensional-normalized. The formula of non-
Ecosystem Health Evaluation of Yima Coal-Mining Area based on Fuzzy Synthetic Evaluation Method
489
Ecosystem Health Evaluation of Yima Coal-Mining Area based on Fuzzy Synthetic Evaluation Method
489

dimension-normalization is:
jjijij
xxx
'
(8)
Where
'
ij
x
is value of
ij
x
after non-dimension-
normalization,
j
x
is mean value of the jth indexes,
j
is standard deviation of the jth indexes.
The second step is to shift the axis in parallel to
alleviate the negative values. The equation is:
'''
ijij
xHx
(9)
Where
''
ij
x
is the value of
'
ij
x
after shift,
H
is the
range of shift of axis.
The third step is to calculate the proportion of
''
ij
x
according to the following formula:
m
i
ijijij
xxR
1
''''
(10)
The fourth step is to calculate entropy value of the
jth indexes:
sRRe
s
i
ijijj
lnln
1
(11)
The fifth step is to calculate otherness coefficient of
the jth indexes:
jj
eg 1
(12)
The sixth step is to calculate the weighting of x
j
:
n
j
jj
n
j
jjj
eeggw
11
11
(13)
According to the above steps, we obtain the set of
indexes weights:W
i
1
(W
1
,W
2
, …,W
n
).
Because of space constraints, we don’t elaborate
the steps of AHP method. According to AHP method,
we obtain the set of indexes weights: W
i
2
(W
1
,W
2
,
…,W
n
).
Calculating the mean of W
i
1
(W
1
,W
2
, …,W
n
) and
W
i
2
(W
1
,W
2
, …,W
n
), we obtain the final set of indexes
weights: W
i
(W
1
,W
2
, …,W
n
).
2.5 Evaluation Model of Ecosystem
Health of Coal-Mining Area
Evaluation model of ecosystem health of coal-
mining area based on fuzzy mathematics is:
54321
21
22221
11211
21
,,,,
,,,
HHHHH
rrr
rrr
rrr
wwwRWH
nmnn
m
m
nhi
(14)
H
1
, H
2
, H
3
, H
4
, H
5
represent membership degrees of
ecosystem of coal-mining area corresponding to the
five grades respectively, W
i
is the set of indexes
weights. According to maximum membership
principle, we judge the grade of ecosystem of the
coal-mining area.
3 CASE STUDY
Yima Coal-Mining Area is located at the juncture of
Henan, Shanxi and Shaanxi Provinces. Yima Coal-
Mining Area is rich in coal resource and has become
an important energy base of China. During recent
years, environmental problems have endangered the
sustainable development of the area. Therefore, it is
necessary to evaluate ecosystem health condition of
Yima Coal-Mining Area. Coal fields of Yima Coal-
Mining Area are distributed in Henan, Shanxi
Province and Xinjiang Provinces. Taking Henan
Province as an example, coal fields cover Yima City,
Mianchi County, Shan County and Sanmenxia City.
The distribution of coal fields around Yima Coal-
Mining Area is widely dispersed. Therefore, it is
very difficult to evaluate ecosystem conditions of all
coal fields. We only take Changcun Mine and
Qianqiu Mine situated at Yima City into account.
Result is shown in Table 3.
According to maximum membership principle,
we find that ecosystem of Yima Coal-Mining Area
belongs to critically healthy grade in 2005, 2006,
2008 and 2009 (membership degree corresponding
to critically healthy grade is 0.2924, 0.2756, 0.2884
and 0.2916 respectively) and belongs to relatively
unhealthy grade in other years (membership degree
corresponding to relatively unhealthy grade is
0.3182, 0.3364, 0.3508, 0.3628 and 0.3811
respectively). Results show that there is a tendency
of gradual deterioration in ecosystem of Yima Coal-
Mining Area during 2005 and 2013 with the`
exception of 2008 and 2009. In addition, we find that
membership degrees corresponding to relatively
healthy grade and healthy grade show a tendency of
gradual decrease, while membership degree
corresponding to unhealthy grade shows a tendency
of gradual increase.
4 CONCLUSIONS
The paper sets up an ecosystem health evaluation
index system of coal-mining area and evaluates
ecosystem health condition of Yima Coal-Mining
ISME 2015 - Information Science and Management Engineering III
490
ISME 2015 - International Conference on Information System and Management Engineering
490
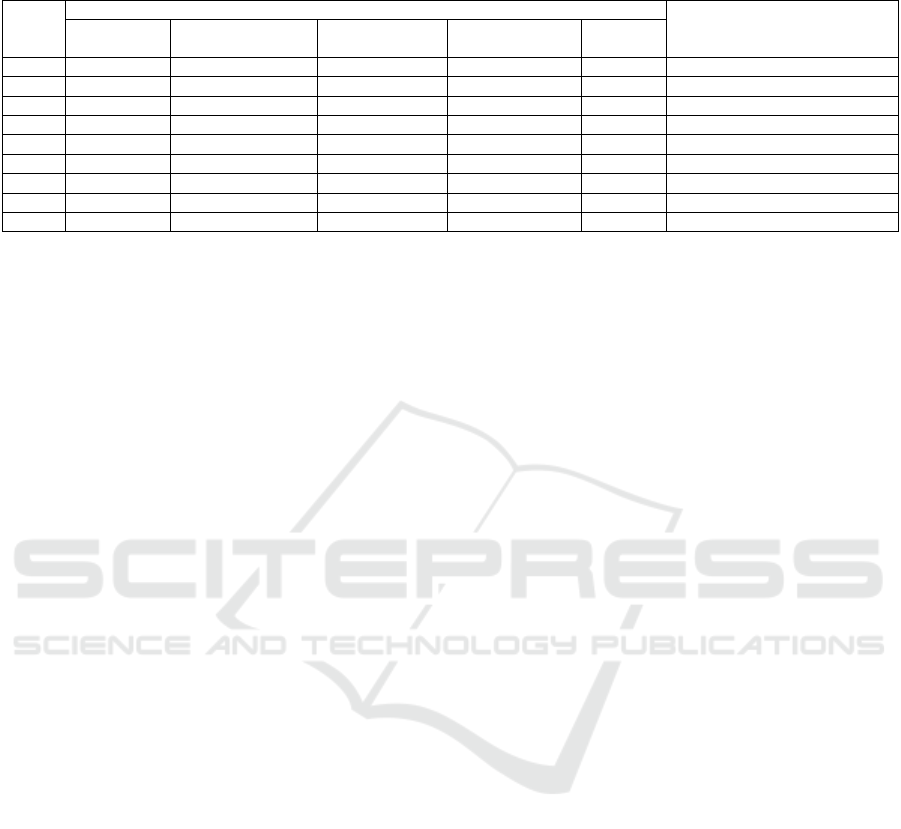
Table 3: Result of ecosystem health evaluation of Yima coal-mining area.
Year
Membership degrees corresponding to each grade
Grade
Unhealthy
grade
Relatively unhealthy
grade
Critically healthy
grade
Relatively healthy
grade
Healthy
grade
2005 0.1234 0.2526 0.2924 0.2247 0.1069 Critically healthy grade
2006 0.1686 0.2631 0.2765 0.2029 0.0889 Critically healthy grade
2007 0.1918 0.3182 0.2445 0.1739 0.0716 Relatively unhealthy grade
2008 0.1817 0.2657 0.2884 0.1704 0.0938 Critically healthy grade
2009 0.1732 0.2895 0.2916 0.1372 0.1085 Critically healthy grade
2010 0.2207 0.3364 0.2081 0.1523 0.0825 Relatively unhealthy grade
2011 0.2624 0.3508 0.1857 0.1303 0.0708 Relatively unhealthy grade
2012 0.2914 0.3628 0.1543 0.1174 0.0741 Relatively unhealthy grade
2013 0.3121 0.3811 0.1338 0.1021 0.0709 Relatively unhealthy grade
Area from 2005 to 2013 based on fuzzy synthetic
evaluation method. Evaluation results conform to
actual situations and can provide references for
ecological safety management of the area.
ACKNOWLEDGEMENTS
This work was supported in part by National Natural
Science Foundation of China (No. 71103213),
National Natural Science Foundation of China (No.
U1204709), Planning Foundation Project of Human
Social Science Project of Ministry of Education of
China (No. 14YJA630060), Foundation for Young
Key Teacher by Henan Province (No. 2013GGJS-
119), Philosophy and Social Science Planning
Project of Henan Province (No. 2015BJJ062), Soft
Science Project of Henan Province (No.
152400410605).
REFERENCES
Wang, G. C., Li, P. F., 2014. Study on the integrated
ecosystem in coal mining area and its coupling
mechanism. In Ecological Economy (in Chinese).
Rapport, D. J., 1981. What constitutes ecosystem health?.
In Perspectives Biology and Medicine.
Schaeffer, D. J., Henricks, E. E., Kerster, H. W., 1988.
Ecosystem health: measuring ecosystem health. In
Journal of Environment Management.
Costanza, R., Norton, B. G., Haskell, B. D., 1992.
Ecosystem health: new goal for environmental
management, Island Press. Washington D. C., 1
st
edition.
Gao, C. B., Chen, X. G., Wei, Z. H., Peng, X. C., 2006.
Application of entropy weight and fuzzy synthetic
evaluation in urban ecological security assessment. In
Chinese Journal of Applied Ecology (in Chinese).
Cheng, J. H., Chen, J., Yi, X. H., 2013. Research on
evaluation indicators system of ecological civilization
in mining China. In China Population, Resources and
Environment (in Chinese).
Wang, G. C., Yan, X. Q., 2005. Study on indicator system
of ecosystem health assessment in a typical mine area.
In Journal of China Coal Society (in Chinese).
Zou, C. X., 2011. Research on evaluation index system of
mine ecological environment quality. In China Mining
Magazine (in Chinese).
Jerry, M. S., Mariano, B., Annalee, Y., 2001. Developing
ecosystem health indicators in Centro Habana: a
community-based approach. In Ecosystem Health.
Zhou, W. H., Wang, R. S., 2005. An entropy weight
approach on the fuzzy synthetic assessment of Beijing
urban ecosystem health. In Acta Ecological Sinica (in
Chinese).
Qian, Y., Wang, L., Chen, J. F., 2008. Fuzzy
comprehensive evaluation of urban ecosystem health
in Urumqi. In Research on Soil and Water
Conservation (in Chinese).
Qin, Q., Dai, W., Yang, Q., 2014. Security evaluation on
ecological system of city based on entropy weight and
fuzzy synthetic evaluation. In Journal of Northwest
Normal University (Natural Science) (in Chinese).
Ecosystem Health Evaluation of Yima Coal-Mining Area based on Fuzzy Synthetic Evaluation Method
491
Ecosystem Health Evaluation of Yima Coal-Mining Area based on Fuzzy Synthetic Evaluation Method
491
