Information Sharing Performance Management
A Semantic Interoperability Assessment in the Maritime Surveillance Domain
Fernando S. Bryton Dias Marques
1,2
, Jesús E. Martínez Marín
1
and Olga Delgado Ortega
3
1
Department Nautical Sciences & Engineering, Universitat Politècnica de Catalunya,
Pla de Palau 18, 08003, Barcelona, Spain
2
Portuguese Navy Research Center (CINAV), Escola Naval, Base Naval de Lisboa, Alfeite, 2810-001 Almada, Portugal
3
Universidade Lusófona de Humanidades e Tecnologias, Campo Grande, 376, 1749-024 Lisboa, Portugal
Keywords: Information Sharing, Performance Management, Semantic Interoperability, Indicators, Maritime
Surveillance.
Abstract: Information Sharing (IS) is essential for organizations to obtain information in a cost-effective way. If the
existing information is not shared among the organizations that hold it, the alternative is to develop the
necessary capabilities to acquire, store, process and manage it, which will lead to duplicated costs, especially
unwanted if governmental organizations are concerned. The European Commission has elected IS among
public administrations as a priority, has launched several IS initiatives, such as the EUCISE2020 project
within the roadmap for developing the maritime Common Information Sharing Environment (CISE), and has
defined the levels of interoperability essential for IS, which entail Semantic Interoperability (SI). An open
question is how can IS performance be managed? Specifically, how can IS as-is, and to-be states and targets
be defined, and how can organizations progress be monitored and controlled? In this paper, we propose 11
indicators for assessing SI that contribute to answering these questions. They have been demonstrated and
evaluated with the data collected through a questionnaire, based on the CISE information model proposed
during the CoopP project, which was answered by five public authorities that require maritime surveillance
information and are committed to share information with each other.
1 INTRODUCTION
Information Sharing (IS), through integration of
information systems, is becoming widely adopted by
the European public sector as a promising practice for
enhancing cost-effectiveness in several domains with
high societal impact such as security or health.
Recent studies (ICF International, 2014;
European Network and Information Security Agency,
2009) have shown information gaps in public
authorities hindering their decision making and
action. They have also shown that, often, information
missing in some authorities is already being collected
and available at other authorities. Therefore, if such
information would be shared, an increase in
effectiveness could be expected, since decisions and
actions would be more informed.
Recent studies have also shown that significant
benefits could be expected from IS. For example, in
the maritime domain, 400 million euros per year
(Finnish Border Guard, 2014) is the estimated benefit
of IS among the over 300 European public authorities
presently involved in maritime surveillance (MS)
(ICF International, 2014).
IS implies processing information from and to
external sources, in a meaningful manner, i.e.
Semantic Interoperability (SI), one of the four
interoperability levels comprised by the European
Interoperability Framework (EIF) (European
Commission, 2004), which Europe is committed to
enhance as per its European Interoperability Strategy
(EIS) for European public services (European
Commission, 2010a).
IS is also a priority for Europe, according to
strategic documents such as the EU Maritime
Security Strategy (EUMSS) (Council of the European
Union, 2014) or the eHealth Action Plan 2012-2020
(European Commission, 2012).
By providing the means to assess SI, this research
aims to contribute for its management and,
consequently, of IS, hence fostering its development.
This paper is organized as follows: in section 2 a
382
Marques, F., Marín, J. and Ortega, O..
Information Sharing Performance Management - A Semantic Interoperability Assessment in the Maritime Surveillance Domain.
In Proceedings of the 7th International Joint Conference on Knowledge Discovery, Knowledge Engineering and Knowledge Management (IC3K 2015) - Volume 3: KMIS, pages 382-393
ISBN: 978-989-758-158-8
Copyright
c
2015 by SCITEPRESS – Science and Technology Publications, Lda. All rights reserved
literature review is presented, followed by a
conceptual framework, described in section 3, which
will be the grounds for defining the SI indicators in
section 4 and for validating them in section 5. The
conclusions are then presented in section 6.
2 LITERATURE REVIEW
Assessing SI is a challenge, since it involves the
heterogeneous, complex and rapid changing
environments of organizations and their information
systems. Presently, the ways proposed to conduct
such assessments do not seem to be used in practice
and the Interoperability Maturity Model (IMM)
(European Commission, 2014) addresses the
interoperability assessment of public services from a
too high level of abstraction.
Feng et al., (2004) used a modified feature-based
approach to measure semantic similarity between
categories in different land use/land cover
classification systems and demonstrate it with a case
study with real world data.
Paul et al., (2008) discuss an approach for
semantic similarity assessment of geospatial services
in the context of a proposal for a methodology for
interoperable access of geospatial in-formation based
on Open Geospatial Consortium (OGC) specified
standards.
Guédria et al., (2008) review the main maturity
models that are or could be used for interoperability
measure, comparing their different aspects in order to
evaluate their relevance and coverage with respect to
enterprise interoperability.
Later, Guédria et al., (2009) proposed a maturity
model for enterprise interoperability which is
elaborated on the basis of existing ones, consistent to
the Enterprise Interoperability Framework and using
metrics for determining maturity levels.
Dolin et al., (2011) proposed a framework for
measuring semantic interoperability using a
technique called the ‘Single Logical Information
Model’ framework, which relies on an operational
definition of semantic interoperability and an
understanding that interoperability improves
incrementally.
Yahia et al., (2012) address the evaluation of the
lack of interoperability between Cooperative
Information Systems (CIS) through the measurement
of their semantic gaps. They have proposed a
mathematical formalization of the semantic
relationships between CIS conceptual models and
analysed the resulting formal model for evaluating the
lack of interoperability implications to the global
information systems shared goals. The proposed
approach was illustrated through a case study dealing
with a B2M (Business to Manufacturing)
interoperability requirement between an Enterprise
Resource Planning (ERP) system and a
Manufacturing Execution System (MES) application.
Finally, Rezaei et al., (2013) performed a
comparative analysis among interoperability
assessment models to evaluate the similarities and
differences in their philosophy and implementation.
The analysis yielded a set of recommendations for
any party that is open to the idea of creating or
improving an interoperability assessment model.
In this context, this research entails the
development and validation of a set of indicators for
assessing SI, which are expected to contribute in a
very concrete way for SI management and,
consequently, to the management of IS. As such, the
research question being addressed is:
How can Semantic Interoperability be assessed?
3 CONCEPTUAL FRAMEWORK
We have tackled the research question based on the
following SI interoperability conceptualization and
methodology.
3.1 Semantic Interoperability
SI (European Commission, 2004) enables
organizations to process information from external
sources in a meaningful manner. It ensures that the
precise meaning of the exchanged information is
understood and preserved throughout exchanges
between parties. It is about the meaning of the data
elements and the relationships between them. It
includes developing vocabulary to describe the data
exchanges and ensures that data elements are
understood in the same way by communicating
parties. Therefore, SI is: 1) Indispensable to the IS
capability; 2) Achievable (hence can be evaluated)
without exchanging information.
The main purpose of an Information Model (IM)
(Pras and Schoenwaelder, 2003) is to model managed
objects at a conceptual level, independent of any
specific implementations. Data Models (DM) (Pras
and Schoenwaelder, 2003), on the other hand, are
defined at a lower level of abstraction, include many
details, and are intended for implementers. Multiple
DMs can be derived from a single IM. Considering
that the vocabulary needed by SI to describe the data
exchanges can be an IM, SI requires: 1) Participants
Information Sharing Performance Management - A Semantic Interoperability Assessment in the Maritime Surveillance Domain
383
information models (IMs); 2) A common information
model (CIM) for describing the information
exchanges between the participants; 3) Mappings,
between the CIM and the IMs, establishing their
conceptual relationships; and 4) Definitions of the
transformations between the IMs and the CIM, which
preserve the meaning of the information.
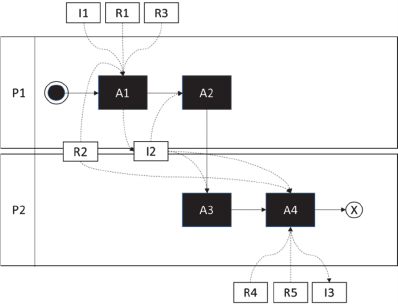
Figure 1: Information Sharing high-level process.
The role of SI can be observed in the IS high-level
process depicted in fig. 1, where to accomplish an
exchange of information between two participants,
the information provider (P1) and the information
consumer (P2), several activities (A1 to A4) are
performed and several resources (R1 to R5) are
involved, producing semantically equivalent
information (I1 to I3), as follows:
A1: P1 translates the information to share (I1) from
its IM (R1) into the CIM (R2), according to the
mappings and transformations (R3) defined
between R1 and R2, producing I2;
A2: P1 sends the information (I2) to P2;
A3: P2 receives the information (I2) from P1;
A4: P2 translates the information received (I2) from
the CIM (R2) into its own IM (R4), according to
the mappings and transformations (R5) defined
between R2 and R4, producing I3.
Upon completion, P2 will process the received
information as adequate, and the precise meaning of
I1 is exactly the same of I3, for P1 and P2; otherwise,
the information exchange did not succeed.
3.2 Methodology
On one hand, indicators are a suitable tool for
assessing SI, since they are the qualitative and/or
quantitative information on an examined
phenomenon which enables the analysis of its
evolution, checking if quality targets are met, driving
actions and decisions (UNI 11097, 2013).
On the other hand, Design Science Research
(DSR) is a suitable research paradigm for developing
indicators, since in DSR a designer answers questions
relevant to human problems via the creation of
innovative artifacts, thereby contributing new
knowledge to the body of scientific evidence, where
the designed artifacts are both useful and fundamental
in understanding that problem (Hevner, 2010).
Moreover, these artifacts are demonstrated to
improve manager’s capability to “change existing
situations into preferred ones” (Simon, 1996).
Consequently, we have used DSR, by following
its methodology (Peffer et al., 2007), which
comprises the following activities: 1) Problem
identification and motivation; 2) Solution objectives
definition; 3) Design and development; 4)
Demonstration; 5) Evaluation and 6)
Communication.
To design and develop the proposed indicators,
we have used a specific methodology (Franceschini
et al., 2007) for defining and testing process
performance indicators, based on the IS high-level
process earlier defined, which comprises the
following activities: 1) Process identification; 2)
Identification of the representation-targets; 3)
Representation-targets analysis and testing; 4)
Indicators definition and 5) Indicators testing.
DSR foresees several ways to validate the artifacts
developed (Dresch et al., 2015) from which we have
chosen the Observational form, which primary goal is
to determine how the artifact behaves in a
comprehensive manner and in a real environment
(Hevner et al. 2004) since, according to Tremblay et
al., research that is based on DSR cannot only focus
on the development of the artifact and should
demonstrate that the artifact can be effectively used
to solve real problems (Tremblay et al. 2010).
Consequently, to demonstrate and evaluate the
proposed indicators, we have assessed the SI of 5
public authorities that require MS information and are
committed to exchange information with each other.
The data, which was analysed qualitatively and
quantitatively, was collected through a questionnaire,
based on the CIM used for this research, which was a
simplified version of the IM for the European
Maritime Common Information Sharing
Environment (CISE) (European Commission, 2010b)
developed during the CoopP project (Finnish Border
Guard, 2014), entailing 45 information entities and
216 information attributes. The questionnaire was
filled in by the experts (organizational and
technological) appointed, by each of the
ISE 2015 - Special Session on Information Sharing Environments to Foster Cross-Sectorial and Cross-Border Collaboration between Public
Authorities
384

organizations involved, for enhancing their
interoperability and IS.
4 INDICATORS
Indicators (Franceschini et al., 2007) are tools to
understand, manage, and improve organizations
activities, allowing to understand, among other, how
well we are doing, if goals are being met, as well as if
and where process improvements are necessary.
Therefore, the proposed indicators must fulfil the
following objectives: 1) Contribute to characterize
the present SI situation; 2) Contribute to define the
preferred SI situation; 3) Contribute to define possible
lines of action and 4) Contribute to monitor and
control SI progress.
4.1 Process Identification
Our indicators are defined based on the IS process
earlier described. Particularly, we shall use the SI
dimension of IS for this effect. Other dimensions such
as the legal, organizational and technical could have
been used to define performance indicators for IS;
however, that is presently out of the scope of this
research.
4.2 Representation-targets
A representation-target (Franceschini et al., 2007) is
the operation aimed to make a context, or parts of it,
“tangible” in order to perform evaluations, make
comparisons, formulate predictions or take decisions.
According to the methodology, they must be
identified for each of the process dimensions selected,
which we have done for SI, as follows:
Information Available. Information held by the
participants in the IS process (synonym of
information that could be provided).
Information Required. Information needed by the
participants in the IS process.
Information that should be Provided. Information
available by a participant which is required by one
or more participants.
Mapped Information that should be Provided.
Information that should be provided by a participant
which has already mapped and defined the necessary
transformations from its IMs into the CIM.
Information that could be Consumed. Information
that is available by all participants for a participant to
consume.
Information that should be Consumed.
Information that could be consumed and is required
by a participant.
Mapped information that should be Consumed.
Information that should be consumed by a participant
which has already mapped and defined the necessary
transformations from the CIM into its IMs.
Information Mapping Performance. Participants
performance regarding the mappings and the
definition of the transformations required to consume
and provide information via a CIM.
Table 1: Accessory properties.
a - long term
goals
a1 - the IS should be effective
a2 - the IS should be efficient
b - impact on
stakeholders
b1 - any party involved in the IS should
be able to obtain all the information
required
Indicators have to be consistent with IS strategic
objectives, which is achieved if they fulfil the
Accessory Properties (Franceschini et al., 2007). The
first property is Long Term Goals, by which
indicators should encourage the achievement of
process long term goals, therefore representation-
targets should concern process dimensions which are
strictly linked to these goals (Franceschini et al.,
2007). The second property, Impact on Stakeholders,
implies that the impact of each indicator on process
stakeholders is carefully analysed. Therefore, it is
important to identify process aspects with a strong
impact on customer satisfaction (Franceschini et al.,
2007).
To test the representation-targets we have refined
the accessory properties as presented in table 1, and
concluded that all the representation-targets defined
are consistent with the IS strategic objectives.
4.3 Indicators Definition
In order to define our indicators for SI, we must first
define the following core concepts.
Name Participants (P)
Informal
definition
Set comprising the organizations which
participate in the information sharing initiative
Formal
definition
P = {p
1
, p
2
, p
3
, ..., p
n
}
Name CIM information attributes (A
CIM
)
Informal
definition
Set comprising all the CIM information
attributes
Formal
definition
A
CIM
= {a
1
, a
2
, a
3
, …, a
n
}
Information Sharing Performance Management - A Semantic Interoperability Assessment in the Maritime Surveillance Domain
385
Name CIM information attributes available (AA)
Informal
definition
Set comprising all the CIM information
attributes available by a participant (in one or
more of its systems)
Formal
definition
p P,
AA
p
A
CIM
Name CIM information attributes required (AR)
Informal
definition
Set comprising all the CIM information
attributes required by a participant (to feed one
or more of its systems)
Formal
definition
p P,
AR
p
A
CIM
Name
CIM information attributes mapped by a
participant (AM)
Informal
definition
Set comprising all the CIM information
attributes mapped by a participant into any of
the information attributes comprised by its
systems (either for consumption or
provisioning)
Formal
definition
p P,
AM
p
A
CIM
| AM
p
| | AA
p
|
| AM
p
| | AR
p
|
Name
Systems with information represented by the
CIM (S)
Informal
definition
Set of the participant’s systems comprising
information represented by the CIM (such
information is most probably modelled
differently)
Formal
definition
p P,
S
p
= {s
1
, s
2
, s
3
, …, s
n
}
Name System information attributes (A
s
)
Informal
definition
Set comprising a participant’s system
information attributes which are also
represented at the CIM
Formal
definition
s S,
A
s
= {a
1
, a
2
, a
3
, …, a
n
}
Name
Systems’ information attributes available
(SAA)
Informal
definition
Set comprising all information attributes from the
participant’s systems which are represented in the
CIM (differs from AA in the sense that here the
participant’s systems are considered)
Formal
definition
Name Systems’ information attributes required (SAR)
Informal
definition
Set comprising all information attributes from the
participant’s systems which are represented in the
CIM and required by the participant (differs from
SAA in the sense that some information attributes
available may not be required by the participant)
Formal
definition
Name Systems’ information attributes mapped (SAM)
Informal
definition
Set comprising all information attributes from the
participant’s systems which are mapped into its
CIM equivalents
Formal
definition
Name
Transformation of system information
attributes (f
a
)
Informal
definition
Transforms participants’ systems information
attributes into CIM information attributes
Formal
definition
Name
Transformation of CIM information attributes
(g
a
)
Informal
definition
Transforms CIM information attributes into
participants’ systems information attributes
(retraction of f
a
)
Formal
definition
Name
Systems’ information attributes that should be
provided (SASP)
Informal
definition
Set comprising all information attributes from
the participant’s systems which are represented
in the CIM and are required by other
participants
Formal
definition
Name
Systems’ mapped information attributes that
should be provided (SMASP)
Informal
definition
Set comprising all information attributes from
the participant’s systems which are mapped into
its CIM equivalents are required by other
participants
Formal
definition
Name
Systems’ information attributes that could be
consumed (SACC)
Informal
definition
Set comprising all information attributes
available from all participants’ systems, except
the participant under analysis.
Formal
definition
Name
Systems’ information attributes that should be
consumed (SASC)
Informal
definition
Set comprising all information attributes that
could be consumed and are required by a
participant
Formal
definition
ISE 2015 - Special Session on Information Sharing Environments to Foster Cross-Sectorial and Cross-Border Collaboration between Public
Authorities
386

Name
Systems’ mapped information attributes that
should be consumed (SMASC)
Informal
definition
Set comprising all information attributes
mapped by a participant that should be
consumed
Formal
definition
Based on these core concepts we have defined the
following 9 basic (obtained from a direct observation
of the system) and 2 derived indicators (obtained
combining the information of one or more indicators)
(Franceschini et al., 2007) which are consistent with
each own representation-target.
Information Available
Indicator
name
CIM information attributes available (I
AA
)
Informal
definition
Number of CIM information attributes available
at a participant’s systems
Formal
definition
p P,
I
AA
p
= | AA
p
|
Range
Գ
0
Scale Ratio
Indicator
name
Systems’ information attributes available (I
SAA
)
Informal
definition
Number of CIM information attributes from a
participant’s systems, which are represented at
the CIM
Formal
definition
p P,
I
SAA
p
= | SAA
p
|
Range
Գ
0
Scale Ratio
Information Required
Indicator
name
Information attributes required (I
AR
)
Informal
definition
Number of CIM information attributes
required by a participant
Formal
definition
p P,
I
AR
p
= | AR
p
|
Range
Գ
0
Scale Ratio
Indicator
name
Systems’ information attributes required (I
SAR
)
Informal
definition
Number of information attributes in the
participant’s systems which are represented in
the CIM and required by the participant
Formal
definition
p P,
I
SAR
p
= | SAR
p
|
Range
Գ
0
Scale Ratio
Information that should be Provided
Indicator
name
Systems’ information attributes that should be
provided (I
SASP
)
Informal
definition
Number of information attributes from a
participant’s systems, which are represented at
the CIM and are required by other participants
Formal
definition
p P,
I
SASP
p
= | SASP
p
|
Range
Գ
0
Scale Ratio
Mapped Information that should be Provided
Indicator
name
System’s mapped information attributes that
should be provided (I
SMASP
)
Informal
definition
Number of information attributes from a
participant’s systems, which are mapped to its
CIM equivalents and are required by other
participants
Formal
definition
p
P,
I
SMASP
p
= | SMASP
p
|
Range
Գ
0
Scale Ratio
Information that could be consumed
Indicator
name
Information attributes that could be consumed
(I
SACC
)
Informal
definition
Number of information attributes available from
all participant’s systems that could be consumed
by a participant
Formal
definition
p P, I
SACC p
= | SACC
p
|
Range
Գ
0
Scale Ratio
Information that should be Consumed
Indicator
name
Information attributes that should be consumed
(I
SASC
)
Informal
definition
Number of information attributes that could be
consumed and are required by a participant
Formal
definition
p P, I
SASC p
= | SASC
p
|
Range
Գ
0
Scale Ratio
Mapped Information that should be Consumed
Indicator
name
Systems’ mapped information attributes that
should be consumed (I
SMASC
)
Informal
definition
Number of information attributes mapped by a
participant that should be consumed
Formal
definition
p P, I
SMASC p
= | SMASC
p
|
Range
Գ
0
Scale Ratio
Information Mapping Performance
Indicator
name
System’s information attributes mapping balance
(I
SAMB
)
Informal
definition
Difference between information attributes
mapping ratio for consumption and provisioning.
The highest balance is achieved when the result is
zero. Positive results mean the participant is
performing better regarding information
provisioning, hence fostering other participants’
benefits, while negative results mean the
participant is performing better regarding
information consumption, hence fostering its own
benefits.
Formal
definition
Range [-1 ; 1]
Scale Ratio
Information Sharing Performance Management - A Semantic Interoperability Assessment in the Maritime Surveillance Domain
387
Indicator
name
System’s information attributes mapping
performance (I
SAMP
)
Informal
definition
Ratio between the information attributes
actually mapped and those that should be
consumed, hence mapped.
Formal
definition
Range [-1 ; 1]
Scale Ratio
4.4 Indicators Testing
To test our indicators we followed the methodology
(Franceschini et al., 2007) and started with the
properties of sets of indicators. Afterwards, we tested
the properties of the single indicators and, finally, we
tested the properties of the derived indicators.
A set of indicators is composed by the indicators
selected to represent a generic process, which can be
grouped into subsets, depending on their
characteristics (Franceschini et al., 2007). The
proposed indicators represent the generic process of
IS from the SI perspective. Therefore, the proposed
indicators are a subset of the set of indicators which
represents IS.
The properties of sets of indicators which have to
be tested are (Franceschini et al., 2007)
Exhaustiveness, Non-redundancy, Monotony and
Compensation.
Exhaustiveness implies that indicators should
properly represent all the system dimensions, without
omissions. The set of indicators is considered non-
exhaustive in one of the following situations
(Franceschini et al., 2007):
1) One or more indicators are wrongly defined,
because they do not map distinguishable
empirical manifestations into separate symbolic
manifestations;
2) With reference to a representation-target, the
model does not consider one or more process
dimensions (i.e. the set is missing some
indicators).
To test this property, it should be determined:
1) If different process states can be distinguished in
terms of empirical manifestations and,
2) If they are mapped into distinguished symbolic
manifestations by the indicators in use.
Considering these criteria, we have analysed the
proposed indicators and concluded that they fulfil this
property.
Non-redundancy means that indicators sets
should not include redundant indicators. If a set of
indicators is exhaustive, and if it continues to be
exhaustive even when removing one indicator, the
removed indicator is redundant (Franceschini et al.,
2007).
By definition, derived indicators are redundant.
The proposed set of indicators comprises 2 derived
indicators (I
SAMB
, I
SAMP
) which we consider essential
to analyse and monitor SI; therefore, although they
are redundant, we will keep them out of this
evaluation. Consequently, since none of the
remainder indicators is redundant, the proposed
indicators fulfil this property.
Monotony means that the increase/decrease of
one of the aggregated indicators should be associated
to a corresponding increase/decrease of the derived
indicator (Franceschini et al., 2007). This definition
implies that the symbolic manifestations of the sub-
indicators are represented using a scale with order
relation. Since all the derived indicators meet this
criteria, our indicators fulfil this property.
Compensation means that changes of different
aggregated indicators may compensate each other,
without making the derived indicator change
(Franceschini et al., 2007). Since all the derived
indicators meet this criteria, our indicators also fulfil
this property.
Consistency with the Representation-target is
the property which means that each indicator should
properly represent its representation-target
(Franceschini et al., 2007). This property is fulfilled
since the top-down approach followed, deriving the
indicators for each representation-target identified,
ensured it.
Level of Detail is the property which means that
each indicator should not provide more than the
required information (Franceschini et al., 2007). This
is not the case for any of the proposed indicators, as
can be concluded from each indicator definition,
therefore we conclude that the proposed indicators
fulfil this property.
Non Counter-productivity is the property which
means that indicators should not create incentives for
counter-productive acts (Franceschini et al., 2007). In
our context, counter-productive acts are those that
hamper IS; hence, these can be: 1) Participants
developing their semantic interoperability with the
sole purpose of consuming information; 2)
Participants developing their SI with the sole purpose
of providing information; 3) Participants not
developing their SI at all. The proposed indicators do
not provide incentive for any of these actions; on the
contrary, they allow the identification of such
situations (i.e. I
SAMB
, I
SAMP).
Therefore, we conclude
that the proposed indicators fulfil this property.
Economic Impact means that each indicator
ISE 2015 - Special Session on Information Sharing Environments to Foster Cross-Sectorial and Cross-Border Collaboration between Public
Authorities
388
should be defined considering the expenses to collect
the information needed (Franceschini et al., 2007).
Based on the experience gained during the
demonstration of the proposed indicators, collecting
the information required by all indicators took each
public authority involved between 1 and 6
person.hours, varying according to the number of
systems available at each one.
Included in this effort is also the necessary time
for participants to familiarize themselves with the
meaning of the CIM information entities and
attributes. Therefore, in future assessments, the time
required to provide the information can be even
smaller, which leads us to conclude that our single
indicators fulfil this property.
Simplicity of Use means that each indicator
should be simple to understand and use (Franceschini
et al., 2007). Again, based upon the experience gained
during the demonstration of the proposed indicators,
we conclude that our single indicators fulfil this
property.
5 VALIDATION
The validity of DSR must be established from the
evaluation of the developed artifacts, which must
show that the conditions to achieve their objectives
are satisfied (Pries-Heje and Baskerville, 2008). To
validate the proposed indicators we demonstrated
them in a real situation, and evaluated them according
to their objectives, as follows.
5.1 Demonstration
To demonstrate that the proposed indicators can be
used to assess SI, we have collected the required
information, via a questionnaire, from 5 public
authorities, selected according to the following
criteria: 1) Their missions entail MS or related tasks
– which implies they require such information; 2)
They have MS or related systems – which implies
they have such information available; 3) They require
information from each other – which implies an
exchange of information. Moreover, these authorities
represent the seven CISE user communities
(European Commission, 2010b).
Out of the 5 authorities questioned, only two
reported to have more than 1 system with information
that is represented by the CIM; D and E, with 2 and 5
systems, respectively. Moreover, only authorities A
and E have presently information attributes mapped
and with transformations defined between the CIM
and their own IM’s. Furthermore, none of the
participants reported to have more than one system
into which they intend to load the information
received from the remainder participants.
Table 2: Example of the questionnaire used.
Entity Attribute Required Available Mapped
Vessel GrossTonnage 1 0 0
IMONumber 2 2 1
The questionnaire was essentially composed of 5
columns, as exemplified in table 2, where the first two
are to represent the CIM used, and the last three are
to understand participants’ information requirements,
availability and mappings. The results of the
questionnaire are presented in table 3.
Table 3: Indicators results for the 5 authorities.
Indicator A B C D E
I
AA
14 5 2 55 35
I
SAA
14 5 2 110 58
I
AR
216 134 174 81 35
I
SAR
216 134 174 81 35
I
SASP
14 5 2 110 58
I
SMASP
14 0 0 0 2
I
SACC
175 184 187 79 131
I
SASC
175 137 156 17 20
I
SMASC
14 0 0 0 7
I
SAMB
0,92 0 0 0 -0,32
I
SAMP
0,15 0 0 0 0,12
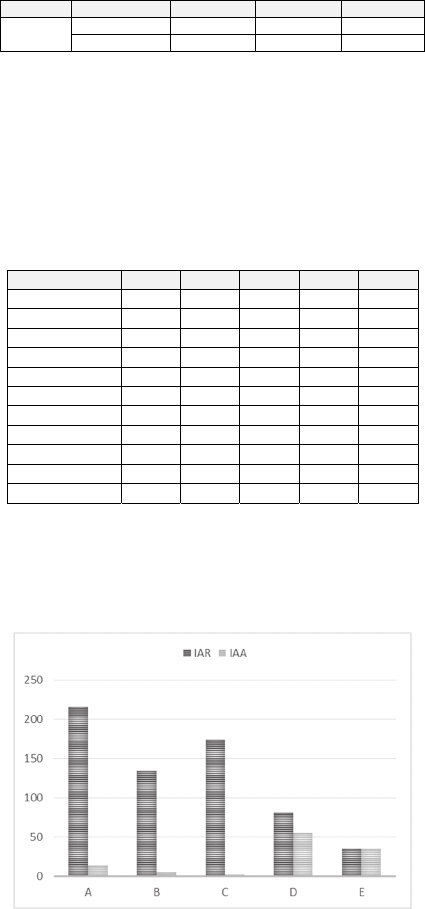
In fig. 2, we can see a comparison between the
CIM information attributes which are required and
available by the participants, without considering the
existing IMs.
Figure 2: CIM information attributes required (I
AR
) and
available (I
AA
).
Regarding the information attributes required, we
can see a clear difference between all the participants,
justifiable by their different missions, and also that
participants require a high number of information
attributes (59% in average). In particular, participant
A requires all CIM information attributes (216). This
Information Sharing Performance Management - A Semantic Interoperability Assessment in the Maritime Surveillance Domain
389
could mean either that all attributes have really been
found important or that, in doubt, all have been
reported as required.
Regarding the availability of the information
attributes, we can observe that each participant, alone,
holds very few CIM information attributes (22% in
average) in its information systems. Still, this does
not mean that participants do not hold the necessary
information to conduct their missions, because they
can obtain it by other means.
While these participants require (59% in average)
much more information than they have available
(22% in average), collectively, they do not hold more
than 51% (ratio between the sum of all participants
I
AA
and 216, since participant A requires all CIM
information attributes) of the information required,
meaning that at least 49% must be obtained by
involving other authorities in the process or by
acquiring the necessary systems and sensors. At the
same time, this also means that there is significant
room for improvement, if they share among
themselves the information already held.
Finally, we can also observe that, since all
participants require more information than they have,
their present information systems do not handle the
missing information; therefore, before having access
to the information that can be provided by the
remainder participants, they have to enhance their
information systems accordingly (without IMs there
is no SI, hence IS is not possible).
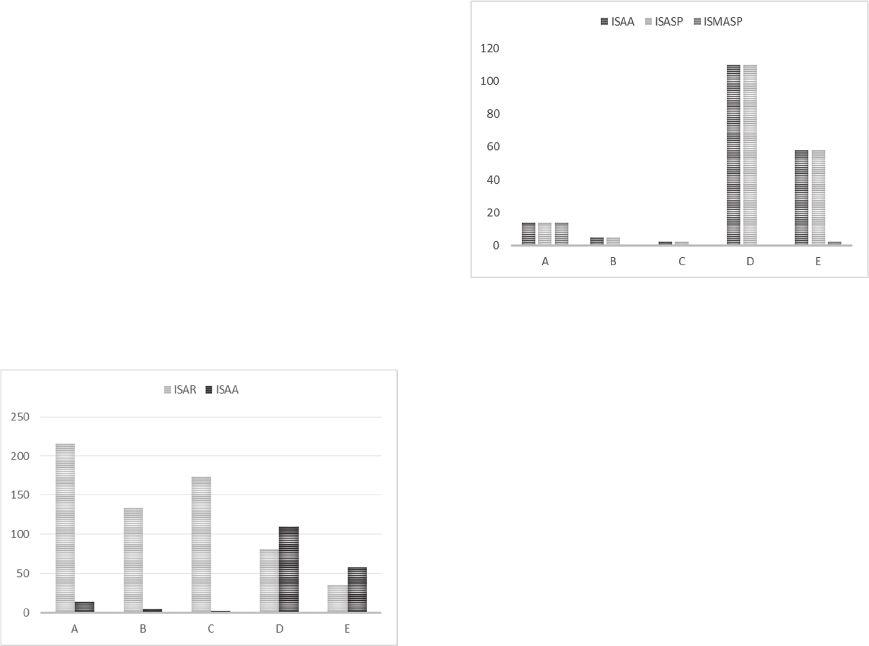
Figure 3: Systems information attributes required (I
SAR
) and
available (I
SAA
).
In fig. 3, we can see a comparison between the
CIM information attributes which are required and
available by the participants, considering the existing
IMs.
Regarding the information attributes required,
there is no difference to I
AR
, since no more than one
system will be used by each participant to collect the
information received from the remainder participants,
hence only one IM per participant is considered.
Regarding the information attributes available,
there is a big difference between I
SAA
and I
AA
, in the
cases of participants D and E. The reason for this is
that these participants have more than one system
with CIM information; therefore, for some
information attributes, they have more than one
source, meaning different IMs which may have to be
mapped and transformed into the CIM to implement
the necessary SI to provide those information
attributes to other participants as required. Therefore,
the real effort participants D and E must do, for this
effect, is much higher than what could be erroneously
inferred from fig. 2.
Figure 4: Systems information attributes for provisioning.
In fig. 4, we can see a comparison between the
CIM information attributes which are available,
considering the existing IMs.
Since every information attribute available is at
least required by one participant (note this is being
highly influenced by participant A, which requires all
CIM information attributes), there is no difference,
for all participants, between I
SAA
and I
SASP
; therefore,
they should provide all the CIM information
attributes available in all their systems.
Looking at I
SMASP
, on the other hand, allows us to
understand that there are practically no information
attributes mapped and with transformations defined
between the CIM and the original IMs, apart from a
few pertaining to participant E and participant A,
which has already mapped and defined
transformations for all its information attributes
available. Therefore, all participants but A will have
to map and define the transformations for most or all
of the CIM information attributes comprised by their
information systems, before actually being able to
exchange information among them.
In fig. 5 we can see a comparison between the
CIM information attributes which may be consumed
by the participants, considering the existing IMs.
ISE 2015 - Special Session on Information Sharing Environments to Foster Cross-Sectorial and Cross-Border Collaboration between Public
Authorities
390
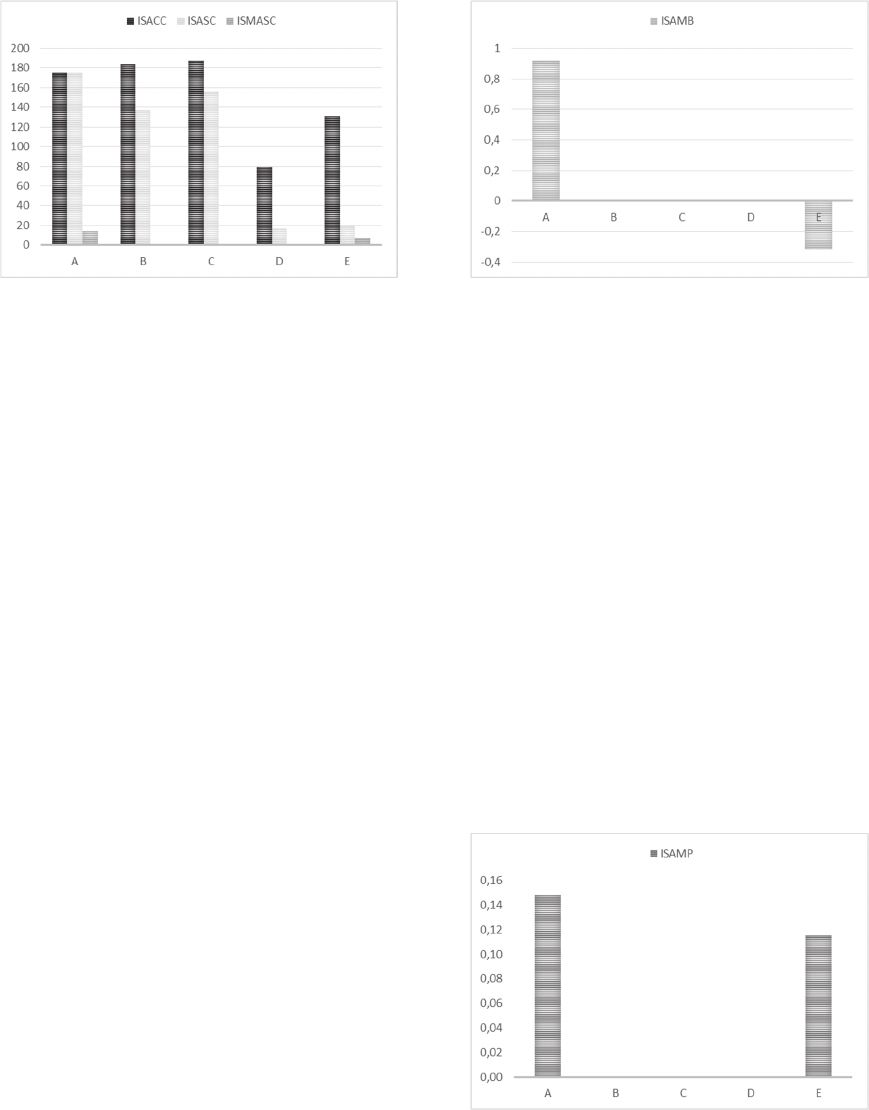
Figure 5: Systems information attributes for consumption.
Since participant A requires all CIM information
attributes, all those available at other participants
could be consumed, therefore, in this case, I
SACC
and
I
SASC
are the same.
Since participants B, C, D and E require less
information attributes than those available at all
participants, I
SASC
is smaller than I
SACC
.
In general, very few information attributes have
been mapped and seen their transformations defined
by the participants, mostly because their systems do
not handle the information attributes required.
Therefore, they will not be able to consume all the
information required and available, at other
participants, without first enhancing their systems
and, only then, developing the necessary SI between
their IMs and the CIM.
Another perspective is that participants A, B and
C demand much more information attributes from
other participants than participants D and E; however,
this does not mean that participants D and E are less
motivated for exchanging information with the
others, since this depends on the benefit of each
information attribute in particular which can,
inclusively, be different for each participant.
Depending on the context and actions taken by the
participants, while some have mapped and defined
transformations for information attributes which
contribute more to the benefit of other participants,
since they contribute more to provide the information
available, others have done the contrary, and
contribute more to consume the information
available, hence to their own benefit.
In fig. 6, we can see how each participant is
pending towards one or the other profiles. Those
which are more inclined towards information
provisioning have a positive rank, and those who are
more inclined towards information consumption have
a negative rank. Those with a good balance between
consumption and provisioning have the rank equal to
zero.
Figure 6: Participants information attributes mapping
balance.
Since participants B, C and D have no mappings
or transformations done, either for consumption or
provisioning, they have a good balance, which does
not mean they have nothing to improve, as we will
see.
Participant A is pending towards the information
provisioning profile, since although the mappings and
transformations performed contribute both to
provisioning and consumption, their contribution is
higher for provisioning (I
SMASP
and I
SMASC
),
considering the specific targets established (I
SASP
and
I
SASC
). Participant E, on the other hand, is pending
towards the information consumption profile, for the
same reasons of participant A, but in the opposite
direction.
Finally, fig. 7 depicts the performance of the
participants in regards to the information attributes
mapped and with transformations defined, between
their IMs and the CIM, both for information
consumption and provisioning.
Figure 7: Participants information attributes mapping
performance.
Here we can see that the overall performance of
the participants is substantially low (5% in average)
whereas three of them have not mapped or defined
Information Sharing Performance Management - A Semantic Interoperability Assessment in the Maritime Surveillance Domain
391
transformations at all, regardless of the interest
expressed and the opportunities available (see fig. 2).
On one hand, participants B and C have
demonstrated high information needs and very low
availability where, on the other hand, participant D
has not such a big difference between the information
required and available, meaning that the missing
information might not be so important.
5.2 Evaluation
To complete the validation of the proposed indicators,
their capability to meet their objectives has to be
analysed.
5.2.1 Characterization of the SI Situation
As presented earlier, we have characterized the
present SI situation of all the participants involved in
the demonstration, according to the different
representation-targets defined based on the
information model proposed for the CISE (European
Commission, 2010b) by the CoopP project (Finnish
Border Guard, 2014).
Our set of indicators allowed us to characterize the
present situation in terms of the information available
and required by the participants, in terms of the
information that should be provided and consumed by
the participants, and also in terms of the information
for which mappings and transformations between
participants systems IMs and the CIM must be
developed, in order to enable the essential SI for
information exchanges to take place among them, as
required.
Moreover, our set of indicators allowed us to
understand the performance of the participants
regarding the implementation of the necessary SI, and
also if they are being more effective in providing or
consuming information.
5.2.2 Definition of the Preferred SI Situation
Since the present situation has been characterized, it
should be possible to use the proposed indicators to
support the definition of the desired situation, which
is the second objective they have to meet.
The proposed indicators can be used to define SI
targets, according to the policies defined and the
resources available, for a specific timeframe. For
example, we can start by defining SI implementation
performance targets, and then drill down and further
define information consumption and provisioning
targets for every participant. These targets, and
especially the progress expected, can then be used to
develop insights on the benefits of increasing SI for
every participant.
5.2.3 Definition of Possible Lines of Action
The third objective the proposed indicators have to
meet is to support the definition of possible lines of
action, to go from the present into the desired
situation.
This can be achieved by defining actions to fill the
information gaps identified when characterizing the
present situation; for example, participants B, C and
D must develop their SI which, presently is none.
Moreover, lateral actions can be defined based on
the insights the indicators have provided again during
the analysis of the present situation. For example, the
fact that participant A requires all the information
available at all participants must be investigated, as
well as the importance of the information required by
participant D.
Furthermore, by developing insights on the
benefits of increasing SI, different scenarios can be
designed, so that the lines of action defined are the
most cost-effective.
5.2.4 Progress Monitoring and Control
Finally, the transition between the present and the
desired situation, achieved by implementing the lines
of action defined, must be monitored and controlled
along time, to ensure its success.
To support it, is the last objective that the
proposed indicators must meet. Which they do,
provided that an effective and efficient monitoring
program is put in place, so that the information
required by the proposed set of indicators can be
obtained in a cost-effective way.
Then, the results obtained can be compared with
the results of the previous monitoring actions, hence
enabling to understand the progress made and any
deviations from the intended path towards the desired
situation.
6 CONCLUSIONS
We have developed a set of 11 performance
indicators for the IS process based on its SI
dimension. To do it, we have followed the DSR
strategy and Franceschini’s methodology to define
and test process performance indicators.
We have demonstrated the indicators with the data
collected through a questionnaire, based on the CISE
information model proposed during the CoopP
ISE 2015 - Special Session on Information Sharing Environments to Foster Cross-Sectorial and Cross-Border Collaboration between Public
Authorities
392
project, answered by 5 public authorities which
require MS information and are committed to
exchange information with each other.
The proposed indicators fulfil their objectives,
namely by supporting the characterization of the
present situation, the definition of the desired
situation, the definition of the necessary lines of
action, and the monitoring and control of the
transformation required; hence, they are suitable for
managing SI and consequently contribute to
managing the performance of IS in the maritime
surveillance domain, as has been demonstrated.
Finally, the next steps should entail the
development of a method for the definition of an
action plan for enhancing IS based on SI, especially
considering that the proposed indicators do not
address the benefit of sharing the information
identified as necessary, which can be very important
for understanding the cost-effectiveness of the
possible lines of action, as well as prioritizing them.
ACKNOWLEDGEMENTS
The authors thank the support of the Portuguese
Directorate-General for Maritime Policy (DGPM).
REFERENCES
Council of the European Union. (2014). European Union
Maritime Security Strategy. Brussels. Council of the
European Union.
Dolin, R. H., Alschuler, L. (2011). Approaching semantic
interoperability in Health Level Seven. Journal of the
American Medical Informatics Association, vol. 18,
issue 1. http://dx.doi.org/10.1136/jamia.2010.007864
Dresch, A., Lacerda, D., Antunes, J. (2015). Design Science
Research: A method for Science and Technology
Advancement. Springer. ISBN: 978-3-319-07373-6.
European Commission. (2004). European Interoperability
Framework for PAN-European eGovernment services
v1.0. Brussels. European Commission.
European Commission. (2010a). European Interoperability
Strategy (EIS) for European public services. Brussels.
COM(2010) 744 final. European Commission.
European Commission. (2010b). Integrating MS. Brussels,
COM(2010) 584 final. European Commission.
European Commission. (2012). eHealth Action Plan 2012-
2020 – Innovative healthcare for the 21st century.
Brussels. COM(2012) 736 final. European
Commission.
European Commission. (2014). Interoperability Maturity
Model. Brussels. European Commission.
European Network and Information Security Agency.
(2009). Good Practice Guide. Network Security
Information Exchanges. European Network and
Information Security Agency
Feng, C., Flewelling, D. M. (2004). Assessment of semantic
similarity between land use/land cover classification
systems. Computers, Environment and Urban Systems,
vol. 28. http://dx.doi.org/10.1016/S0198-
9715(03)00020-6
Finnish Border Guard. (2014). COOPP project Final
Report. Helsinki. Finnish Border Guard.
Franceschini, F., Galetto, M., Maisano, D. (2007).
Management by Measurement. Designing Key
Indicators and Performance Measurement Systems.
Springer. ISBN 978-3-540-73211-2.
Guédria, W., Naudet, Y., Chen, D. (2008). Interoperability
Maturity Models. Survey and Comparison. Lecture
Notes in Computer Science, vol. 5333.
http://dx.doi.org/ 10.1007/978-3-540-88875-8_48
Guédria, W., Chen, D., Naudet, Y. (2009). A Maturity
Model for Enterprise Interoperability. Lecture Notes in
Computer Science, vol. 5872.
http://dx.doi.org/10.1007/978-3-642-05290-3_32
Hevner, A. R., et al. (2004). Design science in information
systems research. MIS Quaterly, 28(1), 75–105.
Hevner, A. R., & Chatterjee, S. (2010). Design research in
information systems: Theory and practice. New York:
Springer.
ICF International. (2014). Study on the feasibility of
improved cooperation between bodies carrying out
European Coast Guard functions. Brussels. ICF
International.
Paul, M., Ghosh, S. K. (2008). A framework for semantic
interoperability for distributed geospatial repositories.
Computing and Informatics, vol. 27, issue 2069.
Peffers, K. et al. (2007). A design science research
methodology for information systems research. Journal
of Management Information Systems, 24(3), 45–77.
Pras, A. and J. Schoenwaelder (2003). On the Difference
between Information Models and Data Models. RFC
3444, DOI 10.17487/RFC3444, January 2003,
http://www.rfc-editor.org/info/rfc3444
Pries-Heje, J., & Baskerville, R. (2008). The design theory
nexus. MIS Quaterly, 32(4), 731–755.
Rezaei, R., Chiew, T., Lee, S. (2013). A review of
interoperability assessment models. Journal of
Zhejiang University SCIENCE C, vol. 14, issue 9.
http://dx.doi.org/ 10.1631/jzus.C1300013
Simon, H. A. (1996). The sciences of the artificial (3rd ed.).
USA: MIT Press.
Tremblay, M. C., Hevner, A. R., & Berndt, D. J. (2010).
Focus groups for artifact refinement and evaluation in
design research. Communications of the Association
for Information Systems, 26, 599–618.
UNI 11097 (2003). Indicatori e quadri di gestione della
qualità, Milano.
Yahia, E., Aubry, A., Panetto, H. (2012). Formal measures
for semantic interoperability assessment in cooperative
enterprise information systems. Computers in Industry,
vol. 6, issue 5.
http://dx.doi.org/10.1016/j.compind.2012.01.010
Information Sharing Performance Management - A Semantic Interoperability Assessment in the Maritime Surveillance Domain
393
