
The Effect of Team Record on Fan Loyalty in the National
Football League
Rahul Mani
1
and Vinod Dubey
2
1
McLean High School, McLean, Virginia, U.S.A.
2
Department of Computer Science, George Mason University, Fairfax, Virginia, U.S.A.
Keywords: Fan Loyalty, Sports Data Mining, Predictive Modelling, National Football League.
Abstract: The paper explores the relationship between a team’s performance in the National Football League (NFL) in
terms of win and loss records and fan loyalty. It examines to what extent winning matters in order to sustain
fan loyalty and what is therefore the incentive for the owners and players to improve a team’s performance.
This research uses computer data mining and predictive modelling techniques through JAVA Programming
to answer this question. Linear and Quadratic regression analysis are undertaken to see if the results differ for
teams with a winning versus a losing record. The contribution of this paper is to establish that fan attendance
at home games can be significantly improved by the winning record of the team.
1 INTRODUCTION
Football is an American passion. Every season,
millions of fans rush to the stadiums to see their
favourite teams play, and hundreds of millions watch
the games on their televisions. The recent explosion
of fantasy football as a popular new pastime of
millions also attests to the increasing popularity of
NFL amongst its keen followers. Scores of other fans
are now using the Social Media like Twitter and
Facebook to express support for the teams.
While each NFL team and its performance plays
a huge part in its fans’ lives, interestingly we observe
that every year at the end of an NFL season there are
the usual elite teams like the New England Patriots,
Green Bay Packers, Baltimore Ravens, Indianapolis
Colts, Pittsburgh Steelers etc., that are most
successful, ending up in the playoffs and even making
a run at the Super Bowl (Table 1). On the other hand,
most other teams seem to have a habit of experiencing
moderate to poor season year in and year out. One is
therefore left to wonder, what keeps the fans loyal to
a team despite its poor performance year in and year
out?
Maintaining a loyal fan base should be of utmost
importance to every owner and manger as that is most
likely a key factor driving the earnings from the team.
This would show up in, for example, ticket sales
(attendance to the home games), TV viewership
Table 1: Super Bowl Winners (2000-2013).
Team Year
Baltimore Ravens 2000
New England Patriots 2001
Tampa Bay Buccaneers 2002
New England Patriots 2003
New England Patriots 2004
Pittsburgh Steelers 2005
Indianapolis Colts 2006
New York Giants 2007
Pittsburgh Steelers 2008
New Orleans Saints 2009
Green Bay Packers 2010
New York Giants 2011
Baltimore Ravens 2012
Seattle Seahawks 2013
(showing excitement surrounding the games) and
purchasing of a team’s merchandise (Jerseys, Caps
etc.). Fan loyalty, one would think, would be driven
to a large extent by how successful a team is. One
could therefore assume that some of the winningest
teams in the league would command stronger fan
loyalty than some of the lower ranked teams which
would most-likely see their fan loyalty and
Mani, R. and Dubey, V..
The Effect of Team Record on Fan Loyalty in the National Football League.
In Proceedings of the 3rd International Congress on Sport Sciences Research and Technology Suppor t (icSPORTS 2015), pages 257-262
ISBN: 978-989-758-159-5
Copyright
c
2015 by SCITEPRESS – Science and Technology Publications, Lda. All rights reserved
257
subsequently fan attendance dwindle. Therefore from
a revenue point of view, it is in the interest of the
owner and/or manager/coach of a team to improve its
winning record in order to improve fan loyalty or at
least maintain a high level of loyalty.
The objective of this paper is to test if the fan
loyalty of a NFL team is largely determined by its
success in the field. Fan loyalty is being defined here
as the percentage of stadium capacity filled in the
home attendance for each team from 2005-2013. This
definition is most effective for the purpose of this
paper as the attendance data is the most
comprehensive and the easiest to interpret.
Percentage of stadium capacity is being used because
different teams have different sized markets and in
turn different sized stadiums, so it is not in the interest
of this experiment to give a significant advantage to
teams with larger stadiums by simply using the raw
attendance numbers.
The computer science technique of data mining
and predictive modeling and is being used for the
analysis. The data mining process involves
discovering interesting and useful patterns and
relationships in large volumes of data (Marchi, 2010).
By applying predictive modeling techniques to
sports, this research contributes to a better
understanding of underlying factors that govern
human behavior associated with sports followings.
The programming language JAVA is used to create
and run the regression models for the data.
This genre of scientific research falls under the
relatively new area of “Sports Data Mining”. This
area has experienced rapid growth in recent years
(Baker and McHale, 2013; Hamadani, 2006; Stekler,
2007). Sports organizations are keen to find more
practical methods to extract valuable knowledge
using data mining techniques (Lewis, 2003; Silver,
2012). By finding the right ways to make sense of
data and turning it into actionable knowledge, sports
organizations have the potential to secure a
competitive advantage over their peers. Professional
sports organizations are multi-million dollar
enterprises with millions of dollars spent on a single
decision. With this amount of capital at stake, just one
bad or misguided decision has the potential of setting
an organization back by several years. With such a
huge risk at stake and a critical need to make good
decisions, the sports industry is an attractive
environment for applications of data mining (Boulier
and Stekler, 2003; Sinha and others, 2013;
Schumaker and others, 2010).
2 HYPOTHESIS
IF a team has a greater winning record, THEN the
team will have stronger or greater fan loyalty (in this
case, percentage of stadium capacity filled during
home games) BECAUSE the team will be more
enjoyable to watch and will attract greater attention in
its local community, leading to new fans joining the
fan-base, and former fans coming back as well. More
people will tune in to the team on television, more
merchandise will be sold, and teams will have an
increased following on social media, in addition to
more people coming to the games.
3 DATA AND METHODOLOGY
Data for this research comes mainly from websites
such as NFL.com and ESPN.com. JAVA
programming is used for analysis. Eclipse (an
integrated development environment for
programming Java) is used to code the program used
for outputting the results of the experiment. In
correspondence with Eclipse, certain Java libraries
found online were used to help with the coding. These
included Apache POI (used to read data from the
excel file), Apache Commons Mathematics (used to
help create the linear/simple regression), and
Princeton’s Algorithms and Clients (used to help
create the quadratic regression).
Here are the specific steps:
1. The JAVA development kit was downloaded
from Oracle’s website (http://www.oracle.com/) and
then installed
2. The IDE (integrated development
environment) Eclipse was downloaded and installed,
which was used for the actual coding of the regression
models
3. The data was read from the Excel file using the
Apache POI library and was subsequently stored in a
two-dimensional matrix
4. The 2-dimensional matrix was then inputted
into a Simple Regression call, using the Simple
Regression class in Apache Commons Mathematics
library (commons.apache.org/math/)
5. The results of the linear (or simple) regression
model were then outputted.
6. The matrix was split in to 2 separate arrays of
data, one for the x-values (Wins in a season), and one
for the y-values (average percentage of home
attendance in terms of stadium capacity)
7. This was inputted into a Polynomial
Regression call, using the Polynomial Regression
icSPORTS 2015 - International Congress on Sport Sciences Research and Technology Support
258
class found in Princeton’s Algorithms and Clients
(algs4.cs.princeton.edu/code/), and
8. The results of the quadratic regression were
outputted as well.
The appendix details the Java Programming used.
There are two main things that are measured- team
success and fan loyalty. The correlation between
success and fan loyalty is examined using predictive
modelling approach controlling for various factors.
The regression equation estimated to reflect this is:
Y
t
= a + bX
t-1
+e (1)
Y (Dependent Variable) is the attendance for a team
as a % of stadium capacity in Season ‘t’;
X (Independent Variable) is the number of wins for a
team in Season ‘t-1’;
b is the change in average attendance due to change
in previous season’s winning record;
a is the constant; and
e is the error in predicting the attendance, given the
team record.
For the winning record, the preceding season (t-1)
is the one that matters since the ongoing season would
not be expected to make a significant impact on ticket
sales, as for the most part tickets are sold prior to the
season beginning, with most in-season ticket
transactions being between people who already have
tickets (or are season-ticket holders) to non-ticket
holders and other general public.
The coefficient ‘b’ is of interest for the purpose of
this paper as it indicates the change in ticket sales as
a percentage of stadium capacity that results from
change in the number of wins in the previous season.
While equation (1) suggests a proportionate change in
attendance with respect to wins, it is quite plausible
that attendance is more responsive to wins for teams
with losing records than winning records. In such a
case a quadratic formulation is needed to test a
possible non-linear relationship between the number
of wins in the previous season and team attendance in
a particular season. The regression equation estimated
for the quadratic formulation estimated is:
Y
t
= a + bX
t-1
+ (bX
t-1
)
2
+ e (2)
4 RESULTS AND ANALYSIS
The analysis is done for all of the 32 NFL teams over
a period of 8 years for which the data is available.
The home attendance varies from a minimum of 70.3
percent of capacity to 116.5 percent of capacity. It is
important to clarify here why a stadium capacity
would exceed its maximum limit, i.e. 100 percent.
Stadium "capacity" is measured in terms of seats.
This number is set and seldom changes if the stadium
is specially built for the team in question. What then
happens is seats are added- usually in less desirable
places or standing-room only tickets are sold. In
addition, luxury boxes which have stated occupancy
numbers could also contribute to stadium capacity,
but are not closely monitored during events. So it is
becomes possible for stadiums to sell tickets in excess
of the official capacity.
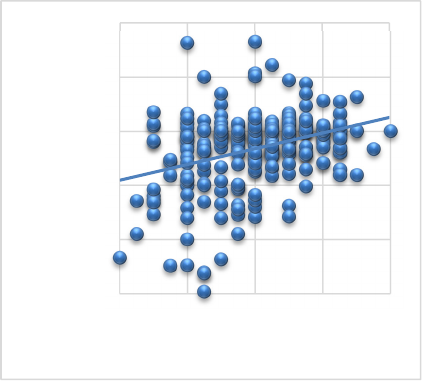
Figure 1 depicts the fitted values compared to the
scattered real observations and linear regression
results are reported in Table 2. The results suggest
that a team’s winning record in the previous season
significantly impacts the attendance for home games.
A “t” statistic of 5.93 at 95 percent confidence
interval attests to this significance. Interpreting the
coefficient of independent variable one can say that
each additional win in the previous season leads to
0.72 percent or almost 1 percent increase in current
stadium attendance as a percent of its capacity.
Figure 1: Graphing of Fitted Values using Linear
Formulation.
For example, if on average the stadium attendance is
85 percent of its capacity it will increase to
approximately 86 percent for each additional win in
the previous season. It the total capacity is 100,000
then that would mean that for each additional win
1000 more people will come to the stadium. If a team
improves its record from 4 wins to 9 wins then
approximately 5000 additional people will show up
70
80
90
100
110
120
0 4 8 12 16
Average Attendance (Percentage of
Stadium Capacity)
Number of WIns in a Season
The Effect of Team Record on Fan Loyalty in the National Football League
259
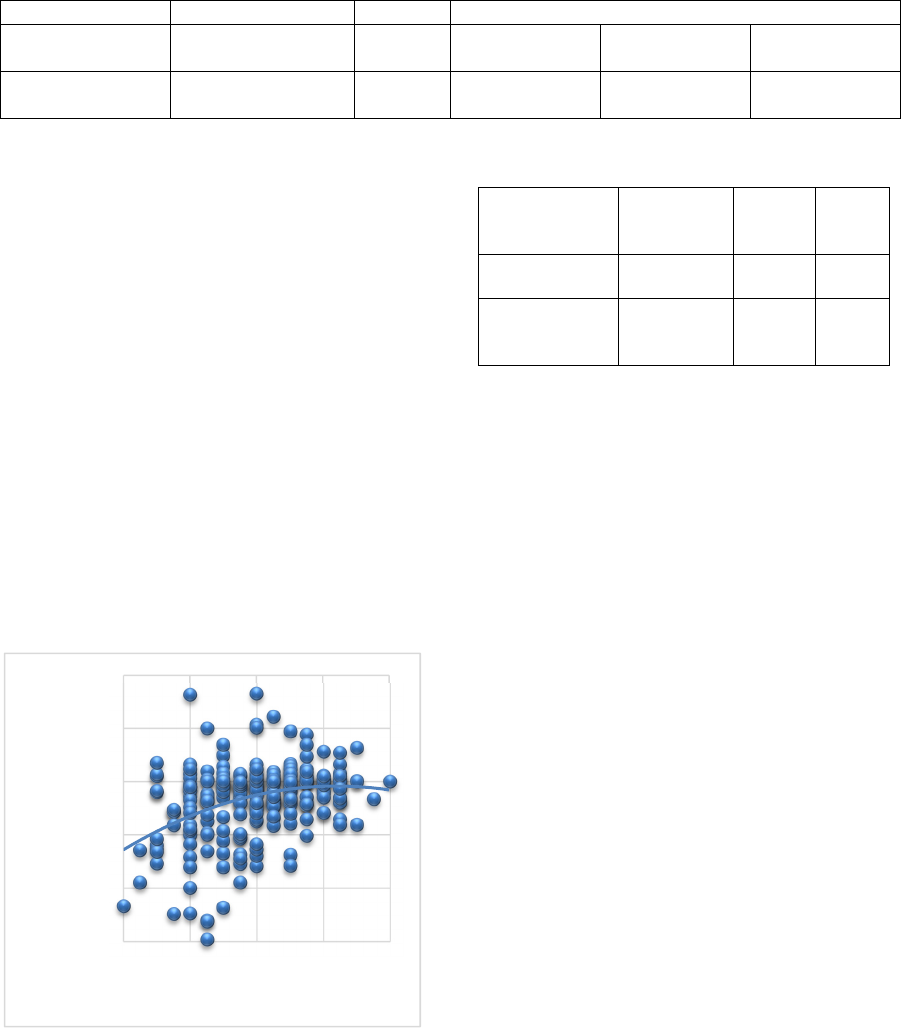
Table 2: Linear Regression Results (Equation 1).
for the games. This is important from a business view
point for an owner or manager. If the average price of
a ticket is $125 then each win brings additional
revenue earnings of $125,000. If one were to include
parking fee and money spent on food and beverages
for each additional person attending the game, it will
add on average another $75 on average or $75,000 in
total. If a team improves its record by 5 games then
it could be looking at additional revenue of over $1
million.
The results of the quadratic regression are given in
Table 3. It suggests that attendance as a percent of
stadium capacity increases with number of wins but
at a decreasing rate. As it can be seen in Figure 2,
interestingly the impact of winning record on
attendance is much larger for losing team than
winning teams. While the attendance increases as the
winning record improves it increases at a decreasing
rate. For a team with 12 or more wins it does not
change much, and eventually, it even starts to fall a
little bit.
Figure 2: Graphing Fitted Values Using Quadratic
Formulation.
In other words, winning makes a big difference to the
attendance of a team with a losing record than with a
winning record, which is all the more reason for
teams with a losing record to improve their
performance.
Table 3: Quadratic Regression Results (Equation 2).
Independent
variable
Coefficient of
Independent
Variable
R-Square Constant
Wins in the
Previous Season
1.875553 0.13 87.08
Wins in the
Previous Season
Squared
-.0730872
5 CONCLUSIONS AND WAY
FORWARD
The aim of this paper is to examine how a team’s
performance affected its fan loyalty controlling for
other factors. The major finding here is that the
number of wins in a season has a significant impact
on the loyalty of fans. Also, one major trend found in
the quadratic formulization is that the rate of growth
of fan loyalty decreases as the number of wins
increases, showing that fan loyalty of a lower-level
team is affected a lot more with a win or a loss than
with higher-level teams.
The significance of the constant term suggests
that there may be many other factors, such as family
history (who one’s family supports), home-town
support, home-town income, price of tickets favourite
players, and so on.
Even if a team has a winning record there is
always a possibility that a team does not make it to
the playoffs. A way to extend the analysis would be
to see to what extent attendance will depend on
whether or not a team makes it to the playoffs or even
wins the Super Bowl.
Similarly, one can substitute television market
share for stadium attendance as the dependent
variable. Television market share is usually defined
as percentage of TV homes in that market with TV
“physically tuned” into the game. It also provides a
good barometer to gauge the fan intensity for the
home team. One can also potentially look at team
merchandise sales or social media popularity as
representations of fan loyalty once more data
becomes available.
70
80
90
100
110
120
0481216
Average Attendance (Percentage of
Stadium Capacity)
Number of WIns in a Season
Attendance as a % of Stadium Capacity
Independent
variable
Coefficient of
Independent Variable
Standard
Error
R-Square Constant F( 1, 254)
Wins in the
Previous Season
0.7257376 0.126 0.114 90.88 32.80
icSPORTS 2015 - International Congress on Sport Sciences Research and Technology Support
260
When the initial analysis is extended to test the
significance of playoffs on home game attendance, it
suggests a much bigger impact on team attendance
than a mere winning record. A playoff appearance
would increase the average attendance in relation to
the stadium capacity by 3.2 percent! This could off
course be studied more carefully in the future.
Similarly when the analysis is extended using
share of the local television market share, the results
suggest that each win in the current season increases
the share of the television market by 1.4 percent and
each win from the previous season increases TV share
by almost 1 percent. A playoff appearance in the
previous season on the other hand increases the share
of local TV market by almost 7 percent! Again this is
an area which could be studied in detail in the future.
The analysis can be extended also to look at jersey
and other team merchandise sales and social media
popularity.
Professional sports organizations are multi-
million dollar enterprises with millions of dollars
spent on a single decision. With this amount of capital
at stake, just one bad or misguided decision has the
potential of setting an organization back by several
years. The results therefore suggest that owners and
management along with coaches and players would
benefit significantly by putting together a winning
combination! Nothing more matters for the fans than
to see his/her team wins.
REFERENCES
Apache POI - the Java API for Microsoft Documents.
(n.d.). Retrieved January 2, 2015, from
http://poi.apache.org/
Baker, R.D. and I.G. McHale, 2013. Forecasting exact
scores in national football league games. International
Journal of Forecasting 29(1), 122–130 (2013).
Boulier, Bryan L. and H.O. Stekler, 2003. Predicting the
outcomes of National Football League games.
International Journal of Forecasting: 19 (2), 257-270
(2003).
Hamadani, B., 2006. Predicting the outcome of NFL games
using machine learning. http://cs229.stanford.edu/
proj2006/BabakHamadani-PredictingNFLGames.pdf.
Java Algorithms and Clients. (n.d.). Retrieved January 29,
2015, from http://algs4.cs.princeton.edu/code/
Lewis, M., 2003. Moneyball: The Art of Winning an Unfair
Game, NYork: W.W. Norton G. Company, page 75/77.
Marchi, Leonardo De, 2011. Data Mining of Sports
Performance Data. Erasmus computing 2010/2011
http://www.comp.leeds.ac.uk/mscproj/reports/1011/de
_marchi.pdf
Math- Commons Math: The Apache Commons Mathematics
Library. (n.d.). Retrieved January 14, 2015, from http://
commons.apache.org/proper/commons -math/
Schumaker, R.P., O. K. Solieman and H. Chen, 2010.
Sports Data Mining, Integrated Series in Information
Systems, Volume 26, 2010. Springer.
Silver, Nate, 2012. The Signal and the Noise: Why So Many
Predictions Fail — but Some Don't. New York: The
Penguin Press.
Sinha, S., C. Dyer, K. Gimpel, and N.A. Smith, 2013.
Predicting the NFL Using Twitter. Carnegie Mellon
University, Pittsburgh PA 15213, USA.
Stekler, H. O., 2007. Sports Forecasting, Working Papers
2007-001, The George Washington University,
Department of Economics, Research Program on
Forecasting, revised Jan 2007.
The Effect of Team Record on Fan Loyalty in the National Football League
261
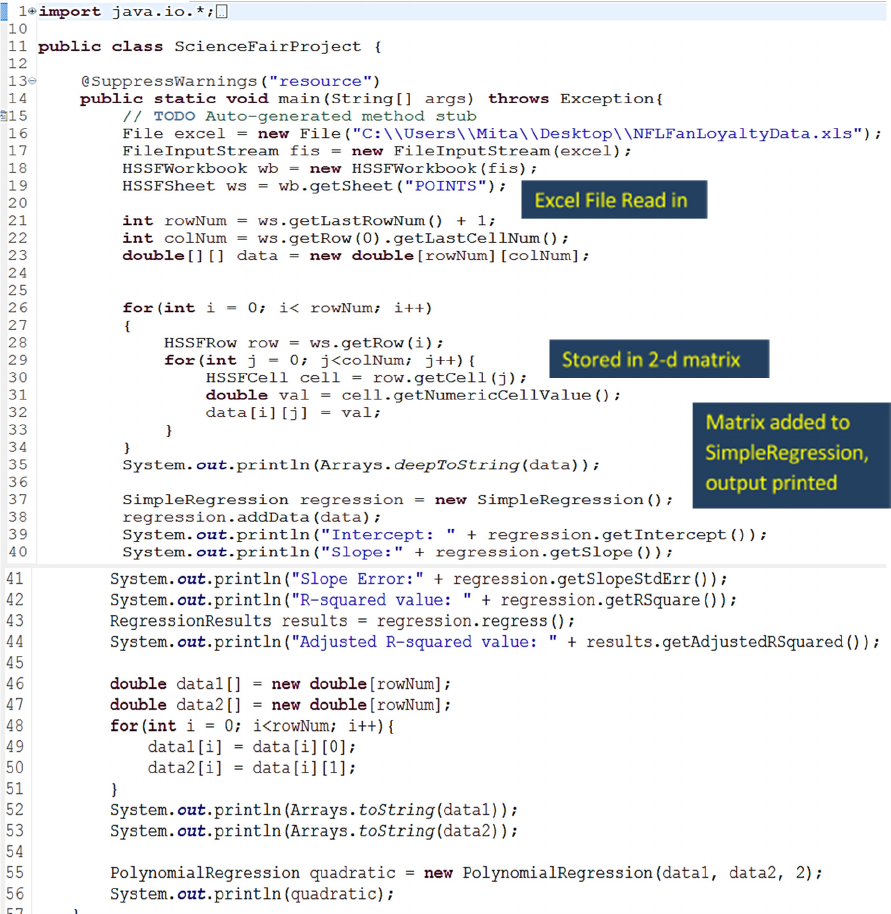
APPENDIX
Java Programming
icSPORTS 2015 - International Congress on Sport Sciences Research and Technology Support
262
