Design of i-Fields System Component: Computer Model of
Oil-Recovery by Polymer Flooding
D. Zh. Ahmed-Zaki, S. T. Mukhambetzhanov and Т. S. Imankulov
Al-Farabi Kazakh National University, al-Farabi ave., 71, Almaty, Kazakhstan
Keywords: Polymer Flooding, Surfactant, i-Fields, Smart Fields, Parallel Program.
Abstract: This article describes the issues and approaches the design and development of distributed high-
performance system for analysis of oil fields within the i-fields (smart fields) concept. The system is based
on hydrodynamic model of collaborative filtering of oil, water, gas, polymer solution and the surfactant,
taking into account influence of temperature. Built a 3D numerical parallel algorithm and web-based
platform for data analysis and calculation on a supercomputer. Obtained distribution of the main
technological parameters: distribution of pressure, saturation of each phase, the concentration of surfactant
and polymer, and temperature.
1 INTRODUCTION
Nowadays there are many approaches to develop
software systems for the analysis and development
of oil and gas fields (software.slb.com, rfdyn.com).
But the problem of creating fields monitoring
systems in real-time, modelling and optimal control
of field development began to appear only in recent
years due to the development of information
technologies. Particularly interesting approach for
the development of information systems - smart
fields, i-fields, e-fields and other. These systems are
mainly aimed at solving problems of "continuous"
optimize of operations on oil field: location,
quantity, and planning new wells. For the
implementation of such advanced technologies in
large and complex oil and gas fields require detailed
research data on the methods of drilling / plug wells
(horizontal, inclined and multilateral), with sensors
(pressure, inflow, temperature, etc.) in the borehole
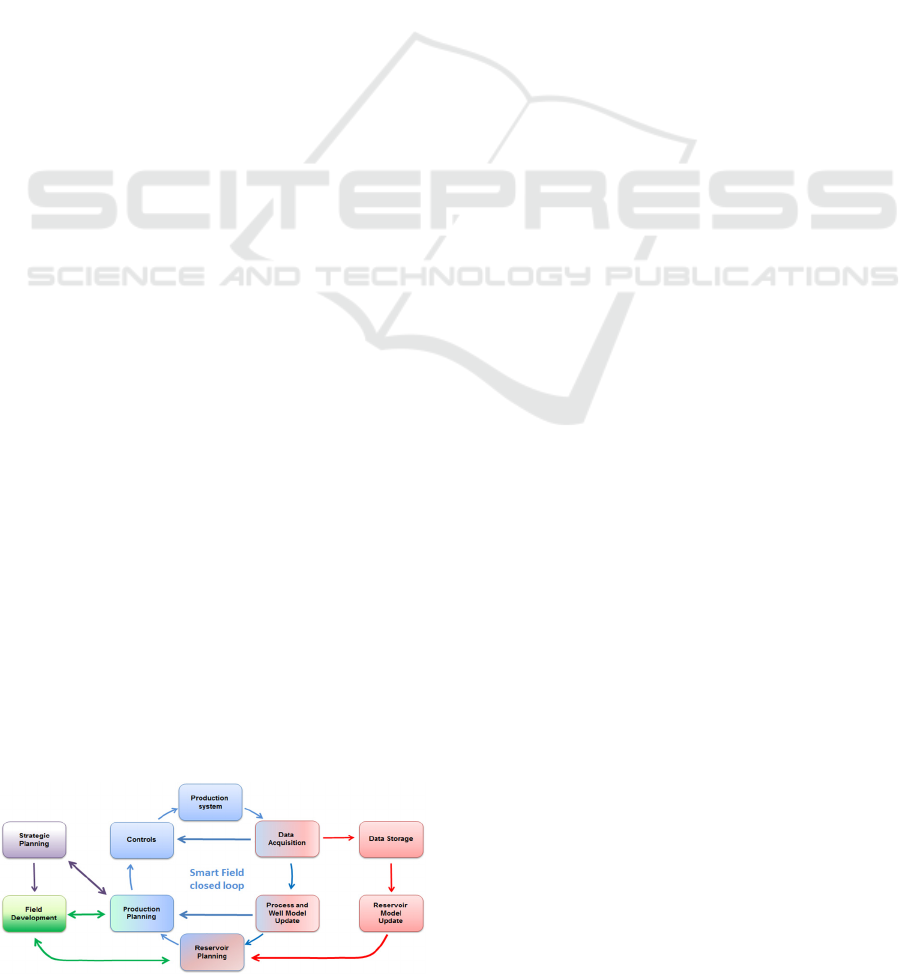
Figure 1: A “Closed-loop intelligent field” scheme (Smart
Fields Consortium, Stanford University, USA).
geophysical measurements. In this case, there is an
acute demand for the need of modelling and
monitoring in real time to aid decision making and
optimal management/exploitation involving the
latest equipment and hardware/software systems.
Synthesis of the above, in the form of
implementation of the "closed-loop intelligent
(smart) field" is shown in Figure 1
(smartfields.stanford.edu). As can be seen in the
figure, the cycle consists of two basic components:
planning / forecasting and modeling processes into
reservoir on oil field. In this paper, we consider it is
the second component. Within the framework of
implementation of these components, project authors
will design and develop distributed high-
performance analysis system of oil and gas fields
within i-fields concept with modern mathematical
models of three-phase flow in porous media and
computational algorithms with three-dimensional
visualization of data to monitor them in real time.
Surfactant and polymer flooding are the effective
chemical EOR methods. There are various
interactions between the surfactant and the reservoir
fluids, such as adsorption, interfacial tension,
wettability (Babalyan, 1983). Surfactants are used to
reduce the interfacial tension between crude oil and
reservoir water and increase the mobility of
"trapped" oil in the pore space. Polymer injection
method is used to reduce water mobility and
increase water viscosity. Decreasing the
permeability of the water phase increases flooding
510
Zh. Ahmed-Zaki D., T. Mukhambetzhanov S. and Imankulov T..
Design of i-Fields System Component: Computer Model of Oil-Recovery by Polymer Flooding.
DOI: 10.5220/0005572905100516
In Proceedings of the 12th International Conference on Informatics in Control, Automation and Robotics (ICINCO-2015), pages 510-516
ISBN: 978-989-758-123-6
Copyright
c
2015 SCITEPRESS (Science and Technology Publications, Lda.)

efficiency and significantly improves quality of
displacement (Lake, 1989; Sorbie, 1991). The paper
Imankulov, 2014 describe the problem of oil
displacement process by polymer injection, and
compares the results of numerical experiments using
gellan and polyacrylamide, a change in viscosity of
the aqueous phase is taken as a linear function and
does not depend on temperature.
At present, the combined methods of enhanced
oil recovery are used. One such method is surfactant
flooding in combination with water soluble
polymers. Surfactant and polymer are injected into
the reservoir, then, push oil to the production wells
by pumping water. This method shows higher
recovery rate comparing with using surfactant and
polymer alone (
Fathaddin
, 2011; Rai, 2013 ).
This work aims to study the mathematical model
of oil displacement by polymer-surfactant flooding,
which is considers the influence of temperature
effects and dependence of polymer/surfactant
solution viscosity on agents concentration and water
salinity. Development of sequential/parallel
computational algorithm for solution of 3D problem
using MPI and CUDA technologies.
2 MATHEMATICAL MODEL
2.1 Mathematical Model of Polymer
and Surfactant Flooding
Several physical and chemical processes influence
the properties of the polymer/surfactant and
polymer/surfactant solution. For example, viscosity
of injected solution depends on various factors, such
as reservoir temperature, concentration of
polymer/surfactant in solution and water salinity and
etc. The model considers following assumptions:
- the porous media and fluid are incompressible;
- gravitational forces are not taken into account;
- the two-phase flow (aqueous, oleic) is subject of
the Darcy’s law;
- water, polymer, surfactant and salt are fully
mixed;
- adsorption of the polymer affects only on the
relative permeability of the aqueous phase;
- dissolution of polymer and surfactant in oil is
very small.
Based on the above assumptions, we can write
the mathematical model of two-phase flow in porous
media.
Mass conservation equation for aqueous and
oleic phases (Akhmed-Zaki, 2012) is:
+
(
)
=
(1)
+
(
)
=
(2)
+
=1
where – porosity,
,
–water and oil
saturations,
,
- source or sink,
,
–
velocity of the water and oil phases, which is
expressed by the following law:
=−
(
)
, = , (3)
(
)
,
– relative permeability and viscosity of
fluids,
– absolute permeability.
Polymer and surfactant concentration and salt
transport equations can be written as (Babalyan,
1983):
+
+
=
(4)
(
+
)
+
+
(
+
=
(
+
)
(5)
(
)
+
(
)
=0 (6)
where
,
– polymer and salt concentrations in
aqueous phase,
,
–surfactant concentration in
aqueous and oleic phases,
,
– polymer and
surfactant adsorption functions,
,
,
–
polymer and surfactant coefficients.
Heat transfer equation:
(
1−
)
+
(
+
)
+
(
)
+
(
)
=
(
1−
)
+(
+
)
(7)
where
,
,
– specific heat of water, oil and
rock,
,
,
– density of water, oil and rock,
,
,
– coefficients of thermal conductivity.
Flory-Huggins equation can represent a
mathematical relation which describes the
dependence of water phase viscosity on
concentration of salt, surfactant and polymer. This
dependence, which takes into account temperature
changes can be written as (Flory, 1953):
=
1 + (
+
+
+
)
−
( −
)
(8)
=
1 −
( −
) (9)
Designofi-FieldsSystemComponent:ComputerModelofOil-RecoverybyPolymerFlooding
511
where
,
,
,
,
,
,
– nondimensional
constants.
−initial viscosity of oelic phase,
−
reservoir temperature.
Relative permeability curves are taken as
follows:
(
)
=
.
;
(
)
=(1−
)
.
The type of the polymer and surfactant
determines their adsorptions degree. Langmuir’s law
can represent the relation between adsorbed
polymer/surfactant and polymer/surfactant
concentration in the solution (Babalyan, 1983):
=
1+
where −Langmuir’s constant.
Permeability reduction factor
can be
described as follows (Wegner, 2012):
=1+(
−1)
- residual reduction factor.
Initial and boundary conditions are:
|
=
,
=
,
=
,
|
=
,
|
=
,
=
(10)
|
=
|
=
= 0;
=∙
;
=∙
;
−
+
∙
=
∙̃
; (11)
−
+
∙
=
∙̃
;
+
∙
=0;
Pressure equation obtained is by adding (1) and (2):
(
)
+
(
)
=0 (12)
Correctness of the proposed model was
confirmed by two stages of verification (Imankulov,
2014):
- comparison of numerical results with
laboratory experiments;
- and with results of calculations on
hydrodynamic simulator Eclipse 100.
2.2 Numerical Method
For numerical calculation, consistency of units and
order of variables are important. Therefore, a system
of equations (1) - (12) is converted to a
dimensionless form. To solve these equations, an
explicit scheme is used (Samarskii, 1989). First of
all, fluid properties and physical parameters of
reservoir are set. Further calculations are conducted
in the following order:
- distribution of pressure;
- saturation (by the known distribution of
pressure);
- distribution of salt, surfactant and polymer
concentrations;
- distribution of temperature in the reservoir;
- aqueous phase viscosity, depending on salt,
surfactant and polymer concentrations is
recalculated;
- aqueous phase permeability considering the
polymer adsorption is recalculated.
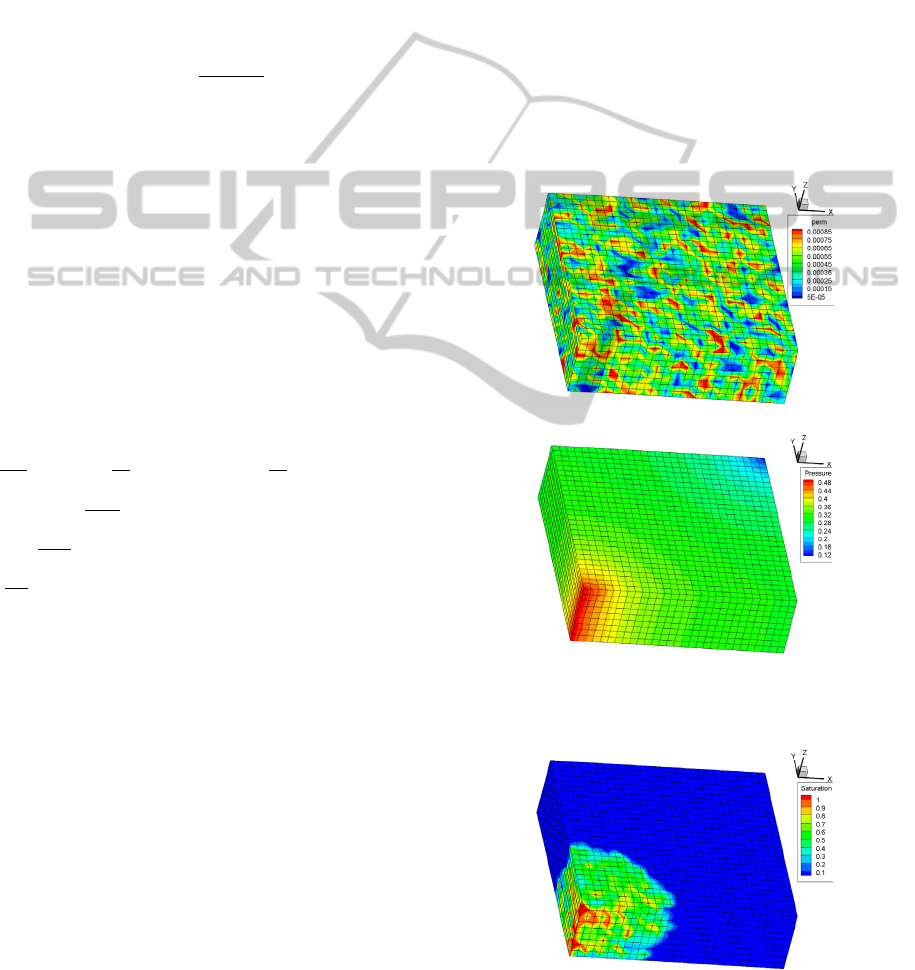
The results of numerical calculations for non-
isothermal oil displacement are shown in the
following Figures 2-7.
(a)
(b)
Figure 2: (a) Permeability field; (b) distribution of pressure.
Figure 3: Distribution of water saturation at different
moments of iteration times.
ICINCO2015-12thInternationalConferenceonInformaticsinControl,AutomationandRobotics
512
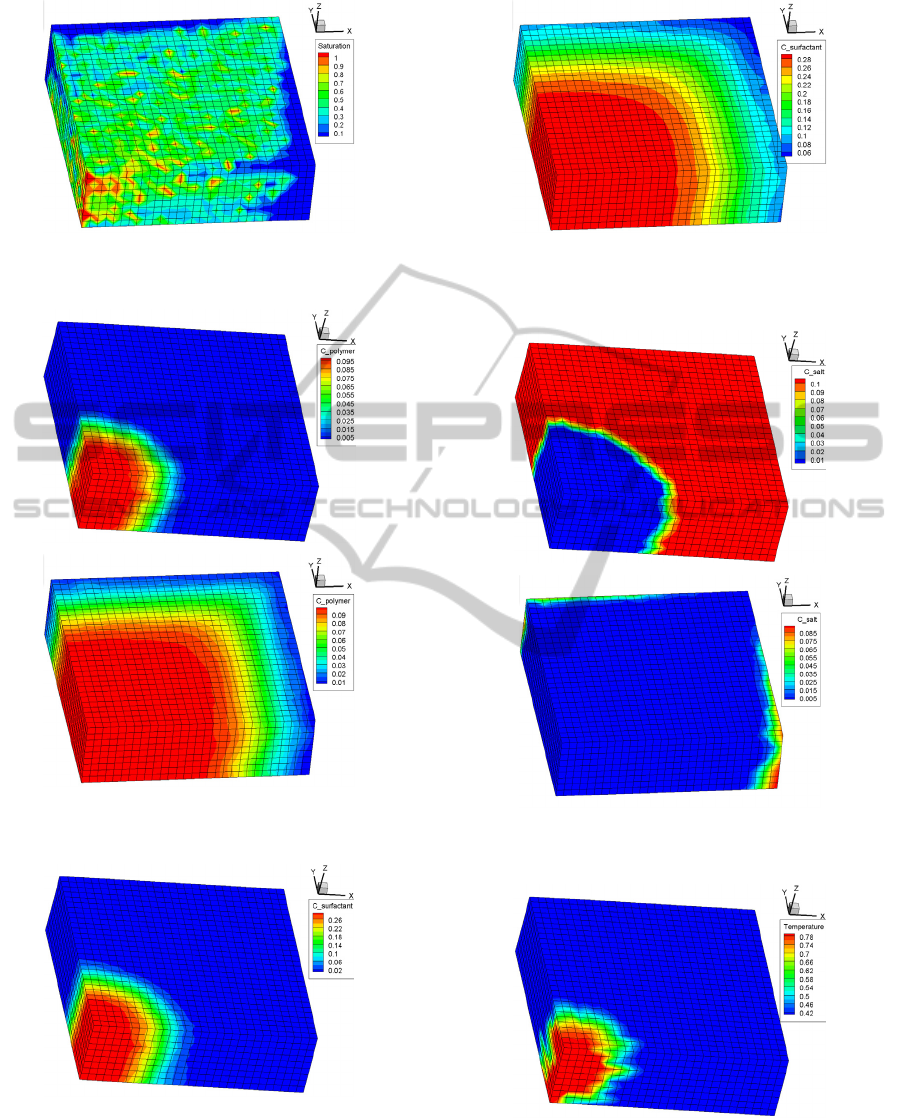
Figure 3: Distribution of water saturation at different
moments of iteration times (cont.).
Figure 4: Distribution of the polymer concentration in the
aqueous phase at different moments of iteration time.
Figure 5: The distribution of the surfactant concentration
in the aqueous phase at different moments of iteration
times.
Figure 5: The distribution of the surfactant concentration
in the aqueous phase at different moments of iteration
times(cont.).
Figure 6: Distribution of the salt concentration in the
aqueous phase at different moments of iteration times.
Figure 7: The temperature distribution at different
moments of iteration times.
Designofi-FieldsSystemComponent:ComputerModelofOil-RecoverybyPolymerFlooding
513
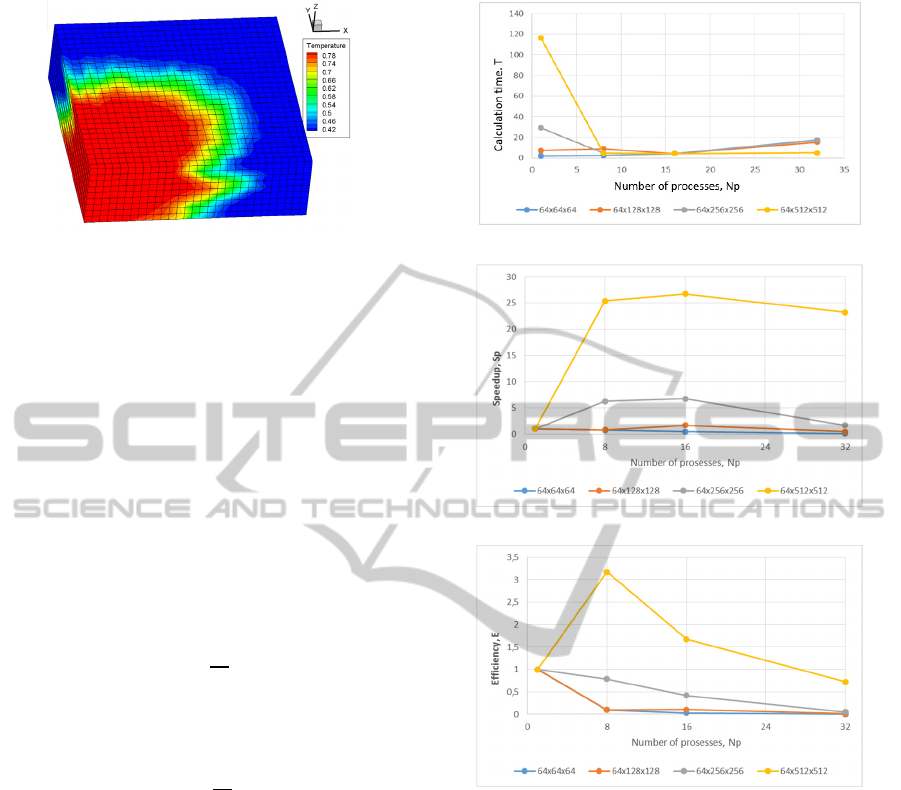
Figure 7: The temperature distribution at different
moments of iteration times (cont.).
For parallelization of this algorithm, the
computational domain is divided into partially
overlapping subdomains, calculations in which are
performed independently of each other. After each
iteration, it is necessary to make the exchange of
data at the boundaries of the subdomains (Matkerim,
2013). The above method was implemented using
MPI technology.
The speedup and efficiency of parallel algorithm
on the 64х64х64, 64х128х128, 64х256х256,
64х512х512 grids are investigated.
Speedup of parallel algorithm is estimated as the
ratio computing time on a single processor
to
computing time on p processors
:
=
the efficiency of parallel algorithm is estimated as
ratio of speedup to the number of processors :
=
As you can see from Figure 8, the computing time of
serial code very large in comparison with the
parallel code at large computational grids. Also, you
will notice that, when the number of processes
exceeds 16, speedup and efficiency of the algorithm
decreases. This is because an increase in the number
of processes is increases number of data exchanges
between processes. Therefore, the computing time
increases, since these exchanges are also takes time.
Accordingly, we can see that high efficiency can
only be achieved on large grids, as on such grids loss
of time on data exchanges between processes are not
significant.
(a)
(b)
(c)
Figure 8: (a) Calculation Time, Speedup (B) and
Efficiency (C) of Parallel Algorithm for Different Grid
Sizes and on Different Process Numbers.
2.3 3D Web Hydrodynamic Simulator
The system represents interactive package for
analysis and estimation of technological problems of
hydrodynamic simulation of oil and gas fields. The
basis of the produced program complex the modern
scientific developments which allow to use
heterogeneous multiprocessing computer facilities at
their limit. Because of this it is possible to
demonstrate high efficiency of calculations. The
system is initially developed as an interactive
package - Web applications on the basis of client-
server architecture models of MVC – Model View
Controller type. The possibility of automatic
connection and start of calculations on a
ICINCO2015-12thInternationalConferenceonInformaticsinControl,AutomationandRobotics
514
supercomputer is presented. The user can observe
calculation results in real-time, manage calculation
process and also modify model online.
Visualization module of three-dimensional
reservoir loads the data from special format text
files, reads geological model from them and
provides visualization of this model in the form of
three-dimensional contour.
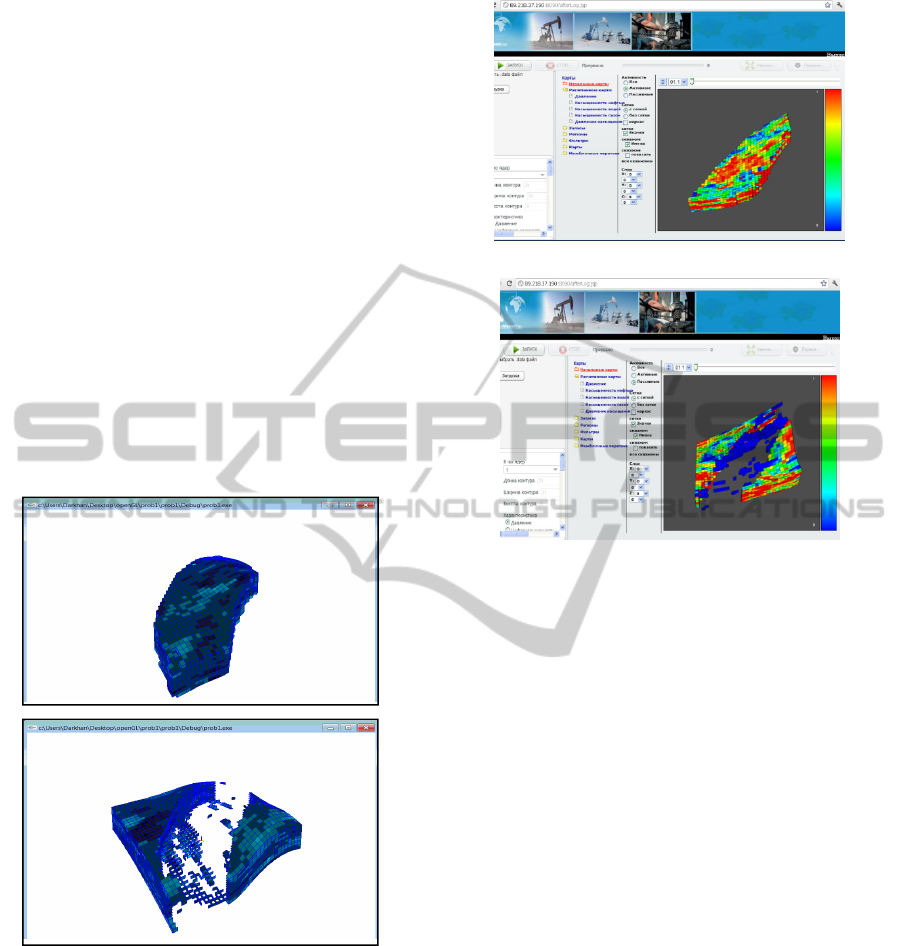
The visualization module is presented in two
ways:
1) As a desktop application which uses hardware
resources of the client computer and is not integrated
into the basic program. It is implemented using
OpenGL graphics platform and C++ programming
language (figure 9).
2) As a Web-module running on the server
(supercomputer) and partially using hardware of
graphics subsystem of client computer. Visualization
is carried out on the basis of WebGL graphical
technology, with JavaScript, HTML5 web-
technologies (figure 10).
Figure 9: Desktop application, a) active and b) inactive
blocks of field.
(a)
(b)
Figure 10: Web application, a) active and b) inactive
blocks of field.
To automatically connect and run calculations on
a supercomputer Java interface (MPJ-Express) with
the support of a hybrid parallelization on OpenMP
and MPI is developed
.
3 CONCLUSIONS
A mathematical model of oil displacement process
by polymer-surfactant injection is considered and
solved, taking into account the dependence of
solution viscosity on salt, surfactant and polymer
concentrations and where viscosity of both phase are
depends on temperature.
System of equations is solved using
implicit/explicit methods and following numerical
results were obtained: distribution of pressure,
saturation distribution of both phases, salt, surfactant
and polymer concentration and temperature
distribution in reservoir.
The module of polymer injection analysis of
distributed information system for analysis of oil
field development with operational monitoring in
real time and possibility of computing via remote
access or Internet.
Designofi-FieldsSystemComponent:ComputerModelofOil-RecoverybyPolymerFlooding
515

Proposed simulator has ability to calculate on
heterogeneous intercluster environment using
special NumGrid software.
The polymer injection process into the oil
reservoir for enhanced oil recovery can be modeled
using proposed simulator. Presented results shows
good consistence compared with results of the
hydrodynamic simulator Eclipse (Black Oil).
If you do not use chemicals, you can provide
little economic benefit. But the rejection of the
development of such schemes does not lead to the
desired oil recovery factor. On the one hand,
increasing the concentration of chemicals leads to a
non-linear increase of oil production, and on the
other hand, increase the costs, because the used
chemical reagents are not cheap. Consequently, it is
necessary to choose the optimum concentration of
reagents, for economic efficiency.
REFERENCES
Akhmed-Zaki D. Zh., Danaev N. T., Mukhambetzhanov S.
Т., Imankulov T., 2012. Analysis and Evaluation of
Heat and Mass Transfer Processes in Porous Media
Based on Darcy-Stefan's Model. ECMOR XIII,
Biarritz, France, 10-13 September, 122.
Babalyan G. А., Levy B. I., Tumasyan А. B., Khalimov
E.М., 1983. Oilfield development using surfactants.
Мoscow: Nedra.
Matkerim Bazargul, Darhan Akhmed-Zaki, Manuel
Barata, Development High Performance Scientific
Computing Application Using Model-Driven
Architecture, Applied Mathematical Sciences, Vol. 7,
2013, no. 100, 4961 – 4974.
Fathaddin M.T., Nugrahanti A., Buang N.P., Elraes K.A.
Surfactant-polymer flooding performance in heteroge-
neous two-layered porous media. IIUM Engineering
Journal, Vol 12, No 1, – 2011, – P. 31-38.
Flory P.J., 1953. Principles of polymer chemistry. Cornell
University Press.
Imankulov Timur, Danil Lebedev, Kanat Aidarov, Olzhas
Turar. Design of HPC system for analysis the gel-
polymer flooding of oil fields. Contemporary
Engineering Sciences, Vol. 7, 2014, no. 27, 1531-
1545.
Lake L.W., 1989. Enhanced oil recovery. New Jersey:
Prentice Hall Inc.
Rai K, Johns T. R., Delshad M., Lake W. L., Goudarzi A.
Oil-recovery predictions for surfactant polymer
flooding. Journal of Petroleum Science and
Engineering. – № 112 (2013), – P. 341–350.
Samarskii А. А., Gulin А. V., 1989. Numerical methods.
Moscow: Nauka.
Sorbie K. S., 1991. Polymer improved oil recovery. Boca
Raton: CRC Press.
Wegner J., Ganzer L., 2012. Numerical simulation of oil
recovery by polymer injection using COMSOL.
Proceeding of the COMSOL conference, Milan.
www.software.slb.com/products/foundation/Pages/eclipse.
aspx.
www.rfdyn.com/ru/technology/
www.smartfields.stanford.edu/about.
ICINCO2015-12thInternationalConferenceonInformaticsinControl,AutomationandRobotics
516
