
Efficient Exploration of Linked Data Cloud
Jakub Klímek
1
, Martin Ne
ˇ
caský
1
, Bogdan Kostov
2
, Miroslav Blaško
2
and Petr K
ˇ
remen
2
1
Faculty of Mathematics and Physics, Charles University in Prague, Praha, Czech Republic
2
Faculty of Electrical Engineering, Czech Technical University in Prague, Praha, Czech Republic
Keywords:
Linked Data, RDF, SPARQL, Exploration, Visualization.
Abstract:
As the size of semantic data available as Linked Open Data (LOD) increases, the demand for methods for
automated exploration of data sets grows as well. A data consumer needs to search for data sets meeting
his interest and look into them using suitable visualization techniques to check whether the data sets are
useful or not. In the recent years, particular advances have been made in the field, e.g., automated ontology
matching techniques or LOD visualization platforms. However, an integrated approach to LOD exploration is
still missing. On the scale of the whole web, the current approaches allow a user to discover data sets using
keywords or manually through large data catalogs. Existing visualization techniques presume that a data set
is of an expected type and structure. The aim of this position paper is to show the need for time and space
efficient techniques for discovery of previously unknown LOD data sets on the base of a consumer’s interest
and their automated visualization which we address in our ongoing work.
1 INTRODUCTION
Recently, the amount of semantic data available on
the Web has increased dramatically, especially thanks
to the Linked Open Data initiative (LOD) (Heath and
Bizer, 2011) which builds the so called LOD cloud.
The LOD cloud is a large distributed ecosystem of
interlinked semantic data. It is getting bigger every
year – it has grown from 300 data sets in 2011 to
more than 1000 data sets in 2014 which contain ap-
prox. 100 billions of entries
1
. Originally, LOD was
hoped to become the first successful realization of the
semantic web (Berners-Lee et al., 2001). It involves
semantically integrated data cloud capable of expres-
sive queries for data search. However, the current
LOD cloud has low quality and the established links
among data entities are often too conservative to al-
low integrated semantic exploration. Combined with
the rising amount of data, it becomes clear that the
LOD in their current form are still hard to explore,
leaving the semantic integration responsibility to their
consumers (Jain et al., 2010). Due to this fact, the
LOD cloud is not ready for direct crawling/exploring
of the data (see e.g. LDSpider (Isele et al., 2010)).
On the other hand, typical data consumers (develop-
ers, data analysts, etc.) usually do not need to search
for particular data directly. More often, they need to
1
http://lod-cloud.net/
find data sets which contain potentially relevant data
for their application or data analysis. For example, a
consumer may need to find statistical data sets which
measure demography indexes in regions of the Czech
Republic. In particular, a consumer needs a service
which enables him to express his interest (i.e. the
specification of data sets he looks for) and returns a
(small enough) set of data sets which correspond to
the interest. He also needs to understand interrela-
tions of the found data sets using a proper visualiza-
tion of those interrelations. He then needs to evaluate
their relevance by means of their proper visualization
and exploring their content. Often, after he obtains
the visualized content, he needs to refine his interest
and repeat the exploration steps. In other words, the
service must allow him to work in iterations.
We call the process of searching for data sets the
LOD exploration and the service which enables it the
LOD exploration service. To enable efficient LOD
exploration, three fundamental questions must be an-
swered. (1) In which form the data consumer should
formulate his interest? (2) How a (small enough) set
of data sets corresponding to the consumer’s interest
should be found on the base of the formulated inter-
est? (3) How should the service offer a proper visu-
alization of the found data sets so that the consumer
can look inside and decide whether he needs them or
not?
Klímek J., Ne
ˇ
caský M., Kostov B., Blaško M. and K
ˇ
remen P..
Efficient Exploration of Linked Data Cloud.
DOI: 10.5220/0005558002550261
In Proceedings of 4th International Conference on Data Management Technologies and Applications (DATA-2015), pages 255-261
ISBN: 978-989-758-103-8
Copyright
c
2015 SCITEPRESS (Science and Technology Publications, Lda.)

1.1 Motivating Example
Let us look at the process of LOD exploration from
the consumer’s point of view. Let us say that a con-
sumer builds a web application which deals with pub-
lic institutions in the EU. Therefore, his interest is to
explore the LOD cloud in order to find suitable data
sets with data about public institutions in the EU. He
expresses this interest and provides it to the LOD ex-
ploration service. The service returns a set of data
sets which potentially meet the interest. The data sets
are annotated with a relevance with respect to the in-
terest. The consumer picks several relevant data sets
and the service chooses their appropriate visualization
automatically. Moreover, the service informs the con-
sumer that it could be possible to better visualize the
institutions on a map but a data set with a mapping
of addresses of public institutions to GPS coordinates
is needed. The consumer likes this idea and extends
his interest with a requirement for such data set. This
starts a new iteration of the exploration process. The
service discovers new data sets with GPS coordinates
and narrows down the previously discovered data sets
with public institutions – only those which are linked
to some new found data set with GPS coordinates re-
main in the result. Moreover, it provides a visualiza-
tion of public institutions in the data sets on a map
using the GPS coordinates. The current approaches
require the consumer to know the data sets in advance
and create the visualization manually. It is not possi-
ble to discover and visualize the data sets in a dynamic
way described above.
1.2 Purpose of Our Work
We see a need for a formal foundation of the LOD ex-
ploration service. In particular, a formal model of the
LOD exploration service needs to be defined, includ-
ing its expected features and behavior. A formalism
for expressing consumer’s interest and specification
of available visualization techniques will be part of
this model. We aim to develop time and space ef-
ficient algorithms for matching consumer’s interest
against the LOD cloud and algorithms for matching
the discovered data sets with available visualization
techniques. The importance of the proposed problem
lies in the fact that there are currently many initia-
tives (research, governmental, driven by private sec-
tor) which publish their data sets in the LOD cloud.
All of them expect that wide audience of data ana-
lysts and application developers will exploit the pub-
lished data sets in various unexpected ways. How-
ever, the complexity of the LOD exploration signifi-
cantly reduces the possible benefits of the LOD cloud
and wastes the investments made to the LOD cloud by
the publishers. The LOD exploration service will en-
able consumers to find the right data sets to fulfill their
needs much more easily. In this paper we describe our
ongoing work and our aims for the near future.
2 STATE OF THE ART
Recent survey by Marie et al. (Marie and Gandon,
2015) splits evolution of Linked Data based explo-
ration research into multiple phases represented by
corresponding exploration systems – browsers, rec-
ommenders and exploratory search systems (ESS). In
the early phases of the semantic web (2001-2007),
browsing paradigms convenient for small size and
relatively homogeneous data sets were investigated
– e.g. text-based browsers inspired by classical
web browsers, visualization-based (graph) browsers,
and faceted browsers. Later, LOD (2007) elevated
new browsing paradigms reflecting higher quality,
rising size and wide domain coverage of the DB-
Pedia and Freebase data sets. One of the first
Linked Data browsers is Explorator (Araujo et al.,
2009). Subsequently, other browsers appeared, like
Hide the stack (Dadzie et al., 2011) (SPARQL query
templates-based), or rdf:SynopsViz (Bikakis et al.,
2014) (faceted-browser generator based on SPARQL
endpoints analysis). Another exploration tool is Free-
base Parallax
2
, which offers advanced visualizations
like timelines, or maps, but works with a fixed data
source – Freebase. Semaplorer (Schenk et al., 2009)
is a tourist domain exploration mashup based on mul-
tiple large data sets providing 4 different types of
facets (person, time, tag and location). Facete is a
JavaScript SPARQL-based faceted search library for
an arbitrary SPARQL endpoint. The next shift ac-
cording to Marie et al. were recommenders that ex-
pose computed links like intra-domain, resp. cross-
domain semantic similarities. The most recent re-
search concentrates on ESS, which extends recom-
menders with more advanced functionalities. Marie
et al. differentiate between a view-based ESS (allows
user to define views on the data set) and an algorithm-
based ESS (uses semantics to select a small amount of
computed relations such as similarity or relatedness
instead of the original graph).
Neither of the discussed exploration systems is
capable of realizing the use case described in Sec-
tion 1.1, being unable to provide discovery and vi-
sualization on the data set level. Particular techniques
for data set discovery and visualization relevant to our
2
http://parallax.freebaseapps.com

work are surveyed in sections 2.1 and 2.2. Section 2.3
describes our previous work on the Linked Data Vi-
sualization Model (LDVM) which we will extended
within the exploration scenario.
2.1 Data Set Discovery Techniques
W3C addressed the problem of dataset discoverabil-
ity by issuing the Data Catalog Vocabulary (DCV) as
a W3C Recommendation (Erickson and Maali, 2014)
in 2014. It provides a common vocabulary for data
cataloging tools, like CKAN, backing e.g. datahub.io.
The LOD data sets are registered within such data cat-
alogs, which are in turn registered within data catalog
registries such as dataportals.org. The lack of data
catalogs for large amount (Rakhmawati et al., 2013)
of datasources is addressed by data indexers, e.g.,
Sindice
3
. Each data catalog and data indexer provides
metadata (description) for data sets which can help in
data set discovery. In addition to DCV, there are other
vocabularies such as VoID(Cyganiak et al., 2011) for
describing metadata of the data set and its relations to
other data sets, LOV
4
for describing ontologies that
are used by the data set and VOAF
5
, extending LOV
with relationships to topic classifications.
A survey of systems using also statistical data can
be found in (Rakhmawati et al., 2013). E.g., Sindice’s
vocabulary for data sets and data set analytics
6
de-
scribes statistics about usage of classes and predicates
as well as their connections. In (Nikolov et al., 2012)
a semantic web index is utilized in order to identify
relevant data sets for interlinking and ranking them.
However, the current data set descriptions ignore on-
tological commitments of the contained data and lack
ontological foundation of different data set descrip-
tions together with user interests. During data set dis-
covery, ontology matching techniques (Shvaiko and
Euzenat, 2013) can help in producing links among
data sets. The paper (Leme et al., 2013) introduces
probabilistic exploration that looks for candidate data
sets for input ontologies based on probabilistic clas-
sifiers. Data sets are ranked according to the prob-
ability that links between input ontologies and can-
didate data sets can be found. Another approach
(de Oliveira et al., 2012) uses application specific
SPARQL queries and user’s feedback to filter and
rank relevant data sets.
The data set discovery scenario can be ideally im-
plemented as a query answering service over an in-
tegrated data set of data set descriptions. There are
3
http://sindice.com/
4
http://lov.okfn.org/
5
http://lov.okfn.org/vocommons/voaf/
6
http://vocab.sindice.net/
numerous techniques and tools that handle query an-
swering over a single data set, focusing on the trade-
off between expressiveness and computational com-
plexity. OWL 2 RL, QL and EL profiles (Motik
et al., 2009) are designed for tractable reasoning and
query answering, e.g. for Ontology Based Data Ac-
cess and Integration. Query engines for these profiles
are implemented in Stardog (Clark and Sirin, 2013)
and GraphDB (Ontotext, 2014). Querying more ex-
pressive ontologies is supported by in-memory query
evaluation engines like Pellet (Sirin et al., 2007), or
OWL2Query (Kremen and Kostov, 2012) augmenting
SPARQL conjunctive queries with OWL DL seman-
tics. Due to the model checking, these engines fight
with high time complexity (NEXPTime) and memory
consumption.
2.2 Data Set Visualization Techniques
More and more projects are focused on visualizing
Linked Data. A detailed survey of Linked Data visu-
alization techniques is by Dadzie and Rowe (Dadzie
and Rowe, 2011). There are several tools that visual-
ize data based on specific vocabularies. map4rdf sup-
ports faceted discovery of Spanish institutions and en-
ables the user to add a specific overlay containing sta-
tistical SCOVO-based data in a form of a timeline vi-
sualization. LinkedGeoData browser enables its users
to explore points of interest all over the world. Cube-
Viz (Ermilov et al., 2013) offers sophisticated Dat-
aCube vocabulary visualizations. FoaF Explorer
7
is
focused on visualizing FOAF profiles. ViDaX (Du-
mas et al., 2012) is a Java desktop Linked Data vi-
sualizer based on the Prefuse
8
visualization library.
Based on ontologies and property types, it suggest
suitable visualizations to its users. Tools like IsaViz
(Pietriga, 2002), Fenfire (Hastrup et al., 2008) and
RDF–Gravity
9
use the well-known node-link visual-
ization technique to represent a data set. IsaVis also
belongs to a group of tools implementing Fresnel -
Display Vocabulary for RDF
10
, which specifies how
a resource should be visually represented by Fresnel-
compliant tools.
2.3 Linked Data Visualization Model
Let us briefly describe the Linked Data Visualization
Model (LDVM) which we defined in our previous
work (Brunetti et al., 2013; Klímek et al., 2014). It
is an abstract visualization process customized for the
7
http://xml.mfd-consult.dk/foaf/explorer/
8
http://prefuse.org/
9
http://semweb.salzburgresearch.at/apps/rdf-gravity/
10
http://www.w3.org/2005/04/fresnel-info/
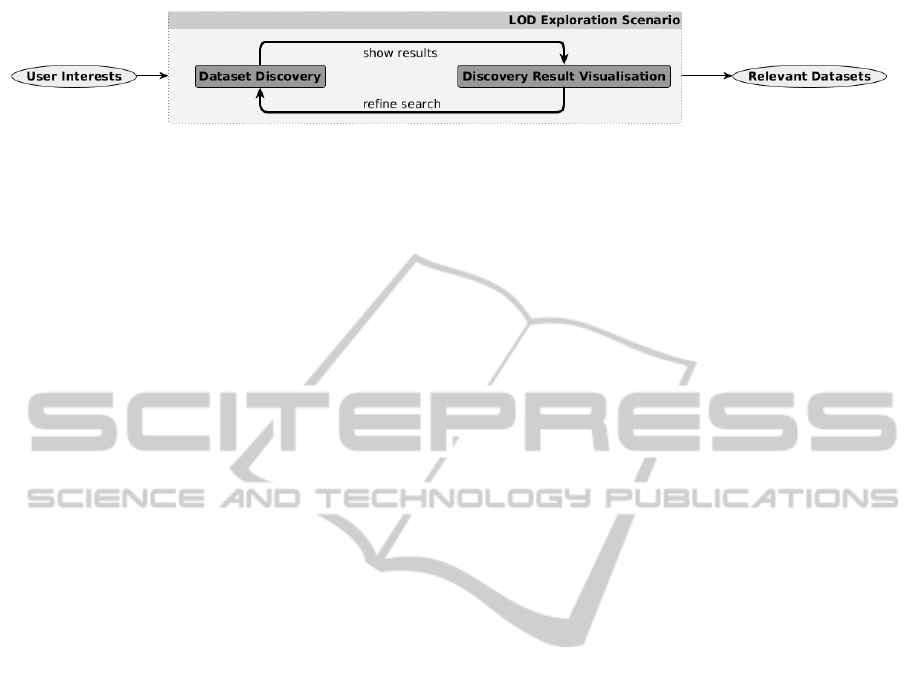
Figure 1: Linked Data Set Exploration Scenario.
specifics of Linked Data. In short, LDVM allows
users to create data visualization pipelines that con-
sist of four stages: Source Data, Analytical Abstrac-
tion, Visualization Abstraction and View. The aim
of LDVM is to provide means of creating reusable
components at each stage that can be put together to
create a pipeline even by non-expert users who do
not know RDF. The idea is to let expert users to cre-
ate the components by configuring generic ones with
proper SPARQL queries and vocabulary transforma-
tions. In addition, the components are configured in
a way that allows the LDVM implementation to au-
tomatically check whether two components are com-
patible or not. If two components are compatible,
then the output of one can be connected to the input
of the other in a meaningful way. With these com-
ponents and the compatibility checking mechanism
in place, the visualization pipelines can then be cre-
ated by non-expert users. What is missing is a proper
ontological model for description of the components
and their bindings, expressive component compati-
bility descriptors and efficient compatibility checking
algorithms that would scale to the magnitude of the
LOD cloud. There are also recent approaches similar
to LDVM. LDVizWiz (Atemezing and Troncy, 2014)
is a LDVM-like approach to detecting categories of
data in given SPARQL endpoints and extracting ba-
sic information about entities in those categories. A
lightweight application of LDVM in enterprise is de-
scribed in LinDa (Thellmann et al., 2014).
3 IDENTIFIED OBJECTIVES
We aim at defining a formal model of the LOD ex-
ploration scenario and corresponding service depicted
in Figure 1. The scenario consists of two fundamental
activities:
Discover. A user provides a description of his inter-
ests. This is an approximation of questions he
needs to answer by combining some datasets, un-
known to him in advance. The LOD exploration
service provides a set of datasets corresponding
to the description. Here, we integrate and further
extend approaches mentioned in Section 2.1.
Visualize. The LOD exploration service automat-
ically chooses visualizations suitable for the
datasets discovered in the previous step and offers
the visualizations to the user who can view the
datasets from different viewpoints (different suit-
able visualizations) and choose datasets that best
suit his interests. Here we integrate and further
extend approaches mentioned in Sections 2.2 and
2.3.
Our approach can be classified as algorithm-based
exploratory search in the data set space. To cover
the described LOD exploration scenario, we aim at
achieving three objectives in our work.
3.1 Objective 1: Efficient Dataset
Discovery in LOD Cloud
The first objective is to design techniques and algo-
rithms for data set discovery in LOD, improving se-
lectivity and relevance comparing to current (typi-
cally keyword-based) techniques, as discussed in Sec-
tion 2.1. In particular, we will address the following
questions:
• How to improve Linked Data Set Discovery
(LDSD) ?
• How to formalize user interests for the purpose of
LDSD ?
• What are the missing data set characteristics suit-
able for LDSD and what is their nature (syntacti-
cal, structural, ontological) ?
• How efficient would it be to equip data sets with
the new characteristics ? Which characteristics
can be created automatically ?
To achieve this we consider the scenario depicted
in Figure 2. First, we analyze the dataset typol-
ogy of the LOD cloud, formalize the dataset dis-
covery scenario in terms of newly designed ontolog-
ical model of datasets, and define related user in-
terest queries. The designed ontological model al-
lows us to research and identify practically applicable
data set descriptors taking into account their correct-
ness/completeness/accuracy, minimal descriptor size,
maximal information capacity, user-intuitiveness, as
well as minimal resource consumption during cre-
ation. Dataset descriptors of different nature will be
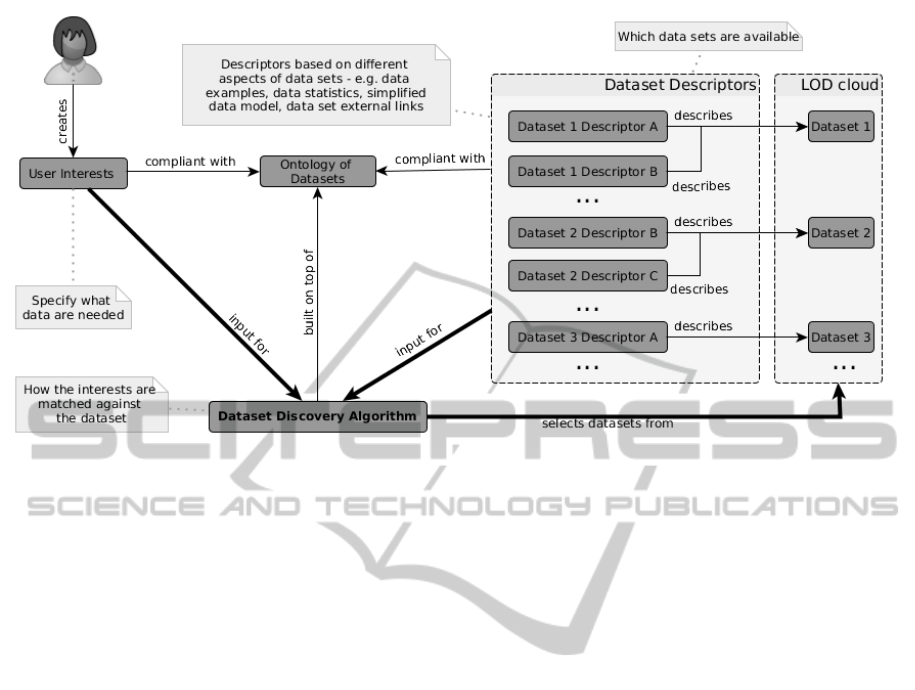
Figure 2: Linked Data Set Discovery Scenario.
considered, involving e.g. meta-data schemas, data
set statistics, data set subset w.r.t. a top-level ontol-
ogy, or extracted keyword list. The model will be di-
vided into two parts. The first part is a general de-
scription of the LOD data sets and other entities such
as people, organizations and their relationships and
roles such as data set publisher and producer. This
model will be based on an analysis of the LOD cloud
and related data set typology. The second part of the
model describes a LOD data set from the perspective
of the data set discovery, involving the user interest
and data set descriptor model. This model will be
based on a conceptualization of data set cataloging
techniques, as well as ontology-based data set inte-
gration and ontology alignment techniques covered in
Section 2.1. This portfolio of techniques will allow
us to define descriptors of different nature in order
to capture fundamental intra-dataset and inter-dataset
semantic relationships.
Our next goal is to design the data set discov-
ery algorithm that selects a relevant small set of
data set descriptors according to the user interests.
To achieve this, the discovery algorithm will make
use of a unique combination of expressive ontolog-
ical queries and ontology alignment techniques tak-
ing into account different nature of the designed de-
scriptors. Currently, the most theoretical research fo-
cuses on individual features, see Section 2.1. We
will concentrate on the theoretical analysis leading
towards the design and development of tractable and
scalable algorithms for suitable combinations of these
features. Our previous work (Kremen and Kostov,
2012) already supports SPARQL conjunctive queries
using OWL DL 2 entailment regime. We will extend
it to support features reflecting the requirements of
the user interest model, and design suitable optimiza-
tion techniques. This involves e.g. identification and
grouping of potentially complement (w.r.t. the user
interest) data sets in the search result, or ordering the
data sets in the search result according to user inter-
ests match.
3.2 Objective 2: Dynamic Dataset
Visualization
Once the user discovers a reasonable number of data
sets using techniques from the previous objective, he
wants to see a visualization of the discovery results
(see Figure 1). Such discovery result visualization
should present the discovered data sets and relation-
ships among them, together with their mapping to
the expressed interest. This helps the consumer with
deciding which data sets should be explored further.
Next, the user needs to look inside the discovered data
sets and decide whether he can use them to achieve his
goals. The objective is to propose a dynamic data set
visualization approach which identifies suitable visu-
alizations of discovered data sets and presents them to
the user. The suitable visualizations need to be identi-
fied automatically and on demand based on the char-
acteristics of the discovered data sets and available vi-
sualization components. There is no static mapping
between a data set and a visualization. For each vi-
sualizer, the developed ontology model will describe
its inputs, each associated with data structures needed

for producing the desired visualization, and the kind
of visualization the visualizer produces. The formal
specification of available visualizers will enable our
algorithms to present visualizers suitable for discov-
ered data sets to the user and inform him about the
kinds of visualizations he can obtain and what addi-
tional data sets must be discovered for their full func-
tionality (see Section 1.1 for an example). To achieve
this, the algorithms will analyze the descriptors of the
discovered data sets, available transformers and visu-
alizers and generate their binding (so called visual-
ization pipeline) that leads to the visualization. The
model will also conceptualize possible kinds of rela-
tionships between discovered data sets and the user
interest. Without such technique, the user would have
to identify the pairings between data sets and visual-
izers and build the visualization pipelines manually.
One additional problem needs to be solved to
achieve this objective. It can be useful to apply a
given visualization component to a certain data set
and yet the descriptors of both can mismatch and
therefore the pairing will not be identified. To ad-
dress this problem we will extend the solution with
components able to transform data structures to other
data structures. The approach will be based on and
will extend our former LDVM approach described in
Section 2.3.
3.3 Objective 3: Experimental
Evaluation of the Methods
The last objective is to evaluate achievements of Ob-
jectives 1 and 2 in a real environment. The achieve-
ments will be implemented in a form of a prototypical
LOD exploration service and evaluated on two sce-
narios. First, we will evaluate the prototype on the
Czech LOD cloud, involving data sets published by
the OpenData.cz initiative as well as data sets created
by other national projects. Although it contains just
10s of data sets with approx. 1 billion of records, their
users still face problems addressed by our work. Our
familiarity with the local Czech LOD cloud allows us
to define expected behavior of the evaluated LOD ex-
ploration service and compare its real behavior to the
expected one. Second, we will evaluate the prototype
on a representative part of the whole LOD cloud. This
evaluation will be on the data sets which are not un-
der our control and come from different sources. It
will enable us to experimentally evaluate the achieve-
ments and demonstrate situations of data consumers
who do not know the explored data sets in advance.
The prototype will consist of a data set descriptor
storage and an implementation of the designed algo-
rithms in the form of a query engine. The storage
will be realized using existing OWL 2 databases, like
GraphDB, or Stardog, see Section 2.1. We will pop-
ulate the storage with descriptors which will be cre-
ated manually or automatically, based on the descrip-
tor type and the quality of data set and its metadata.
We will evaluate descriptor characteristics like com-
pleteness/accuracy, etc. (see Section 3.1). The proto-
type implementation will also include the developed
algorithms for dynamic data set visualization. Partic-
ular visualizers needed to demonstrate usefulness of
our approach on a selected set of LOD cloud data sets
will not be developed from scratch – existing visual-
ization libraries, e.g. D3.js, will be reused. Using the
prototype implementation, we will verify that the user
can comfortably view the results of data set discovery
and gain a visual overview of each one that will enable
him to decide whether the offered data set is useful.
4 CONCLUSIONS
In this paper we described our ongoing work towards
a Linked Data exploration service, which will also in-
clude visual insights into the discovered data sets. We
aim at supporting users in their search for usable data
sets in the Linked Data Cloud as we can currently see
that this problem is becoming increasingly important.
We base our approach on formal ontological model of
data sets and on algorithms for automatic matching of
user requirements and data sets.
ACKNOWLEDGEMENTS
This work was partially supported by a grant from the
European Union’s 7th Framework Programme num-
ber 611358 provided for the project COMSODE.
REFERENCES
Araujo, S., Shwabe, D., and Barbosa, S. (2009). Ex-
perimenting with Explorator: a Direct Manipulation
Generic RDF Browser and Querying Tool. In WS on
Visual Interfaces to the Social and the Semantic Web.
Atemezing, G. A. and Troncy, R. (2014). Towards a Linked-
Data based Visualization Wizard. In 5th Interna-
tional Workshop on Consuming Linked Data (COLD
2014), volume 1264 of CEUR Workshop Proceedings.
CEUR-WS.org.
Berners-Lee, T., Hendler, J., and Lassila, O. (2001). The
semantic web. Scientific American, 284(5):34–43.
Bikakis, N., Skourla, M., and Papastefanatos, G. (2014).
rdf:SynopsViz – A Framework for Hierarchical
Linked Data Visual Exploration and Analysis. In The

Semantic Web: ESWC 2014 Satellite Events, LNCS,
pages 292–297. Springer International Publishing.
Brunetti, J. M., Auer, S., García, R., Klímek, J., and
Ne
ˇ
caský, M. (2013). Formal Linked Data Visu-
alization Model. In Proceedings of the 15th In-
ternational Conference on Information Integration
and Web-based Applications & Services (IIWAS’13),
pages 309–318.
Clark, K. and Sirin, E. (2013). On rdf validation, stardog
icv, and assorted remarks. In RDF Validation Work-
shop. Practical Assurances for Quality RDF Data,
Cambridge, MA, Boston (September 2013), W3C,
http://www. w3. org/2012/12/rdf-val.
Cyganiak, R., Zhao, J., Hausenblas, M., and Alexan-
der, K. (2011). Describing linked datasets
with the VoID vocabulary. W3C note, W3C.
http://www.w3.org/TR/2011/NOTE-void-20110303/.
Dadzie, A.-S. and Rowe, M. (2011). Approaches to visual-
ising linked data. Semantic Web, 2(2):89–124.
Dadzie, A.-S., Rowe, M., and Petrelli, D. (2011). Hide the
Stack: Toward Usable Linked Data. In Antoniou, G.,
Grobelnik, M., Simperl, E., Parsia, B., Plexousakis,
D., De Leenheer, P., and Pan, J., editors, The Seman-
tic Web: Research and Applications, volume 6643 of
LNCS, pages 93–107. Springer.
de Oliveira, H. R., Tavares, A. T., and Lóscio, B. F. (2012).
Feedback-based data set recommendation for building
linked data applications. In Proceedings of the 8th
International Conference on Semantic Systems, pages
49–55. ACM.
Dumas, B., Broché, T., Hoste, L., and Signer, B. (2012).
Vidax: An interactive semantic data visualisation and
exploration tool. In Proceedings of the International
Working Conference on Advanced Visual Interfaces,
AVI ’12, pages 757–760, New York, NY, USA. ACM.
Erickson, J. and Maali, F. (2014). Data cata-
log vocabulary (DCAT). W3C recommendation,
W3C. http://www.w3.org/TR/2014/REC-vocab-dcat-
20140116/.
Ermilov, I., Martin, M., Lehmann, J., and Auer, S. (2013).
Linked open data statistics: Collection and exploita-
tion. In Klinov, P. and Mouromtsev, D., editors,
Knowledge Engineering and the Semantic Web, vol-
ume 394 of Communications in Computer and Infor-
mation Science, pages 242–249. Springer.
Hastrup, T., Cyganiak, R., and Bojars, U. (2008). Browsing
Linked Data with Fenfire. In Linked Data on the Web
(LDOW2008) workshop, in conjunction with WWW
2008 conference.
Heath, T. and Bizer, C. (2011). Linked Data: Evolving the
Web into a Global Data Space, volume 1.
Isele, R., Umbrich, J., Bizer, C., and Harth, A. (2010). Ld-
spider: An open-source crawling framework for the
web of linked data. In CEUR Workshop Proceedings,
volume 658, pages 29–32.
Jain, P., Hitzler, P., Yeh, P. Z., Verma, K., and Sheth, A. P.
(2010). Linked data is merely more data. Linked Data
Meets Artificial Intelligence. Technical Report SS-10-
07, AAAI Press, page 82–86.
Klímek, J., Helmich, J., and Ne
ˇ
caský, M. (2014). Applica-
tion of the Linked Data Visualization Model on Real
World Data from the Czech LOD Cloud. In Bizer, C.,
Heath, T., Auer, S., and Berners-Lee, T., editors, Pro-
ceedings of the Workshop on Linked Data on the Web
co-located with the 23rd International World Wide
Web Conference (WWW 2014), Korea, volume 1184
of CEUR Workshop Proceedings. CEUR-WS.org.
Kremen, P. and Kostov, B. (2012). Expressive OWL
Queries: Design, Evaluation, Visualization. Interna-
tional Journal On Semantic Web and Information Sys-
tems.
Leme, L. A. P. P., Lopes, G. R., Nunes, B. P., Casanova,
M. A., and Dietze, S. (2013). Identifying candidate
datasets for data interlinking. In Web Engineering,
pages 354–366. Springer.
Marie, N. and Gandon, F. (2015). Survey of linked data
based exploration systems. In IESD 2014-Intelligent
Exploitation of Semantic Data.
Motik, B., Parsia, B., and Patel-Schneider, P. F. (2009).
OWL 2 Web Ontology Language Structural Specifi-
cation and Functional-Style Syntax. {W3C} recom-
mendation, W3C.
Nikolov, A., d’Aquin, M., and Motta, E. (2012). What
should i link to? identifying relevant sources and
classes for data linking. In The Semantic Web, pages
284–299. Springer.
Ontotext (2014). GraphDB – An Enterprise Triplestore with
Meaning.
Pietriga, E. (2002). IsaViz: a Visual Environment for
Browsing and Authoring RDF Models. In WWW
2002, the 11th World Wide Web Conference, Hon-
olulu, Hawaii, USA. World Wide Web Consortium.
Rakhmawati, N. A., Umbrich, J., Karnstedt, M., Hasnain,
A., and Hausenblas, M. (2013). Querying over feder-
ated sparql endpoints—a state of the art survey. arXiv
preprint arXiv:1306.1723.
Schenk, S., Saathoff, C., Staab, S., and Scherp, A. (2009).
SemaPlorer—interactive semantic exploration of data
and media based on a federated cloud infrastructure.
Web Semantics: Science, Services and Agents on the
World Wide Web, 7(4):298–304.
Shvaiko, P. and Euzenat, J. (2013). Ontology matching:
state of the art and future challenges. Knowledge and
Data Engineering, IEEE Transactions on, 25(1):158–
176.
Sirin, E., Parsia, B., Grau, B. C., Kalyanpur, A., and Katz,
Y. (2007). Pellet: a Practical OWL-DL Reasoner. J.
Web Sem., 5(2):51–53.
Thellmann, K., Orlandi, F., and Auer, S. (2014). LinDA -
Visualising and Exploring Linked Data. In Proceed-
ings of the Posters and Demos Track of 10th Inter-
national Conference on Semantic Systems - SEMAN-
TiCS2014, Leipzig, Germany.
