
A Time Delay based Approach to Enhance Lung Diseases Diagnostic
Fatma Ayari
1
, Ali Alouani
2
and Mekki Ksouri
1
1
National Schoolof Engeneering, University of Tunis El Manar, B.P.342, Le Belvedere, 1002, Tunis, Tunisia
2
Electrical Engineering Department, Tennessee Technological University, PO Box 5004, TN 38 505, Cookeville, U.S.A.
Keywords: Passive Time Delay, Chronic Obstruction, Lung Sounds, Lung Signal Analysis, Multichannel.
Abstract: We are dealing with Chronic Obstructive Pulmonary Disease (COPD), using a new methodology based on
Passive Time Delay Technique (PTDT). Lung sounds were recorded using a multichannel stethoscope on 28
healthy subjects and 20 COPD patients. The sensors were distributed on the posterior and anterior chest
wall. During recordings, all participants were breathing at matching airflow rates. Calculated time delay
(TD) was identified for inspiration phase and an average TD value was provided after three repetitive meas-
urements for each inspiration phase. TD computed in COPD patients: 440 ± 87 % (P < 0.05) was remarka-
bly greater than time delay computed with normal subjects: 160 ± 10 % (P < 0.05). Results were presented
as mean ± SD, standard deviation of time delay in ms. Significant P values (P < 0.05) were indicated using
Wilcoxon test. Preliminary results are very encouraging to develop this technique and enhance COPD moni-
toring.
1 INTRODUCTION
Gas propagation in complex pathways of the respira-
tory system is accompanied by the spreading of
lungsounds that can be collected in various regions
of the thorax. Moreover, lung sounds are usually
mixed with heart sounds and tissues sounds, caused
by any change of the chest movements, during res-
piratory cycles.
Generally, purely lung signals are highly corre-
lated with mechanical gases vibration along the
different pathways as it was mentioned by (Meirav,
2009) and (Kraman, 1984), in their studies. Addi-
tional noisy signals must be filtered before dealing
with lung signal analysis.
Capturing lung signals using a multichannel
stethoscope was a frequent topic in the last decades.
Multiple researches were developed using both ac-
tive acoustic methods (AAM) and passive acoustic
methods (PAM).
The AAM consists to transmit a low frequency
sound into the chest via a loud speaker placed in the
patient’s mouth. Then, the delay and frequency re-
sponse of the lung are used to understand the sound
propagation inside the respiratory system (Wodicka,
1992).
The (PAM) consists on capturing lung sounds
from different sites of the chest via digital stetho-
scope without introducing any external sounds. This
dynamic method was used by different authors
(Dellinger, 2008) and (Mor, 2007) to analyze the
functional properties of different lung diseases. Dif-
ferent authors demonstrated that the PAM provides a
better interpretation of the biological signals and
adds more precision in the disease diagnose and
decision making. One of the most recent of those
authors is (Murphy, 2008).
In the present study we developed a time delay
approach based on the PAM to understand the nature
of lung sounds propagation in the case of an obstruc-
tive pulmonary disease such as COPD. We used the
concept of time delay which is motivated by the fact
that as the air travels from the mouth to different
lung fields, the travel time will depend on the level
of obstruction of the airways in the lung. By com-
paring the travel time of a healthy lung to that of
lung with COPD, one can detect airways obstruction
and the lung area where obstruction is occurring.
Abnormalities in the lung manifested by obstruc-
tions or restrictions are causing a local airflow per-
turbation inside the lung pathways providing an
abrupt change in the lung signals recorded over
multiple chest sites.
To estimate the time delay, the concept of signal
correlation was used. We developed an extended
approach for the time delay estimator that allows for
the localization of affected lung zones.
49
Ayari F., Alouani A. and Ksouri M..
A Time Delay based Approach to Enhance Lung Diseases Diagnostic.
DOI: 10.5220/0005546100490054
In Proceedings of the 12th International Conference on Signal Processing and Multimedia Applications (SIGMAP-2015), pages 49-54
ISBN: 978-989-758-118-2
Copyright
c
2015 SCITEPRESS (Science and Technology Publications, Lda.)
2 METHODOLOGY
The methodology adopted in this paper is based on a
mathematical model build using experimental data.
2.1 Experiments
The experimental data is given from our own data-
base. This database consists on lung sounds recorded
from normal patients and COPD patients having all
the following symptoms. Chronic bronchitis patients
have sputum production such that cough and sputum
for at least three months. Prior to recording lung
sound phases, we collected information about pa-
tients such as name, age, sex, BMI, and thorax size.
Experimental measurements of lung sounds were
tabulated in a database that contains smoking sub-
jects and non-smoking subjects. All participants in
these clinical experiments were asked to breathe
three times and we recorded breath sounds for inspi-
ration phases with time duration of 3 to 6 seconds.
They were also instructed to hold their breath for
few seconds and then to breathe easily before each
new signal recording. Most information about pa-
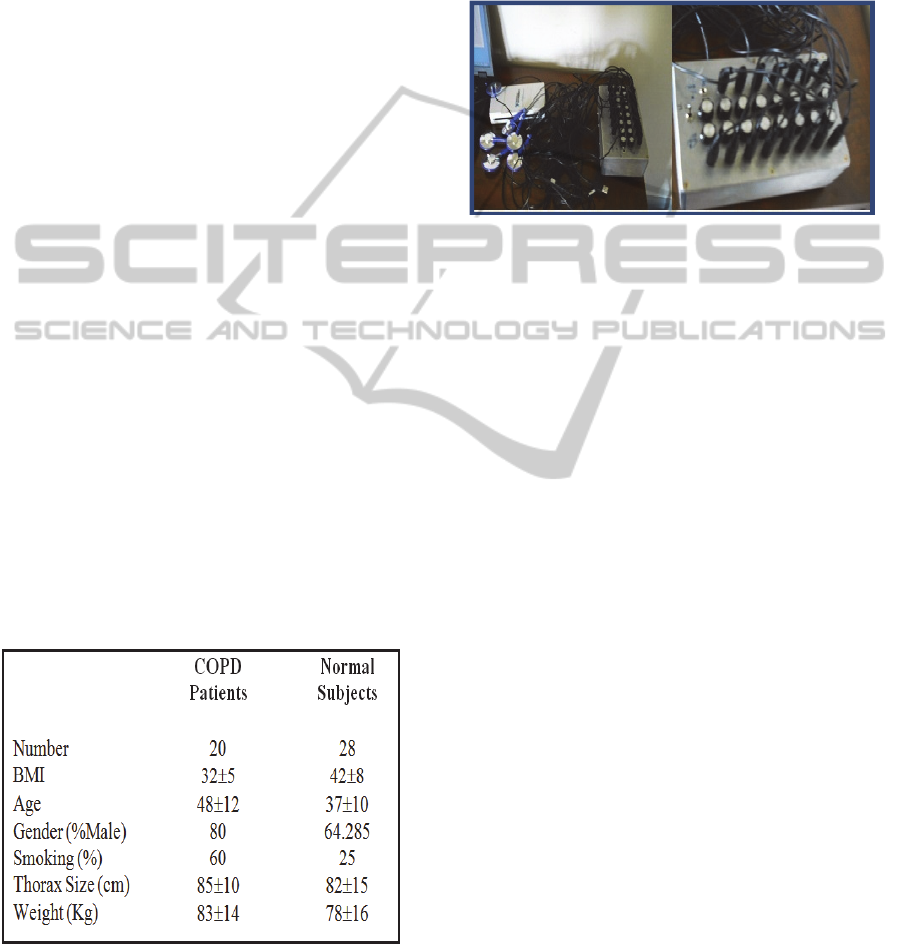
tients was outlined in Table 1.
All participants’ lung signals were recorded with
an 8-channel stethoscope. This instrument was fully
described in the following references (Alouani,
2011) and (Alouani, 2010). Figure1 show the multi-
channel stethoscope used in this study.
This instrument allowed recording lung sounds
during breathing, which are proportional to the gas
flow vibrations as postulated by (Kraman, 1984).
Table 1: Patient’s criteria.
The protocol of measurements was executed while
subjects were seated. The eight sensors were distrib-
uted as follow; four acoustic sensors on the front of
the chest and four acoustic sensors on the back. The
protocol of recording sounds consists of three
breathing cycles to unsure the consistency of the
recording sounds. Recorded signals include inspira-
tory phases and have a time duration ranging be-
tween 3s and 6s. The goal here was to quantify the
health state of patient’s lung using a new time delay
estimate (TDE) technique based on multichannel
lung sounds recording.
Figure 1: Multichannel lung sound system, Capture of the
detailed devices used in the multichannel sthetoscope
(sensors, I/O box of connexion and DAQ server).
2.2 Theoretical Procedure
After collecting data, a preprocessing is used. The
captured lung sounds were filtered using a variant of
Sgolay filtering algorithm that we developed in
references (Ayari, 2013) and (Ayari, 2012). We built
an array of sensors with a distance adjusted accord-
ing to the body size of the subject. The sounds were
acquired via the multichannel stethoscope at a sam-
pling frequency of 11 kHz.
Recorded lung sounds were then sent to comput-
er storage for processing. Collected lung sounds,
could then be displayed using appropriate Lab View
software. Then, they are converted into a digital
wave format and pre-processed so as to reduce noise
effect.
The acquisition of captured lung sounds from
multiple sites is conducted using a Lab View plat-
form. We developed then a program using Matlab
software to extract separate channels and to build the
correlation matrix of the eight sensors, after a filter-
ing process based on Sgolay algorithm. Further
details about the algorithm that we developed are
provided in the next section. A shot screen, of lung
signals captured during processing phase.
We developed in this study, a new methodology
that aims enhance COPD monitoring, based on time
delay produced between captured lung sounds. We
considered multiple time expanded lung waveforms
recorded from eight positions on the chest. For the
analysis and processing of time expanded wave-
forms, we built a matrix constituted with eight vec-
tors corresponding to the different collected time
SIGMAP2015-InternationalConferenceonSignalProcessingandMultimediaApplications
50
series of the eight signals.
As we are capturing airflow vibrations which are
transformed into electrical signals, digitized further,
and displayed on the shot screen as lung signals.
Airflow vibrations provoked with abrupt airflow
changes, (if any abnormality inside the lung tissues
occurred) may amplify the lung signal differently
and change its morphology. All depends on the
distance traced by the airflow inside the lung path-
ways; those vibrations reached the sensors at differ-
ent times. The correlation technique allows measur-
ing this time difference denoted by time delay be-
tween captured lung signals.
To compare time delays between sensors, it is
important to mention that any time delay estimator is
constrained to operate on observations of a finite
duration. Also a time delay estimator design is the
available amount of a priori knowledge of the cap-
tured signals and their noise statistics. Thus, the
common method to carry an estimate of the time
delay is to compute the cross correlation function
first between every couple of signals captured in two
different sensors. General cross correlation function
is used as a similarity measure function in signal
processing, that is described by equation (1) in con-
tinues signals f (t) and g (t) and equation (2) in dis-
crete time series.
f
∗g
n
f
∗
m
g
nm
(1)
f
∗g
n
∑
f
∗
m
gnm
∞
m∞
(2)
Where f
*
denotes the complex conjugate of the
function f.
As described in (Knapp, 1976), time delay, esti-
mated in the propagation between two signals across
a microphone array is deduced after calculating
cross correlation between both signals and pointing
in time the point corresponding to maximum of the
absolute value of the cross correlation function. This
time delay (denoted by D) between both signals is
defined as the argument of the maximum of the
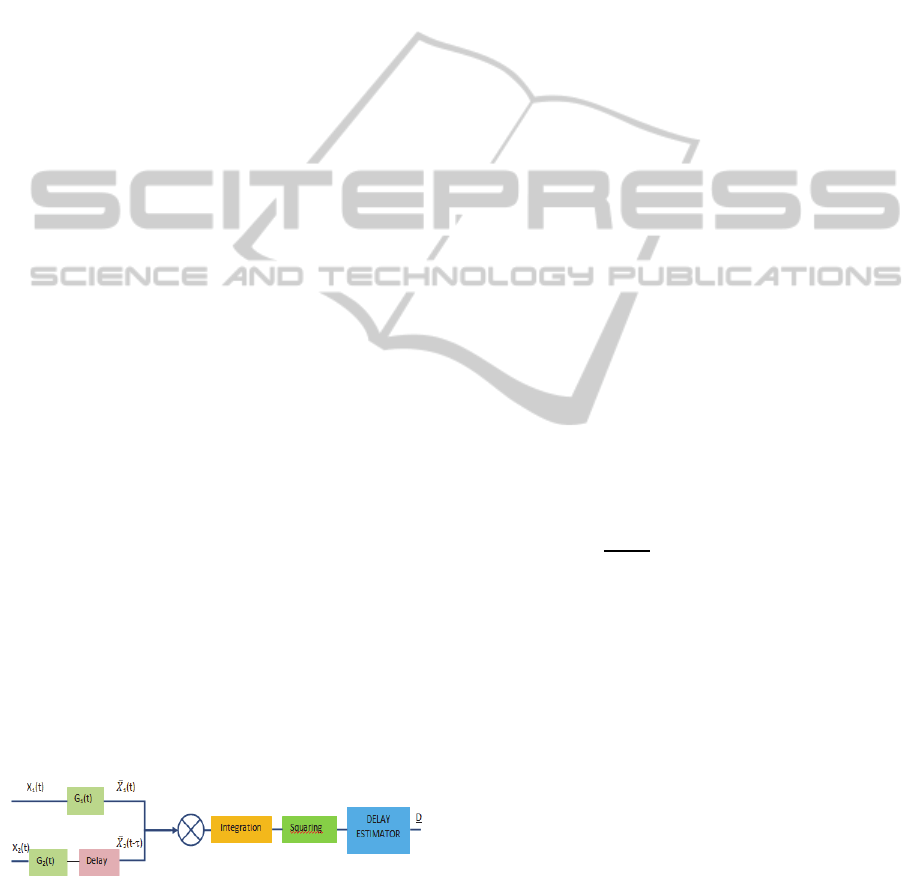
cross correlation function in Figure 2.
Figure 2: Received waveforms filtered, delayed, multi-
plied and integrated for a variety of delays until peak
output is obtained.
D argmax
f
∗g
t
(3)
Signals emanating from a particular lung source
mixed with a noise, at two spaced sensors can be
modeled as follows:
(4)
(5)
Where s
1
(t) is the lung signal, n
1
(t), and n
2
(t) are
noise signals associated to both positions and β is a
real parameter. It is assumed that the signal s
1
is
uncorrelated with noise signals n
1
and n
2
.
There are many theoretical approaches which are
proposed by researchers to estimate the time delay
using different refinement algorithms (Chan, 1980),
in order to improve the precision in calculating this
time delay based on cross correlation function. Some
of them are available in the case of stationary sig-
nals; the others can be employed in slowly varying
environments, where the characteristics of the sig-
nals and noise remain mainly stationary only for
finite observation time interval T.
For lung signals, we summarized the description
of the most important proposed algorithm applied in
the case of nearly stationary signals in very small
time intervals. Thus, the common method to carry an
estimate of the time delay is to compute the general
cross correlation function, which is given explicitly
between two signals
by the follow-
ing equations as mentioned by (Knapp, 1976):
,
(6)
In the case of a small sized observation interval
T, the cross correlation function takes the following
form:
,
1
(7)
As far as it is necessary to carry accurate values
of the estimate time delay D, it would be important
to undergo a preprocessing of both captured signals
.We consider the following filters
denoted with G
1
(t) and G
2
(t) as it is illustrated by
Figure 3. The outputs of the two filters G
1
(t) and G
2
(t) are denoted by̅
,̅
. The objective of such
filters is to smoothen and fine tune the cross correla-
tion signal so that the maximum peak of this func-
tion can be sharply defined and therefore the time
delay can also be accurately estimated.
The time shift yielding to the peak of the cross-
correlation function is an estimate of the time delay
D. Thus, to achieve a good and robust resolution of
the time delay estimate, the input signals must be
weighted.
Those weights are associated to several refine-
ment techniques for example the technique proposed
by (Chen, 2011) and the one due to (Kevin,
ATimeDelaybasedApproachtoEnhanceLungDiseasesDiagnostic
51
2006).Most techniques correspond to generalized
cross correlation which is conceptually consisting on
applying pre-equalization to the signals.
Performance of time delay estimation is strongly
affected with noise associated to the captured signal
and also to the length of the signal time interval. A
low SNR with a relatively extended time interval are
both key features for the performance of any refine-
ment TD estimator algorithm. Most of the time delay
refinement processors are expressed in the complex
domain and their explicit form is done with a Fourier
Transform relation. Thus, the cross power spectral
density described by the Fourier transform relation-
ship is given by equation (8) as mentioned by (Hyde,
1969) and (Georgiou, 1973).
(8)
Generalized correlation between
is
given by:
Ψ
(9)
Ψ
(10)
Among the different existing weight functions
(Kevin, 2006) and (Li, 2002) we selected the Phase
Transform weight algorithm denoted by
(PHAT).This algorithm uses a weighting function
described with equation (11):
(
11
)
In the case of non-correlated noiseG
f
0, the
cross correlation will be expressed as:
(12)
With:
=
(12a)
In fact, the phase transforms denoted with
(PHAT) (Kevin, 2006), is the most used weighting
algorithm and it is very interesting in the case of low
noise to signal ratios. The PHAT weighting is the
last step before calculating the estimate TD between
both signals.
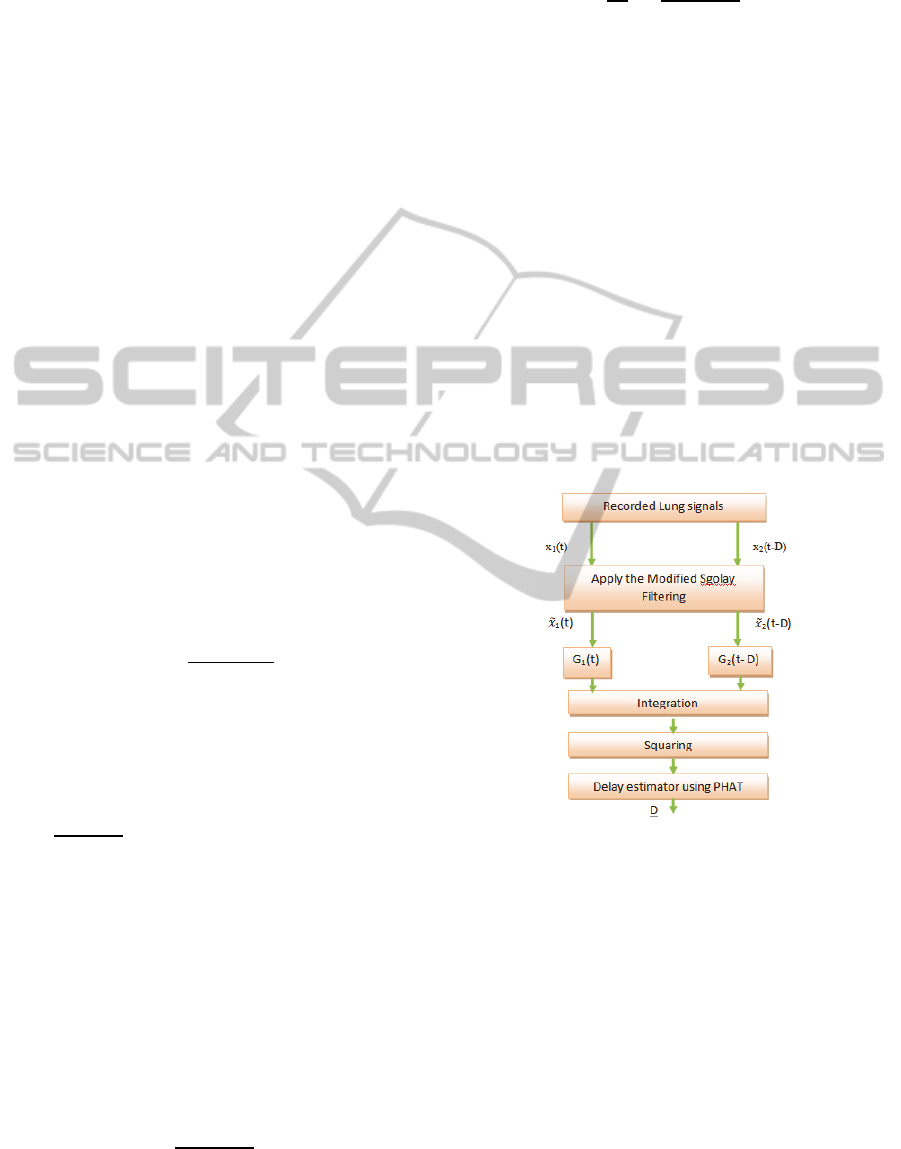
The different steps of our developed algorithm
are illustrated by Figure 3 which indicates the main
components of the TDE estimator as it is developed
in this study. The weight function applied to two
lung signals can be explicitly defined as:
Ψ
f
1
G
f
(13)
And their final form of weighted cross correla
tion function is defined as:
R
τ
1
2π
G
f
G
f
e
π
df
π
π
(14)
The PHAT weighting processor, used as the last
step of TD estimation in our methodology, is justi-
fied since it is one of the best weighting functions to
be selected in the case of non-stationary and noisy
signals as indicated in (Georgiou, 1973). To empha-
size the importance with applying such a procedure,
we computed the time delay using a general cross
correlation approach of two captured signals for one
COPD patient. Then, we applied the procedure de-
scribed above to estimate the time delay between
those two signals, Figure 4. We concluded from
Figure 4 (a) and Figure 4 (b), that our methodology
has effectively strengthened the basic features of the
signals. Figure 4 (b) shows clearly the difference
between general cross correlation technique (a) and
the enhanced correlation technique based on PHAT
algorithm. From Figure 4 (b), one can distinguish
clearly the improved accuracy, and the signals
sharpness of the residual peak.
Figure 3: Diagram of TD using our approach.
3 RESULTS
After calculating the time delay between all couple
of sensors, we saved the different time delay values
in a matrix denoted by the time delay estimator ma-
trix (TD
ij
). In this matrix, we saved the time delay
between two lung signals; among signals captured
via the 8 sensors. Columns and rows are correspond-
ing to the reference number of sensors. Each com-
ponent of the matrix (TD
ij
) corresponds to a TDE
between sensor i and sensor j where i =[1,2,…,8]
and j =[1,2,….,8].
SIGMAP2015-InternationalConferenceonSignalProcessingandMultimediaApplications
52
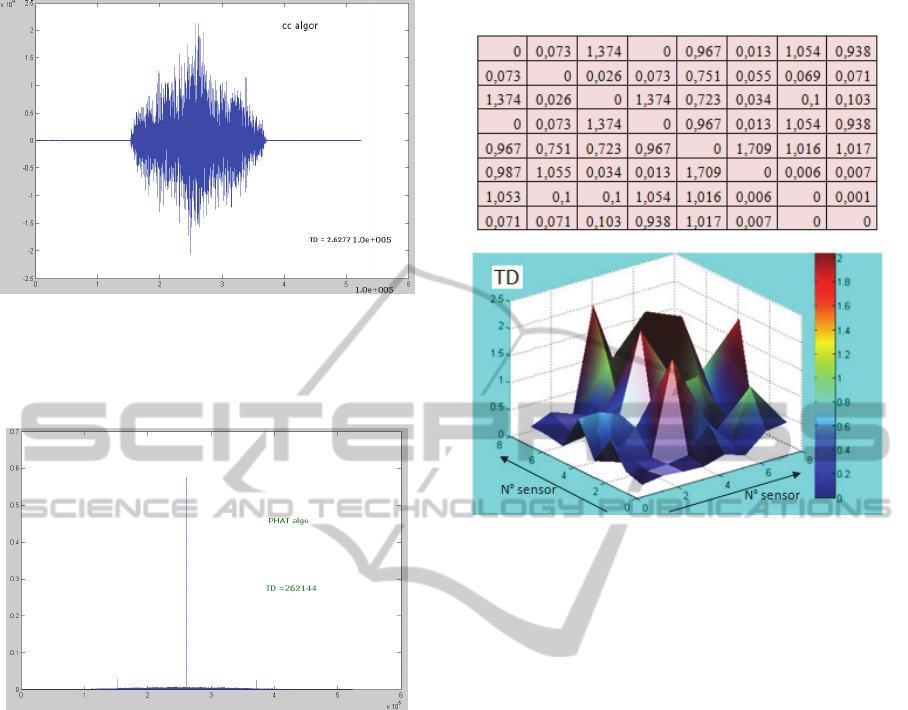
Figure 4: (a) General cross correlation algorithm of two
signals for COPD (the x axis is done in samples), from
recorded lung signals of sensor 1 and sensor 8 of patient
number 3).
Figure 4: (b) Cross correlation of the same two signals
using the PHAT algorithm (the x axis is done in samples),
from recorded lung signals of sensor 1 and sensor 8 of
patient number 3).
TD values calculated using sampling units are
then converted into time delay measured in seconds.
The final configuration of the correlation matrix is
defined as illustrated by Table 2. Differences be-
tween recordings at different chest sites for the dif-
ferent patients were highly significant as revealed by
statistical tests (P < 0.001). To accurately visualize
the local TD results distribution, with a statistic
interpretation we represented TD using 3D image in
Figure 5forall patients. Such graphs can be very
useful to localize and highlight the maximum peak
of TDE values and also to visualize their distribution
on the sensors Map. This representation allowed for
localizing the chest zones where the rate flow is the
lowest. Those chest zones may represent the most
obstructed zones.
Table 2: The TDE matrix in (s) of the 3
rd
COPD Patient.
Figure 5: Example of 3D Map for a COPD patient.
4 DISCUSSION
For all the obtained TDE matrices, we observed that
in every TDE matrix, among 64 measurements of
time delay, few of them were equal to 0. Excluding
the diagonal values which are forcibly equal to zero,
we observed some symmetric zero delay values. i. e.
in Table 2 we observed zero TD values between
sensors (1-4 and 7-8). This fact means that time
delay between lung signals captured at sensors 1 and
4 in one side and sensors 7 and 8 in another side are
not significant. In all other combinations we found
time delay values are varying asymmetrically. Two
important facts have to be highlighted here; the first
one is that we have registered few time delays which
are above 1 second; this represents 26.28 % of the
total measurements between the different sensors.
The second fact is that a delay of 1.709 was found
between sensors 5 and 6 for patient ref 3. This value
was considered as a relatively high value and it may
be used as an index of pulmonary disorder in the
airway located between sensors 5 and 6.
TD values were describing respectively the chest
zones when the probability of detecting damaged
lung zone was important. As an example, in the
particular case of the COPD’s patient number 3, TD
values presented a fluctuation between 0.013 s and
ATimeDelaybasedApproachtoEnhanceLungDiseasesDiagnostic
53

1.709 s which is the maximum delay recorded with
this patient.
5 CONCLUSIONS
The development of new markers can be very help-
ful in enhancing lung diagnosis and update rules for
early detection and treatment of COPD. In fact, both
patients and doctors need to have simple indices that
can describe briefly and accurately the health state
of the patient’s lung. That is the reason for which
our team as many researchers groups are looking for
new noninvasive biological markers, providing in-
stantaneous measurable indexes.
The current study brings significant impact, as
we have emphasized a particular attention to the
applicability of multiple lung sounds captured via a
multichannel stethoscope to enhance lung diagnosis
and pulmonary disorders detection, identification
and classification. As a future work, we suggest to
study the effect of other parameters such as (BMI
and gender) on the evolution of TD.
REFERENCES
Alouani, A., Omar, S, El keelany, M 2010, ‘Stand-alone
portable digital body sound data acquisition device’,
IJES, vol. 4, no. 3-4, pp. 292-297.
Alouani, A., 2011, ‘A Low-Cost Stand-Alone Multichan-
nel Data Acquisition, Monitoring, and Archival Sys-
tem with On-Chip Signal Preprocessing’, IEEE Trans-
actions, Instrumentation and Measurement, vol. 60,
no. 8, pp. 2813-2827.
Ayari, F., Ksouri, M., Alouani, A., 2012, ‘Lung sound
extraction from mixed lung and heart sounds with
FASTICA algorithm’, in Proceeding of the 16th IEEE
Electro technical Conference (MELECON’2012),
Hammamet, Tunisia, pp. 339 –342.
Ayari, F., Ksouri, M., Alouani, A., 2013, ‘Computer
Based Analysis for Heart and Lung Signals Separa-
tion’, in Proceeding of the IEEE International Confer-
ence on Computer Medical Applications,
(ICCMA’2013) Sousse, Tunisia, pp. 1-6.
Chan, Y., Jack, M., Riley, T. 1980,’ A Parameter Estima-
tion Approach to Time-Delay Estimation and Signal
Detection’, IEEE Transactions On Acoustics Speech
and Signal Processing, vol. 28, pp. 8-16.
Chen, J., Benesty, J., & Huang, Y. 2011, ‘Robust time
delay estimation exploiting redundancy among multi-
ple microphones’, IEEE Transactions Speech Audio
Processing, vol. 11, pp. 549-557.
Dellinger, R., Parrillo, J., Kushnir, A., Rossi, M. & Kush-
nir, I. 2008, ‘Dynamic visualization of lung sounds
with a vibration response device: a case series’, Respi-
ration, vol. 7, pp. 60-72.
Georgiou, P., Kyriakakis, C. & Tsakalides, P., 1973, ‘Ro-
bust time delay estimation for sound source localiza-
tion in noisy environments’, proc. of WASPAA, pp. 1-
15.
Hyde, D., Nuttall, A., 1969, ‘Linear pre-filtering to en-
hance correlator performance’, Naval Underwater Sys-
tems Center, CT, Tech. Memo, New London Lab., New
London.
Kevin, W., Wilson, T., 2006, ‘Learning a precedence
effect-like weighting function for the generalized
cross-correlation framework’, IEEE transactions on
audio, speech, and lang. proc. Vol. 41, pp. 2156-2164.
Knap, C., Carter, G., 1976, ‘The generalized correlation
method for estimation of time delay’, IEEE Trans.
Acoust, Speech, Signal Processing, vol. 24, pp. 320-
327.
Kraman, S., 1984, ‘The relationship between airflow and
lung sound amplitude in normal subjects’, Chest, 86
vol.2, pp. 225–229.
Li, D., Levinson, S., 2002, ‘Adaptive sound source locali-
zation by two microphones’, Proc. of Int. Conf. on
Robotics and Automation, Washington DC.
Meirav, Y., Ruben L., Shaul, L. & Yael, G., 2009,‘Effect
of Airflow Rate on Vibration Response Imaging in
Normal Lungs’, The Open Respiratory Medicine
Journal, vol. 3, pp.116-122.
Mor, R., Kushnir, I., Meyer, J., Ekstein, J. & Ben-Dov, I.
2007,’ Breath sound distribution images of patients
with pneumonia and pleural effusion’, Respir. Care,
vol. 52, pp. 1753-1760.
Murphy, R. 2008, ‘In defense of the stethoscope’, Respira-
tory Care, vol. 53, pp. 355–369.
Wodicka, G., Aguirre, A., Defrain, P. & Shannon, D.,
1992, ‘Phase delay of pulmonary acoustic transmis-
sion from trachea to chest wall’, Biomedical Engineer-
ing, IEEE Transactions on’, vol. 39, pp. 1053-1059.
SIGMAP2015-InternationalConferenceonSignalProcessingandMultimediaApplications
54
