
Stability and Sensitivity of Learning Analytics based Prediction
Models
Dirk T. Tempelaar
1
, Bart Rienties
2
and Bas Giesbers
3
1
Maastricht University, School of Business and Economics, PO Box 616, 6200 MD, Maastricht, The Netherlands
2
Open University U.K., Institute of Educational Technology, Walton Hal, Milton Keynes, MK7 6AA, U.K.
3
Rotterdam School of Management, PO Box 1738, 3000 DR, Rotterdam, The Netherlands
Keywords: Blended Learning, Dispositional Learning Analytics, e-tutorials, Formative Assessment, Learning
Dispositions.
Abstract: Learning analytics seek to enhance the learning processes through systematic measurements of learning
related data and to provide informative feedback to learners and educators. In this follow-up study of
previous research (Tempelaar, Rienties, and Giesbers, 2015), we focus on the issues of stability and
sensitivity of Learning Analytics (LA) based prediction models. Do predictions models stay intact, when the
instructional context is repeated in a new cohort of students, and do predictions models indeed change,
when relevant aspects of the instructional context are adapted? This empirical contribution provides an
application of Buckingham Shum and Deakin Crick’s theoretical framework of dispositional learning
analytics: an infrastructure that combines learning dispositions data with data extracted from computer-
assisted, formative assessments and LMSs. We compare two cohorts of a large introductory quantitative
methods module, with 1005 students in the ’13/’14 cohort, and 1006 students in the ’14/’15 cohort. Both
modules were based on principles of blended learning, combining face-to-face Problem-Based Learning
sessions with e-tutorials, and have similar instructional design, except for an intervention into the design of
quizzes administered in the module. Focusing on the predictive power, we provide evidence of both stability
and sensitivity of regression type prediction models.
1 INTRODUCTION
Learning analytics provide institutions with
opportunities to support student progression and to
enable personalised, rich learning (Bienkowski,
Feng, and Means, 2012; Oblinger, 2012; Siemens,
Dawson, and Lynch, 2013; Tobarra, Robles-Gómez,
Ros, Hernández, and Caminero, 2014). According to
Bienkowski et al. (2012, p. 5), “education is getting
very close to a time when personalisation will
become commonplace in learning”, although several
researchers (Greller and Drachsler, 2012; Stiles,
2012) indicate that most institutions may not be
ready to exploit the variety of available datasets for
learning and teaching. Many learning analytics
applications use data generated from learner
activities, such as the number of clicks (Siemens,
2013; Wolff, Zdrahal, Nikolov, and Pantucek, 2013),
learner participation in discussion forums (Agudo-
Peregrina, Iglesias-Pradas, Conde-González, and
Hernández-García, 2014; Macfadyen and Dawson,
2010), or (continuous) computer-assisted formative
assessments (Tempelaar, Heck, Cuypers, van der
Kooij, and van de Vrie, 2013; Tempelaar, Kuperus
et al., 2012; Wolff et al., 2013). User behaviour data
are frequently supplemented with background data
retrieved from learning management systems (LMS)
(Macfadyen and Dawson, 2010) and other student
admission systems, such as accounts of prior
education (Arbaugh, 2014; Richardson, 2012;
Tempelaar, Niculescu, Rienties, Giesbers, and
Gijselaers, 2012).
In Verbert, Manouselis, Drachsler, and Duval
(2012), six objectives are distinguished in using
learning analytics: predicting learner performance
and modelling learners, suggesting relevant learning
resources, increasing reflection and awareness,
enhancing social learning environments, detecting
undesirable learner behaviours, and detecting affects
of learners. Although the combination of self-report
learner data with learning data extracted from e-
tutorial systems (see below) allows us to contribute
156
Tempelaar D., Rienties B. and Giesbers B..
Stability and Sensitivity of Learning Analytics based Prediction Models.
DOI: 10.5220/0005497001560166
In Proceedings of the 7th International Conference on Computer Supported Education (CSEDU-2015), pages 156-166
ISBN: 978-989-758-107-6
Copyright
c
2015 SCITEPRESS (Science and Technology Publications, Lda.)

to at least five of these objectives of applying
learning analytics, we will focus in this contribution
on the first objective: predictive modelling of
performance and learning behaviour (Baker, 2010;
Thakur, Olama, McNair, Sukumar, and Studham, S.,
2014). The ultimate goal of this predictive modelling
endeavour is to find out which components from a
rich set of data sources best serve the role of
generating timely, informative feedback and
signalling risk of underperformance. In designing
such prediction models, there is always a balance
between prediction accuracy at the one side, and the
generalizability of the prediction model at the other
side (Thakur et al., 2014). Models that are strongly
context specific will typically achieve high
prediction accuracy, but perform only within
contexts very similar to the one they are designed
for, and not outside such contexts. Relative
invariance of prediction models over several
modules making up an academic program is thus an
important aim in the design of prediction models. At
the same time, prediction models need to be
sufficiently context specific, for instance in order to
be able to analyse the effect of interventions into the
instructional system. In this study, we focus on both
of these issues within the empirical context of a
large module introductory quantitative methods. Our
study is a follow-up study of previous research,
Tempelaar, Rienties, and Giesbers (2014, 2015), in
which the role of formative assessment based LA is
analysed within one cohort of students. In the
current study, we extend our sample with a second
cohort, with the aim to investigate both the stability
of the prediction models over different cohorts, as
well as the sensitivity of those prediction models for
relevant changes in the instructional design.
2 APPLICATION CONTEXT
2.1 Dispositional Learning Analytics
Buckingham Shum and Deakin Crick (2012)
propose a dispositional learning analytics
infrastructure that combines learning activity
generated data with learning dispositions, values and
attitudes measured through self-report surveys,
which are fed back to students and teachers through
visual analytics. For example, longitudinal studies in
motivation research (Rienties, Tempelaar, Giesbers,
Segers, and Gijselaers, 2012; Järvelä, Hurme, and
Järvenoja, 2011) and students’ learning approaches
indicate strong variability in how students learn over
time in face-to-face settings (e.g., becoming more
focussed on deep learning rather than surface
learning), depending on the learning design, teacher
support, tasks, and learning dispositions of students.
Indeed, in a study amongst 730 students Tempelaar,
Niculescu, et al. (2012) found that positive learning
emotions contributed positively to becoming an
intensive online learner, while negative learning
emotions, like boredom, contributed negatively to
learning behaviour. Similarly, in an online
community of practice of 133 instructors supporting
EdD students, Nistor et al. (2014) found that self-
efficacy (and expertise) of instructors predicted
online contributions. And in a very recent overview
study into the role learner emotions in applications
of LA, Rienties and Alden Rivers (2014) distinguish
no less than hundred different facets of learner
emotions determining students’ learning behaviours.
However, studies combining LMS data with
intentionally collected data, such as self-report data
stemming from student responses to surveys, are the
exception rather than the rule in learning analytics
(Buckingham Shum and Ferguson, 2012; Greller and
Drachsler, 2012; Macfadyen and Dawson, 2010;
Tempelaar et al., 2013, 2015). In our empirical
contribution focusing on a large scale module in
introductory mathematics and statistics, we aim to
provide a practical application of such an
infrastructure based on combining longitudinal
learning and learner data. In collecting learner data,
we opted to use three validated self-report surveys
firmly rooted in current educational research,
including learning styles (Vermunt, 1996), learning
motivation and engagement (Martin, 2007), and
learning emotions (Pekrun, Goetz, Frenzel,
Barchfeld, and Perry, 2011). This operationalisation
of learning dispositions closely resembles the
specification of cognitive, metacognitive and
motivational learning factors relevant for the internal
loop of informative tutoring feedback (e.g., Narciss,
2008; Narciss and Huth, 2006). For learning data,
data sources are used from more common learning
analytics applications, and constitute both data
extracted from an institutional LMS (Macfadyen and
Dawson, 2010) and system track data extracted from
the e-tutorials used for practicing and formative
assessments (e.g., Tempelaar et al., 2014, 2015;
Wolff et al., 2013). The prime aim of the analysis is
predictive modelling (Baker, 2010) , with a focus on
the roles of (each of) 100+ predictor variables from
the several data sources can play in generating
timely, informative feedback for students, and
ultimately the stability and sensitivity of such
prediction models.
StabilityandSensitivityofLearningAnalyticsbasedPredictionModels
157

2.2 Case Study: Blended Learning of
Mathematics and Statistics using
e-tutorials and Formative
Assessment
Subjects in our study are freshmen students in
quantitative methods (mathematics and statistics) of
the business and economics school at Maastricht
University. This education is directed at a large and
diverse group of students, which benefits the
research design. Blackboard serves as a basic LMS
system to share module information to students.
Given the restricted functionality of this LMS in
terms of personalised, adaptive learning content with
rich varieties of feedback and support provision, two
external e-tutorials were utilised: MyStatLab (MSL)
and MyMathLab (MML). These e-tutorials are
generic LMSs for learning statistics and
mathematics developed by the publisher Pearson.
Please see Tempelaar et al. (2014, 2015), for a more
detailed description of these tools.
The MyLab functionality used in the module are
that of practicing (replacing traditional practicals),
formative assessment, and quizzing. Quizzing allows
students to achieve a bonus on the score of the final
written exam, determining the pass/fail decision for
the module. So although quizzing makes use of the
same materials as the self-steered formative
assessments, and the weight of quiz performance in
the pass/fail decision is limited, the quiz element
does entail some summative aspects beyond
important formative ones. And it has been in the
quizzing that we revised the instructional design of
the module. In the first cohort, quiz items were
randomly selected from the same pool of items
students could access in their formative assessments.
Thus by putting sufficient effort in self-assessment,
students could achieve knowledge about all item
types in the quiz (not with the exact items
themselves, since items are parametrized). To avoid
stimulating students to repeat formative assessments
over and over again only to learn all different item
types, we split all item pools into two non-
overlapping sub pools, one for self-assessments, the
other for quizzing. It is exactly this change,
prediction models might pick up from the LA
studies, if they appear to be sufficiently sensitive to
the instructional design.
3 RESEARCH METHODS
3.1 Research Questions
Combining empirical evidence on how students’
usage and behaviour in LMS influences academic
performance (e.g., Arbaugh, 2014; Macfadyen and
Dawson, 2010; Marks, Sibley, and Arbaugh, 2005;
Wolff et al., 2013), how the use of e-tutorials or
other formats of blended learning effects
performance (e.g., Lajoie and Azevedo, 2006), and
how feedback based on learning dispositions
stimulates learning (Buckingham Shum and Deakin
Crick, 2012), our study aims to discover the relative
contributions of LMSs, formative testing, e-tutorials,
and applying dispositional learning analytics to
student performance. The prime aim of the analysis
is predictive modelling (Baker, 2010; Wolff et al.,
2013), with a focus on the role each of these data
sources can play in generating timely, informative
feedback for students. In the investigation of
predictive modelling, we will focus on the stability
of prediction models, defined as the similarity of the
prediction models in the two subsequent cohorts,
and the sensitivity of the prediction models: will
they signal the revision in instructional design.
Q1 To what extent do distinct data sources, such
as (self-reported) learning dispositions of students,
LMSs and e-tutorial data (formative assessments)
predict academic performance over time?
Q2 To what extent are prediction models stable,
in the meaning that predictive modelling in both
cohorts results in invariant model structures with
similar weights of the prediction variables?
Q3 To what extent are prediction models
sensitive, in the meaning that predictive modelling
in both cohorts results in different models where the
instructional design of the module has been revised?
3.2 Methodology
3.2.1 Context of Study
The educational system in which students learn
mathematics and statistics is best described as a
‘blended’ or ‘hybrid’ system. The main component
is face-to-face: problem-based learning (PBL), in
small groups (14 students), coached by a content
expert tutor (Rienties, Tempelaar, Van den Bossche,
Gijselaers, and Segers, 2009; Schmidt, Van Der
Molen, Te Winkel, and Wijnen, 2009; Tempelaar,
Rienties, and Giesbers, 2009). Participation in these
tutorial groups is required, as for all courses based
on the Maastricht PBL system. Optional is the online
CSEDU2015-7thInternationalConferenceonComputerSupportedEducation
158

component of the blend: the use of the two e-
tutorials (Tempelaar et al., 2013). This optional
component fits the Maastricht educational model,
which is student-centred and places the
responsibility for making educational choices
primarily on the student (Schmidt et al., 2009;
Tempelaar et al., 2013). At the same time, due to
strong diversity in prior knowledge in mathematics
and statistics, not all students, in particular those at
the high end, will benefit equally from using these
environments. However, the use of e-tutorials and
achieving good scores in the practicing modes of the
MyLab environments is stimulated by making bonus
points available for good performance in the
quizzes.
The student-centred characteristic of the
instructional model requires, first and foremost,
adequate informative feedback to students so that
they are able to monitor their study progress and
their topic mastery in absolute and relative sense.
The provision of relevant feedback starts on the first
day of the course when students take two diagnostic
entry tests for mathematics and statistics (Tempelaar
et al., 2013). Feedback from these entry tests
provides a first signal of the importance for using the
MyLab platforms. Next, the MML and MSL-
environments take over the monitoring function: at
any time students can see their progress in preparing
the next quiz, get feedback on the performance in
completed quizzes, and on their performance in the
practice sessions. The same (individual and
aggregated) information is also available for the
tutors in the form of visual dashboards (Clow, 2013;
Verbert et al., 2012). Although the primary
responsibility for directing the learning process is
with the student, the tutor acts complementary to
that self-steering, especially in situations where the
tutor considers that a more intense use of e-tutorials
is desirable, given the position of the student
concerned. In this way, the application of learning
analytics shapes the instructional support.
3.2.2 Participants
From the two most recent cohorts of freshmen
(2013/2014 and 2014/2015) all students were
included who in some way participated in learning
activities (i.e., have been active in BlackBoard):
1005 and 1006 students respectively. A large
diversity in the student population is present: only
25% were educated in the Dutch high school system.
The largest group, 45% of the freshmen, were
educated according to the German Abitur system.
High school systems in Europe differ strongly, most
particularly in the teaching of mathematics and
statistics. Therefore, it is crucial that the first module
offered to these students is flexible and allows for
individual learning paths (Tempelaar, et al., 2009,
2013; Tempelaar, Kuperus, et al., 2012). In the
investigated course, students work an average 32.6
hours in MML and 20.7 hours in MSL, 30% to 40%
of the available time of 80 hours for learning in both
topics.
3.3 Instruments and Procedure
We will investigate the relationships between a
range of data sources, leading to in total 102
different variables. In the subsections that follow,
the several data sources are described that provide
the predictor variables for our predictive modelling.
3.3.1 Registration Systems Capturing
Demographic Data
In line with academic retention or academic
analytics literature (Marks et al., 2005; Richardson,
2012), several demographic factors are known to
influence performance. A main advantage of this
type of data is that institutions can relatively easily
extract this information from student admission, and
are therefore logical factors to include in learning
analytics models.
Demographic data were extracted from concern
systems: nationality, gender, age and prior
education. Since, by law, introductory modules like
ours need to be based on the coverage of Dutch high
school programs, we converted nationality data into
an indicator for having been educated in the Dutch
high school system. 24% of students are educated in
the Dutch higher education system, 76% of students
in international systems, mostly of continental
European countries. About 39% of students are
female, with 61% males. Age demonstrates very
little variation (nearly all students are below 20), and
no relationship with any performance, and is
excluded. The main demographic variable is the type
of mathematics track in high school: advanced,
preparing for sciences or technical studies in higher
education, or basic, and preparing for social sciences
(the third level, mathematics for arts and humanities,
does not provide access to our program). Exactly
two third of the students has a basic mathematics
level, one third has an advanced level. (See
Tempelaar, et al., 2009, 2013; Tempelaar, Kuperus,
et al., 2012 for detailed description.)
StabilityandSensitivityofLearningAnalyticsbasedPredictionModels
159

3.3.2 Diagnostic Entry Tests
At the very start of the course, so shaping part of
Week0 data, are entry tests for mathematics and
statistics all students were required to do. Both entry
tests are based on national projects directed at
signalling deficiencies in the area of mathematics
and statistics encountered in the transition from high
school to university (see Tempelaar, Niculescu, et
al., 2012 for an elaboration). Topics included in the
entry tests refer to foundational topics, often covered
in junior high school programs, such as basic
algebraic skills or statistical literacy.
3.3.3 Learning Dispositions Data
Learning dispositions of three different types were
included: learning styles, learning motivation and
engagement, and learning emotions. The first two
facets were measured at the start of the module, and
from the longitudinal perspective are assigned to
Week0 data. Learning style data are based on the
learning style model of Vermunt (1996). Vermunt’s
model distinguishes learning strategies (deep, step-
wise, and concrete ways of processing learning
topics), and regulation strategies (self, external, and
lack of regulation of learning). Recent Anglo-Saxon
literature on academic achievement and dropout
assigns an increasingly dominant role to the
theoretical model of Andrew Martin (2007): the
'Motivation and Engagement Wheel’. This model
includes both behaviours and thoughts, or
cognitions, that play a role in learning. Both are
subdivided into adaptive and mal-adaptive (or
obstructive) forms. Adaptive thoughts consist of
Self-belief, Value of school and Learning focus,
whereas adaptive behaviours consist of Planning,
Study management and Perseverance. Maladaptive
thoughts include Anxiety, Failure Avoidance, and
Uncertain Control, and lastly, maladaptive
behaviours include Self-Handicapping and
Disengagement. As a result, the four quadrants are:
adaptive behaviour and adaptive thoughts (the
‘boosters’), mal-adaptive behaviour (the ‘guzzlers’)
and obstructive thoughts (the ‘mufflers’).
The third component, learning emotions, is more
than a disposition: it is also an outcome of the
learning process. Therefore, the timing of the
measurement of learning emotions is Week4,
halfway into the module, so that students have
sufficient involvement and experience in the module
to form specific learning emotions, but still timely
enough to make it a potential source of feedback.
Learning emotions were measured through four
scales of the Achievement Emotions Questionnaire
(AEQ) developed by Pekrun et al. (2011):
Enjoyment, Anxiety, Boredom and Hopelessness.
All learning dispositions are administered through
self-report surveys scored on a 7-point Likert scale.
3.3.4 Learning Management System
User track data of LMS are often at the heart of
learning analytics applications. Also in our context
intensive use of our LMS, BlackBoard (BB), has
been made. In line with Agudo-Peregrina et al.
(2014), we captured tracking data from six learning
activities. First, the diagnostic entry tests were
administered in BB, and through the MyGrades
function, students could access feedback on their test
attempts. Second, surveys for learning dispositions
were administered in BB. Third, two lectures per
week were provided, overview lectures at the start of
the week, and recap lectures at the end of the week,
which were all videotaped and made available as
webcasts through BB. Fourth, several exercises for
doing applied statistical analyses, including a student
project, were distributed through BB, with a
requirement to upload solutions files again in BB.
Finally, communication from the module staff,
various course materials and a series of old exams
(to practice the final exam) were made available in
BB. For all individual BB items, Statistics Tracking
was set on to create use intensity data on BB
function and item level.
3.3.5 e-tutorials MyMathLab and
MyStatLab
Students worked in the MyMathLab and MyStatLab
e-tutorials for all seven weeks, practicing homework
exercises selected by the module coordinator. The
MyLab systems track two scores achieved in each
task, mastery score (MyLabMastery) and time on
task (MyLabHours). Those data were aggregated
over the on average 25 weekly tasks for
mathematics, and about 20 tasks for statistics, to
produce four predictors, two for each topic, for each
of the seven weeks. Less aggregated data sets have
been investigated, but due to high collinearity in data
of individual tasks, these produced less stable
prediction models.
The three (bonus) quizzes took place in the
weeks 3, 5 and 7. Quizzes were administrated in the
MyLab tools, and consisted of selections of practice
tasks from the two previous weeks. As indicated: the
single revision in the instructional design of the
course between the two class years is in the
inclusion of quiz items in the item pool availability
for self-assessment.
CSEDU2015-7thInternationalConferenceonComputerSupportedEducation
160

3.3.6 Academic Performance
Four measures of academic performance in the
Quantitative Methods module in both cohorts were
included for predictive modelling: score in both
topic components of the final, written exam, MExam
and SExam, and aggregated scores for the three
quizzes in both topics, MQuiz and SQuiz, where M
refers to the topic mathematics, and S refers to the
topic Statistics.
3.4 Data Analysis
Complete information was obtained for 874
respectively 879 students (87%) on the various
instruments. Prediction models applied in this study
are all of linear, regression type. More complex
models have been investigated, in particular
interaction models. However, none of these more
advanced model types passed the model selection
criterion that prediction models should be stable
over all seven weekly intervals. Collinearity existing
in track data in a similar way forced us to aggregate
that type of data into weekly units; models based on
less aggregated data such as individual task data
gave rise to collinearity issues.
4 RESULTS
The aim of this study being predictive modelling in a
rich data context, we will focus the reporting on the
coefficient of multiple correlation, R, of the several
prediction models. Although the ultimate aim of
prediction modelling is often the comparison of
explained variation, which is based on the square of
the multiple correlation, we opted for using R itself,
to allow for more detailed comparisons between
alternative models. Values for R are documented in
Table 1 for prediction models based on alternative
data sets, and for both cohorts. For data sets that are
longitudinal in nature and allow for incremental
weekly data sets, the growth in predictive power is
illustrated in time graphs for BB track data, MyLabs
track data and test performance data. To ease
comparison, all graphs share the same vertical scale.
4.1 Predictive Power per Topic
In the comparison of the several columns of
prediction accuracy in Table 1, one of the most
striking outcomes is that the predictive power for
mathematics uniformly dominates that for statistics,
in both cohorts, and for both performance measures
exam and quiz (with one single exception). The
difference is easy to explain: students enter
university with very different levels of prior
knowledge of and prior education in mathematics.
For that reason, demographics (containing the
dummy for high school math at advanced level) as
well as entry test contribute strongly in predictive
power. Statistics, not being part of the curriculum of
most European high school systems, does not profit
from the same type of predictors. This outcome
corroborates findings from previous research (Marks
et al., 2005; Richardson, 2012; Tempelaar et al.,
2013) that prior education seems to be a useful
factor to include in learning analytics modelling.
The single predictor performing equally well in both
topics represents learning dispositions: both learning
styles, and motivation and engagement variables, do
not differentiate between topics, signalling the
unique contribution that learning dispositions can
possess in LA based prediction models.
4.2 Predictive Power per Performance
Measure
In the comparison of predictive power of the two
performance measures, exam and quiz, of
corresponding topics and cohorts, we find less
articulated differences. Most predictor variables
predict exam performance with similar accuracy as
quiz performance. The clear exception to this
outcome relates the system tracking data collected
from the two MyLab systems: time in MML and
MSL, and mastery in MML and MSL. Given the
strong ties between the self-steered formative
assessment in the e-tutorials, and the quizzing
administered in the same e-tutorials, we find that
MyLab track data have much stronger predictive
power toward quiz performance, than toward exam
performance (the same is true for quiz performance
acting as predictor for later quizzes).
4.3 Predictive Power per Data Source
In a comparison of prediction accuracy of the
several data sources, the outcomes of this study are
fully in line with our findings in previous research
(Tempelaar et al., 2014, 2015). Most powerful
predictor is found in the cognitive data: scores on
entry tests, and scores in quizzes. From the moment
the first quiz data become available, other data
sources hardly contribute anymore in the prediction
of performance measures: see Figure 2. However:
the first quiz data are only available at the end of the
third week, about half way the module. More timely
StabilityandSensitivityofLearningAnalyticsbasedPredictionModels
161
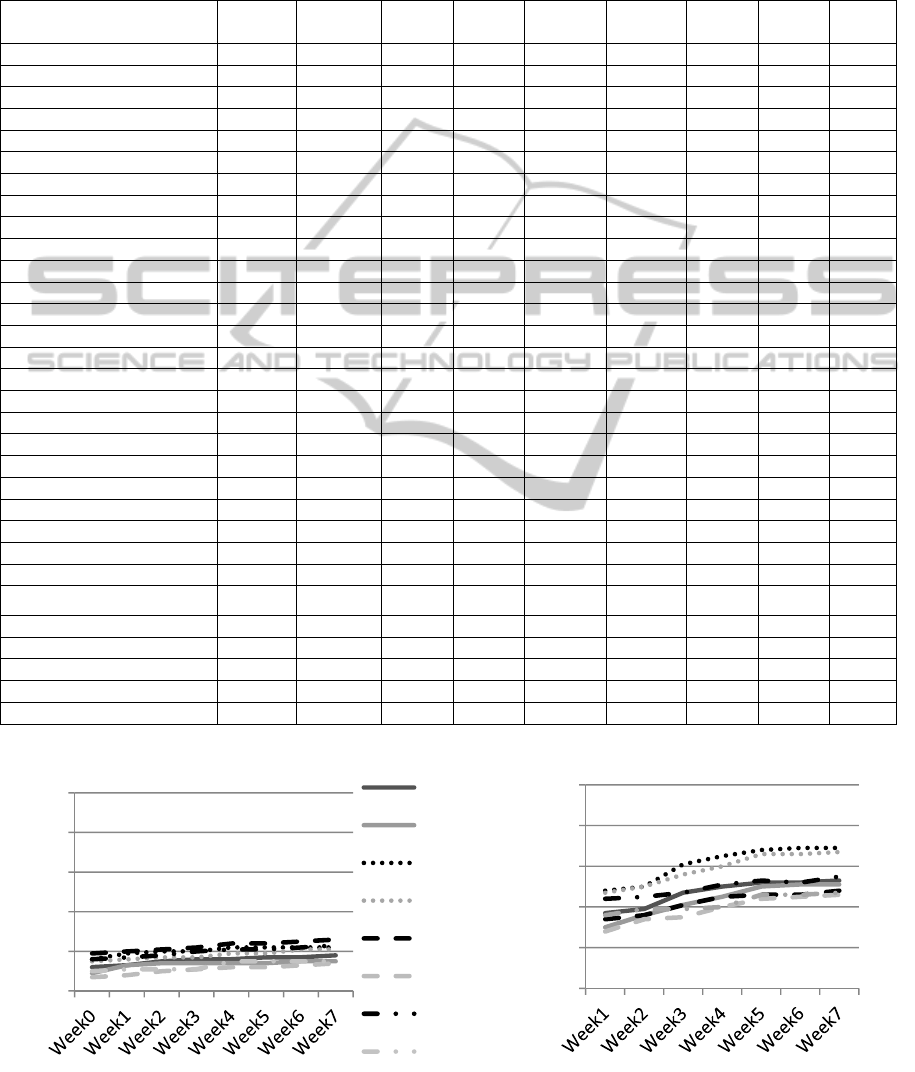
data, already available from the start of the module
on, is found in the track data of the MyLab systems
(Figure 1, right panel). These data dominate the
predictive power of track data collected from the
LMS (Figure 1, left panel).
Table 1: Predictive power, as multiple correlation R, of various data sets and various timings, for four performance
measures, two cohorts.
Data source Timing
MExam
2013
SExam
2013
MQuiz
2013
SQuiz
2013
MExam
2014
SExam
2014
MQuiz
2014
SQuiz
2014
Demographics Week0 .43 .29 .39 .21 .24 .22 .27 .21
EntryTests Week0 .43 .30 .45 .24 .37 .28 .47 .29
Learning Styles Week0 .24 .22 .22 .23 .20 .23 .18 .25
Motivation & Engagement Week0 .30 .31 .33 .32 .19 .24 .23 .23
BlackBoard Week0 .12 .09 .16 .15 .19 .07 .16 .10
AllWeek0 Week0 .59 .46 .58 .43 .48 .43 .55 .43
BlackBoard Week1 .13 .13 .19 .16 .20 .08 .17 .11
MyLabs Week1 .37 .30 .48 .47 .34 .28 .44 .36
AllWeek1 Week1 .61 .50 .66 .57 .52 .49 .63 .53
BlackBoard Week2 .15 .14 .20 .17 .21 .10 .18 .11
MyLabs Week2 .39 .36 .50 .50 .36 .34 .45 .39
AllWeek2 Week2 .62 .52 .67 .64 .53 .52 .64 .58
BlackBoard Week3 .16 .14 .20 .17 .22 .11 .20 .11
MyLabs Week3 .47 .41 .61 .56 .41 .35 .47 .39
Quiz1 Week3 .67 .58 .86 .76 .60 .54 .81 .74
AllWeek3 Week3 .74 .66 .89 .81 .66 .64 .85 .79
Learning Emotions Week4 .48 .33 .49 .30 .32 .25 .38 .25
BlackBoard Week4 .16 .14 .22 .19 .24 .12 .21 .15
MyLabs Week4 .50 .45 .65 .60 .45 .40 .51 .40
AllWeek4 Week4 .79 .67 .90 .82 .76 .66 .86 .80
BlackBoard Week5 .17 .14 .22 .19 .24 .12 .21 .15
MyLabs Week5 .52 .50 .68 .66 .46 .44 .53 .46
Quiz2 Week5 .72 .61 .96 .93 .67 .64 .94 .93
AllWeek5 Week5 .77 .68 .97 .94 .72 .71 .95 .94
BlackBoard Week6 .17 .15 .22 .21 .25 .13 .22 .15
MyLabs Week6 .52 .51 .69 .66 .46 .45 .52 .46
AllWeek6 Week6 .78 .69 .97 .94 .73 .71 .96 .94
BlackBoard Week7 .18 .15 .22 .21 .26 .14 .23 .15
MyLabs Week7 .53 .51 .69 .67 .48 .46 .55 .47
Quiz3 Week7 .72 .61 1.00 1.00 .69 .66 1.00 1.00
AllWeek7 Week7 .78 .69 1.00 1.00 .75 .72 1.00 1.00
Note: MExam and SExam refer to exam scores in topics mathematics and statistics; MQuiz and SQuiz to the corresponding quiz score.
Figure 1: Predictive power of BB track data, and MML and MSL system data for six performance measures.
0,0
0,2
0,4
0,6
0,8
1,0
MExam2013
SExam2013
MQuiz2013
SQuiz2013
MExam2014
SExam2014
MQuiz2014
SQuiz2014
0,0
0,2
0,4
0,6
0,8
1,0
CSEDU2015-7thInternationalConferenceonComputerSupportedEducation
162
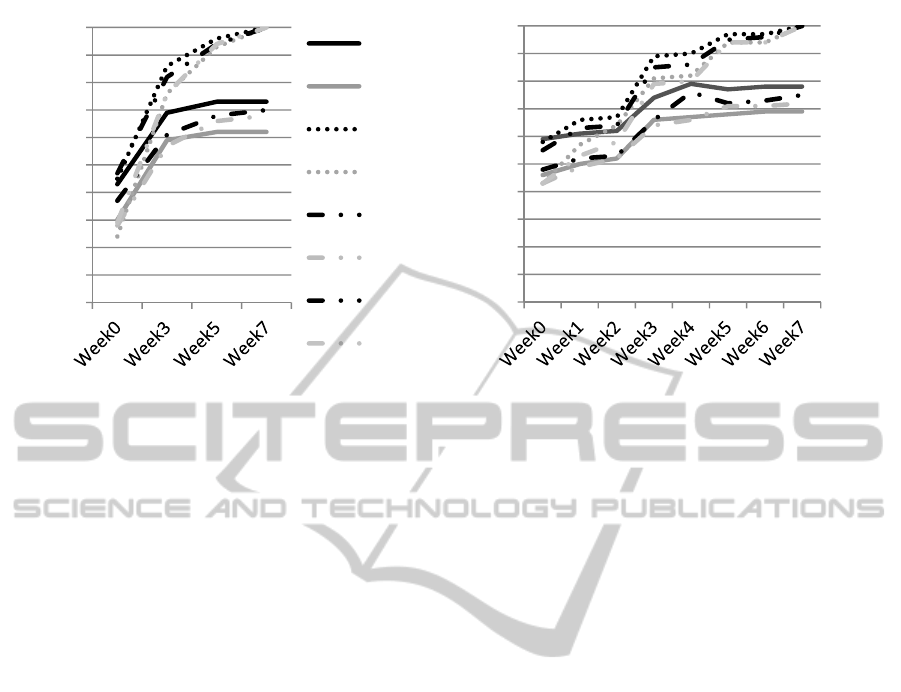
Figure 2: Predictive power of EntryTest and Quiz data, and all data combined for six performance measures.
4.4 Predictive Power per Cohort
Both Figures, as well Table 1, do also allow a
comparison of prediction accuracy between cohorts.
As to find an answer to the second and third research
question: stability and sensitivity of prediction
models. Stability follows from the strong similarities
between 2013 and 2014 outcomes. The pattern
reported in the previous section, with strongest
predictive power in the quiz data, followed by entry
test and e-tutorial track data, and least predictive
power in LMS track data, is equally visible for the
2013 cohort, as for the 2014 cohort. Beyond
predictive power itself, also the structure of the
regression models in the two cohorts (not reported
here) demonstrate strong correspondence. With one
exception: prediction accuracy of quizzes in the
2014 cohort, both for mathematics and statistics, is
at a much lower level than in the 2013 cohort. But it
was exactly this exception we expected on the basis
of the instructional redesign applied. Breaking the
strong link between items available for formative
assessment, and items used in quizzing, it was hoped
for to take out the strong stimulus to repeatedly
practice in the same item pool. Given that the lower
predictive power of quiz performance mainly comes
from the reduction in the contribution of the MyLab
track data, this is exactly what we aimed for in the
third research question: the prediction model is
sufficiently sensitive to signal the effects of the
instructional intervention, aiming to change students
learning behaviour.
5 DISCUSSION AND
CONCLUSION
In this empirical study into predictive modelling of
student performance, we investigated several
different data sources to explore the potential of
generating informative feedback for students and
teachers using learning analytics: data from
registration systems, entry test data, students’
learning dispositions, BlackBoard tracking data,
tracking data from two e-tutorial systems, and data
from systems for formative, computer assisted
assessments. In line with recommendations by
Agudo-Peregrina et al. (2014), we collected both
dynamic, longitudinal user data and semi-static data,
such as prior education. We corroborate our finding
in previous research (Tempelaar et al., 2015) that
the role of BlackBoard track data in predicting
student performance is dominated by the predictive
power of any of the other data components, implying
that in applications with such rich data available,
BlackBoard data have no added value in predicting
performance and signalling underperforming
students. This seems to confirm initial findings by
Macfadyen and Dawson (2010), who found that
simple clicking behaviour in a LMS is at best a poor
proxy for actual user-behaviour of students.
Data extracted from the testing mode of the
MyLab systems, the quiz data, dominate in a similar
respect all other data, including data generated by
the practicing mode of MyLabs, indicating the
predictive power of "true" assessment data (even if it
comes from assessments that are more of formative,
0,0
0,1
0,2
0,3
0,4
0,5
0,6
0,7
0,8
0,9
1,0
MExam2013
SExam2013
MQuiz2013
SQuiz2013
MExam2014
SExam2014
MQuiz2014
SQuiz2014
0,0
0,1
0,2
0,3
0,4
0,5
0,6
0,7
0,8
0,9
1,0
StabilityandSensitivityofLearningAnalyticsbasedPredictionModels
163

than summative type). However, assessment data is
typically delayed data (Boud and Falchikov, 2006;
Whitelock et al., 2014; Wolff et al., 2013), not
available before midterm, or as in our case, the third
week of the course. Up to the moment this richest
data component becomes available, entry test data
and the combination of mastery data and use
intensity data generated by the e-tutorial systems are
a second best alternative for true assessment data.
This links well with Wolff et al. (2013), who found
that performance on initial assessments during the
first parts of online modules were substantial
predictors for final exam performance.
A similar conclusion can be made with regards to
the learning disposition data: up to the moment that
assessment data become available, they serve a
unique role in predicting student performance and
signalling underperformance beyond system track
data of the e-tutorials. From the moment that
computer assisted, formative assessment data
become available, their predictive power is
dominated by that of performance in those formative
assessments. Dispositions data are not as easily
collected as system tracking data from LMSs or e-
tutorial systems (Buckingham Shum and Deakin
Crick, 2012). The answer to the question if the effort
to collect dispositional data is worthwhile (or not), is
therefore strongly dependent on when richer
(assessment) data becomes available, and the need
for timely signalling of underperformance. If timely
feedback is required, the combination of data
extracted from e-tutorials, both in practicing and test
modes, and learning disposition data suggests being
the best mix to serve learning analytics applications.
In contrast to Agudo-Peregrina et al. (2014), who
found no consistent patterns in two blended courses
using learning analytics, we did find that our mix of
various LMS data allowed us to accurately predict
academic performance, both from a static and
dynamic perspective. The inclusion of extensive
usage of computer-assisted tests might explain part
of this difference, as well as more fine-grained
learning disposition data allowed us to model the
learning patterns from the start of the module.
The inclusion of two different cohorts in this
study allows the investigation of two additional
crucial issues: that of stability and sensitivity of
prediction models. Evidence of both was found.
Both findings profit from the availability of a very
broad set of predictor variables, that proof to be
complementary in predicting performance. Being
complementary implies that the collinearity in the
set of predictors is limited. This limited collinearity
contributes to stability; within a set of predictors that
demonstrate stronger collinearity, prediction models
will tend to be more context dependent, less stable
over different contexts, such as cohorts. The broad
spectrum of predictor variables does also explain the
sensitivity of the prediction model to changes in the
instructional design. Without the inclusion of e-
tutorial track data, our LA based prediction model
would not have been able to signal the change in the
construction of quizzes. Thus, a broad set of
complementary predictor variables is crucial in the
successful application of LA.
To these stability and sensitivity aspects add
another one: that of feedback and intervention.
Feedback is informative if two conditions are
satisfied: it is predictive, and allows for intervention.
Feedback based on prior education may be strongly
predictive, but is certainly incapable of designing
interventions as to eliminate the foreseen cause of
underperformance (Boud and Falchikov, 2006;
Whitelock et al., 2014). Feedback related to learning
dispositions, such as signalling suboptimal learning
strategies, or inappropriate learning regulation, is
generally open to interventions to improve the
learning process (Lehmann et al., 2014; Pekrun et
al., 2011). Feedback related to suboptimal use of e-
tutorials shares that position: both predictive, and
open for intervention. The requirement of a broad
and complementary set of predictors thus needs a
completion: that of enabling intervention.
ACKNOWLEDGEMENTS
The project reported here has been supported and
co-financed by SURF-foundation as part of the
Learning Analytics Stimulus program.
REFERENCES
Agudo-Peregrina, Á. F., Iglesias-Pradas, S., Conde-
González, M. Á., and Hernández-García, Á. (2014).
Can we predict success from log data in VLEs?
Classification of interactions for learning analytics and
their relation with performance in VLE-supported F2F
and online learning. Computers in Human Behavior,
31, 542-550. doi: 10.1016/j.chb.2013.05.031.
Arbaugh, J. B. (2014). System, scholar, or students?
Which most influences online MBA course
effectiveness? Journal of Computer Assisted Learning.
doi: 10.1111/jcal.12048.
Baker, R. (2010). Data mining for education. International
encyclopedia of education, 7, 112-118.
Bienkowski, M., Feng, M., and Means, B. (2012).
Enhancing teaching and learning through educational
CSEDU2015-7thInternationalConferenceonComputerSupportedEducation
164

data mining and learning analytics: An issue brief. US
Department of Education, Office of Educational
Technology, 1-57.
Boud, D., and Falchikov, N. (2006). Aligning assessment
with longterm learning. Assessment & Evaluation in
Higher Education, 31(4), 399-413. doi:
10.1080/02602930600679050.
Buckingham Shum, S., and Deakin Crick, R. (2012).
Learning dispositions and transferable competencies:
pedagogy, modelling and learning analytics. Paper
presented at the 2nd International Conference on
Learning Analytics & Knowledge, Vancouver, British
Columbia.
Buckingham Shum, S., and Ferguson, R. (2012). Social
Learning Analytics. Journal of Educational
Technology & Society, 15(3). doi:
10.1145/2330601.2330616.
Clow, D. (2013). An overview of learning analytics.
Teaching in Higher Education, 18(6), 683-695. doi:
10.1080/13562517.2013.827653.
Greller, W., and Drachsler, H. (2012). Translating
Learning into Numbers: A Generic Framework for
Learning Analytics. Journal of Educational
Technology & Society, 15(3).
Hommes, J., Rienties, B., de Grave, W., Bos, G.,
Schuwirth, L., and Scherpbier, A. (2012). Visualising
the invisible: a network approach to reveal the
informal social side of student learning. Advances in
Health Sciences Education, 17(5), 743-757. doi:
10.1007/s10459-012-9349-0.
Järvelä, S., Hurme, T., and Järvenoja, H. (2011). Self-
regulation and motivation in computer-supported
collaborative learning environments. In S. Ludvigson,
A. Lund, I. Rasmussen and R. Säljö (Eds.), Learning
across sites: new tools, infrastructure and practices
(pp. 330-345). New York, NY: Routledge.
Lajoie, S. P., and Azevedo, R. (2006). Teaching and
learning in technology-rich environments. In P.
Alexander and P. Winne (Eds.), Handbook of
educational psychology (2 ed., pp. 803-821). Mahwah,
NJ: Erlbaum.
Lehmann, T., Hähnlein, I., and Ifenthaler, D. (2014).
Cognitive, metacognitive and motivational
perspectives on preflection in self-regulated online
learning. Computers in Human Behavior, 32, 313-323.
doi: 10.1016/j.chb.2013.07.051.
Macfadyen, L. P., and Dawson, S. (2010). Mining LMS
data to develop an “early warning system” for
educators: A proof of concept. Computers &
Education, 54(2), 588-599. doi:
10.1016/j.compedu.2009.09.008.
Marks, R. B., Sibley, S. D., and Arbaugh, J. B. (2005). A
Structural Equation Model of Predictors for Effective
Online Learning. Journal of Management Education,
29(4), 531-563. doi: 10.1177/1052562904271199.
Martin, A. J. (2007). Examining a multidimensional model
of student motivation and engagement using a
construct validation approach. British Journal of
Educational Psychology, 77(2), 413-440. doi:
10.1348/000709906X118036.
Narciss, S. (2008). Feedback strategies for interactive
learning tasks. In J. M. Spector, M. D. Merrill, J. J. G.
van Merrienboer and M. P. Driscoll (Eds.), Handbook
of Research on Educational Communications and
Technology (3 ed., pp. 125-144). Mahaw, NJ:
Lawrence Erlbaum Associates.
Narciss, S., and Huth, K. (2006). Fostering achievement
and motivation with bug-related tutoring feedback in a
computer-based training for written subtraction.
Learning and Instruction, 16(4), 310-322. doi:
10.1016/j.learninstruc.2006.07.003.
Nistor, N., Baltes, B., Dascălu, M., Mihăilă, D., Smeaton,
G., and Trăuşan-Matu, Ş. (2014). Participation in
virtual academic communities of practice under the
influence of technology acceptance and community
factors. A learning analytics application. Computers in
Human Behavior, 34, 339-344. doi:
10.1016/j.chb.2013.10.051.
Oblinger, D. G. (2012). Let's Talk... Analytics.
EDUCAUSE Review, 47(4), 10-13.
Pekrun, R., Goetz, T., Frenzel, A. C., Barchfeld, P., and
Perry, R. P. (2011). Measuring emotions in students’
learning and performance: The Achievement Emotions
Questionnaire (AEQ). Contemporary Educational
Psychology, 36(1), 36-48. doi:
10.1016/j.cedpsych.2010.10.002.
Richardson, J. T. E. (2012). The attainment of White and
ethnic minority students in distance education.
Assessment & Evaluation in Higher Education, 37(4),
393-408. doi: 10.1080/02602938.2010.534767.
Rienties, B., and Alden Rivers, B. (2014). Measuring and
Understanding Learner Emotions: Evidence and
Prospects. Learning Analytics Review 1, Learning
Analytics Community Exchange (LACE).
http://www.laceproject.eu/learning-analytics-
review/measuring-and-understanding-learner-
emotions/
Rienties, B., Cross, S., and Zdrahal, Z. (2015).
"Implementing a Learning Analytics Intervention and
Evaluation Framework: what works?" In B.
Motidyang and R. Butson (Eds.): Big data and
learning analytics in higher education. Springer,
Berlin.
Rienties, B., Tempelaar, D. T., Giesbers, B., Segers, M.,
and Gijselaers, W. H. (2012). A dynamic analysis of
social interaction in Computer Mediated
Communication; a preference for autonomous
learning. Interactive Learning Environments,
22(5),
631-648. doi: 10.1080/10494820.2012.707127.
Rienties, B., Tempelaar, D. T., Van den Bossche, P.,
Gijselaers, W. H., and Segers, M. (2009). The role of
academic motivation in Computer-Supported
Collaborative Learning. Computers in Human
Behavior, 25(6), 1195-1206. doi:
10.1016/j.chb.2009.05.012.
Schmidt, H. G., Van Der Molen, H. T., Te Winkel, W. W.
R., and Wijnen, W. H. F. W. (2009). Constructivist,
Problem-Based Learning does work: A meta-analysis
of curricular comparisons involving a single medical
StabilityandSensitivityofLearningAnalyticsbasedPredictionModels
165

school. Educational Psychologist, 44(4), 227-249. doi:
10.1080/00461520903213592.
Siemens, G. (2013). Learning Analytics: The Emergence
of a Discipline. American Behavioral Scientist, 57(10),
1380-1400. doi: 10.1177/0002764213498851.
Siemens, G., Dawson, S., and Lynch, G. (2013).
Improving the quality of productivity of the higher
education sector: Policy and strategy for systems-level
deployment of learning analytics: Solarresearch.
Stiles, R. J. (2012). Understanding and Managing the
Risks of Analytics in Higher Education: A Guide:
Educause.
Tempelaar, D. T., Heck, A., Cuypers, H., van der Kooij,
H., and van de Vrie, E. (2013). Formative Assessment
and Learning Analytics. In D. Suthers and K. Verbert
(Eds.), Proceedings of the 3rd International
Conference on Learning Analytics and Knowledge,
205-209. New York: ACM. doi:
10.1145/2460296.2460337.
Tempelaar, D. T., Kuperus, B., Cuypers, H., Van der
Kooij, H., Van de Vrie, E., and Heck, A. (2012). “The
Role of Digital, Formative Testing in e-Learning for
Mathematics: A Case Study in the Netherlands”. In:
“Mathematical e-learning” [online dossier].
Universities and Knowledge Society Journal (RUSC),
9(1). UoC.
Tempelaar, D. T., Niculescu, A., Rienties, B., Giesbers,
B., and Gijselaers, W. H. (2012). How achievement
emotions impact students' decisions for online
learning, and what precedes those emotions. Internet
and Higher Education, 15(3), 161–169. doi:
10.1016/j.iheduc.2011.10.003.
Tempelaar, D. T., Rienties, B., and Giesbers, B. (2009).
Who profits most from blended learning? Industry and
Higher Education, 23(4), 285-292.
Tempelaar, D. T., Rienties, B., and Giesbers, B. (2014).
Computer Assisted, Formative Assessment and
Dispositional Learning Analytics in Learning
Mathematics and Statistics. In M. Kalz and E. Ras
(Eds.), Computer Assisted Assessment. Research into
E-Assessment, pp. 67-78. Berlin, Springer:
Communications in Computer and Information
Science, Volume 439. doi: 10.1007/978-3-319-08657-
6_7.
Tempelaar, D. T., Rienties, B, and Giesbers, B. (2015). In
search for the most informative data for feedback
generation: Learning analytics in a data-rich context.
Computers in Human Behavior, 47, 157-167. doi:
10.1016/j.chb.2014.05.038.
Thakur, G., Olama, M. M., McNair, W., Sukumar, S. R.,
and Studham, S. (2014). Towards Adaptive
Educational Assessments: Predicting Student
Performance using Temporal Stability and Data
Analytics in Learning Management Systems. In:
Proceedings 20th ACM SIGKDD conference on
knowledge discovery and data mining: ACCESS, New
York city, NY.
Tobarra, L., Robles-Gómez, A., Ros, S., Hernández, R.,
and Caminero, A. C. (2014). Analyzing the students’
behavior and relevant topics in virtual learning
communities. Computers in Human Behavior, 31, 659-
669. doi: 10.1016/j.chb.2013.10.001.
Verbert, K., Manouselis, N., Drachsler, H., and Duval, E.
(2012). Dataset-Driven Research to Support Learning
and Knowledge Analytics. Journal of Educational
Technology & Society, 15(3), 133-148.
Vermunt, J. D. (1996). Metacognitive, cognitive and
affective aspects of learning styles and strategies: A
phenomenographic analysis. Higher Education, 31,
25–50. doi: 10.1007/BF00129106.
Whitelock, D., Richardson, J., Field, D., Van Labeke, N.,
and Pulman, S. (2014). Designing and Testing Visual
Representations of Draft Essays for Higher Education
Students. Paper presented at the LAK 2014,
Indianapolis.
Wolff, A., Zdrahal, Z., Nikolov, A., and Pantucek, M.
(2013). Improving retention: predicting at-risk
students by analysing clicking behaviour in a virtual
learning environment. In D. Suthers and K. Verbert
(Eds.), Proceedings of the 3rd International
Conference on Learning Analytics and Knowledge,
145-149. New York: ACM. doi:
10.1145/2460296.2460324.
CSEDU2015-7thInternationalConferenceonComputerSupportedEducation
166
