
Development of Electronic Textbook for Chemical Experiment
Taking Esterification as an Example
Akira Ikuo,
Yusuke Yoshinaga and Haruo Ogawa
Department of Chemistry, Tokyo Gakugei University, Tokyo 184-8501, Japan
Keywords: CG, Visualization, Electronic Textbook, Chemical Experiment.
Abstract: Developing policy of electronic textbook for chemical experiment of student’s laboratory at the university
was decided which aimed at integration of observable level experiment and the molecular world. The
developed textbook could display picture of apparatus and flow-chart of small-scale experiment in addition
to CG teaching material. The CG teaching material in the textbook effectively demonstrates images of
dynamical reaction mechanism. Students were able to conduct experiment smoothly and safely with the
electronic textbook inserted in the Ziploc type plastic bag.
1 INTRODUCTION
Understanding the observed phenomena, chemists
use to imagine and explain observations in terms of
molecules. Observed phenomena and molecular
level models are then represented in terms of
mathematics and chemical equation (Gilbert, 2009
and Tasker, 2010). Student’s difficulties and
misconceptions in chemistry are from inadequate or
inaccurate models at the molecular level (Kleinman,
1987). A molecular structure visualized by the
computer graphics (CG) provides a deeper
understanding of molecular structure (Tuvi-Arad,
2006).
It is our aim to produce a CG teaching material
based on quantum chemical calculations, which
provides realizable images of the nature of chemical
reaction (Ikuo, 2006 and 2009). Molecular level
animations combined with video clips of
macroscopic phenomena enabled students to predict
the outcome better (Velazquez-Marcano, 2004). If
the CG teaching material is combined with chemical
experiments of student’s laboratory, students would
observe the reaction from three thinking levels,
namely, phenomena in the actual observable level
and CG teaching material in the molecular level, and
chemical equation in the symbolic level.
The CG teaching material on the tablet computer
was effective to provide image of “Energy” change
and also effective to provide image of “Structure”
change and “Migration of Electron” during chemical
reaction (Ikuo, 2012). Our ultimate goal is to
produce an electronic textbook linking chemical
experiment, which integrates these three levels.
This paper introduces our works of CG
visualization of fundamental chemical reactions for
realizing certain images of the reaction mechanism
and development of the electronic textbook for
chemical experiment of student’s laboratory at the
university, which integrates the observable level
experiment and the molecular world of the
esterification.
2 DEVELOPMENT OF
ELECTRONIC TEXTBOOK
2.1 Policy
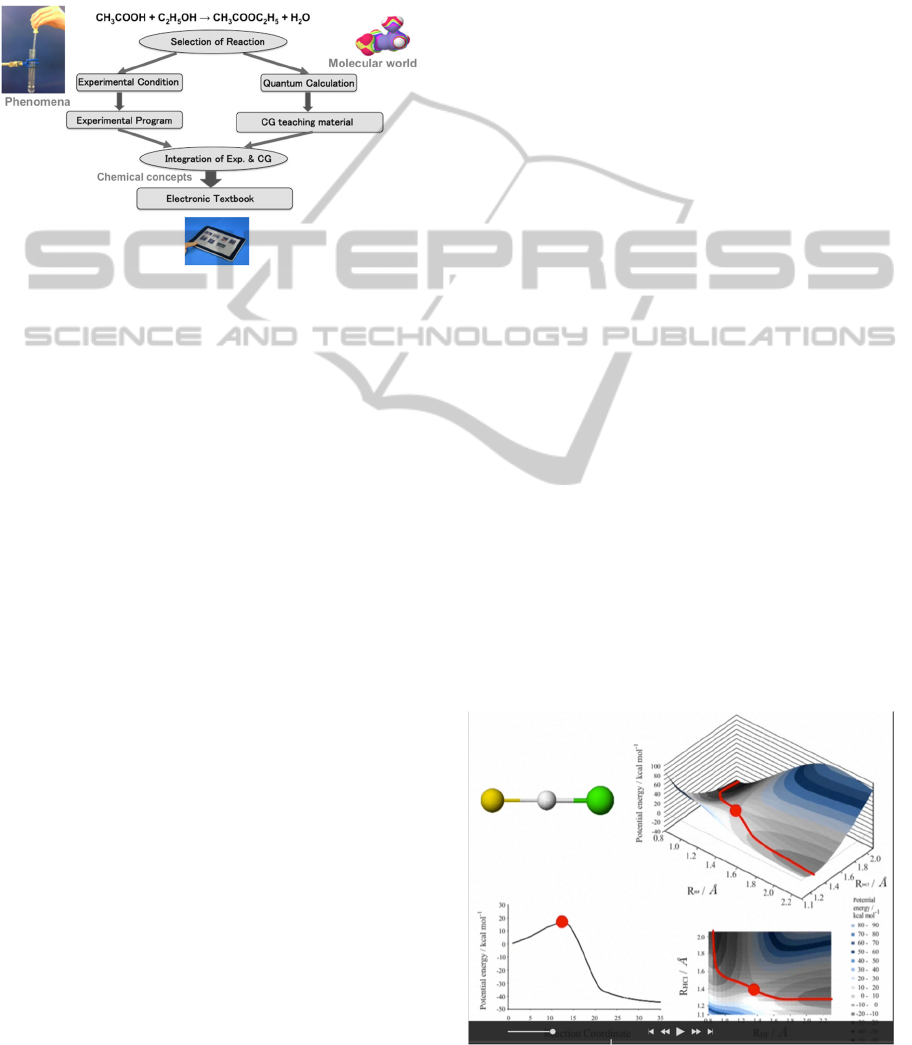
Flow chart of development of the electronic
textbook for chemical experiment is shown in the
Scheme 1. Reaction was selected based on
importance in fundamental chemistry. To exhibit
phenomena, experimental condition was optimized
for the student laboratory and experimental program
was made. For easier understanding of experimental
procedure, enlargeable-photos and flow charts were
used in addition to regular text-base description. The
electronic textbook could acts as an individual
electronic tutor. To provide image of molecular
world, computer graphics (CG) images such as
realistic shape of molecules, CG teaching material
(movie) were made based on quantum chemistry
553
Ikuo A., Yoshinaga Y. and Ogawa H..
Development of Electronic Textbook for Chemical Experiment - Taking Esterification as an Example.
DOI: 10.5220/0005491705530557
In Proceedings of the 7th International Conference on Computer Supported Education (CSEDU-2015), pages 553-557
ISBN: 978-989-758-108-3
Copyright
c
2015 SCITEPRESS (Science and Technology Publications, Lda.)
calculation. Students would be able to see structure
and energy change during reaction while they are
watching actual reaction progress. In this manner,
observable level experiment and the molecular
world could be integrated. In order to use the
electronic textbook on the lab bench, it need to be
covered with a waterproof, Zip-lock type, case.
Scheme 1: Flow chart of developing method.
2.2 Method
2.2.1 Quantum Chemical Calculation
Structures of intermediates on reactions and their
electrostatic potentials on electron density were
calculated as follows: the semi-empirical molecular
orbital calculation software MOPAC (Stewart, 1989)
with AM1, PM3, and PM5 Hamiltonian in the
CAChe Work System for Windows (Former name of
SCIGRESS, ver. 6.01, FUJITSU, Inc.) was used in
all of calculations for optimization of geometry by
the Eigenvector Following method, for search of
transition state by use of the program with Saddle
point Search, and for search of the reaction path
from the reactants to the products via the transition
state by the intrinsic reaction coordinate (IRC)
calculation (Fukui, 1970). Details of procedure of
the quantum chemical calculations were described in
the previous paper (Ikuo et al., 2006). The
electrostatic potential on electron density (EPED)
(Kahn, 1986) was calculated based on structures
from the results of the IRC calculation.
2.2.2 CG Teaching Material and Electronic
Textbook
A movie of the reaction path was produced by the
software DIRECTOR (ver. 8.5.1J, Macromedia,
Inc.) following the display of the bond order of the
structure of the reactants in each reaction stage,
which was drawn by the CAChe. The obtained CG
of EPED model was combined with those of ball-
and-stick model and reaction profile in the same
reaction stage. It was confirmed that the drawn CGs
of the molecular models of reactants moves
smoothly. The green ball, which indicates progress
of the reaction, was arranged on the reaction profile
and simultaneous movements of the ball and the
reactants were confirmed. Created movie file was
converted to the Quick Time movie for iPad by the
Quick Time PRO (ver. 7.66, Apple, Inc.). Electric
textbook was produced with iBooks Author (ver.
2.1.1, Apple, Inc.) and was saved to iPad (Apple,
Inc.) by using the iTunes (ver. 11.2.1, Apple, Inc.).
3 ELECTRONIC TEXTBOOK
3.1 Contents of Electronic Textbook
3.1.1 Reactions
Formation of HF: The CG teaching material of
rearrangement by collision of diatomic molecule and
F + HCl → HF + Cl
(1)
one atom as shown in equation (1) was developed.
Potential energy (PE) of 2-D and 3-D is shown in
the Figure 1. The figure clearly shows these changes
of PEs with display on PE surface in 3-D, which
offers a bird-eye view of the reaction profile. Two
Valleys of lower energies and hilltop on the
transition state at the saddle point can be recognized
boldly. Possible pathways of the reaction from the
reactants of F and HCl to the products of HF and Cl
via the transition state at saddle point can be readily
traced. The CG teaching material is able to provide
information about change of the PE and structure of
reactants in a certain state simultaneously.
Figure 1: CG teaching material of HF formation.
CSEDU2015-7thInternationalConferenceonComputerSupportedEducation
554
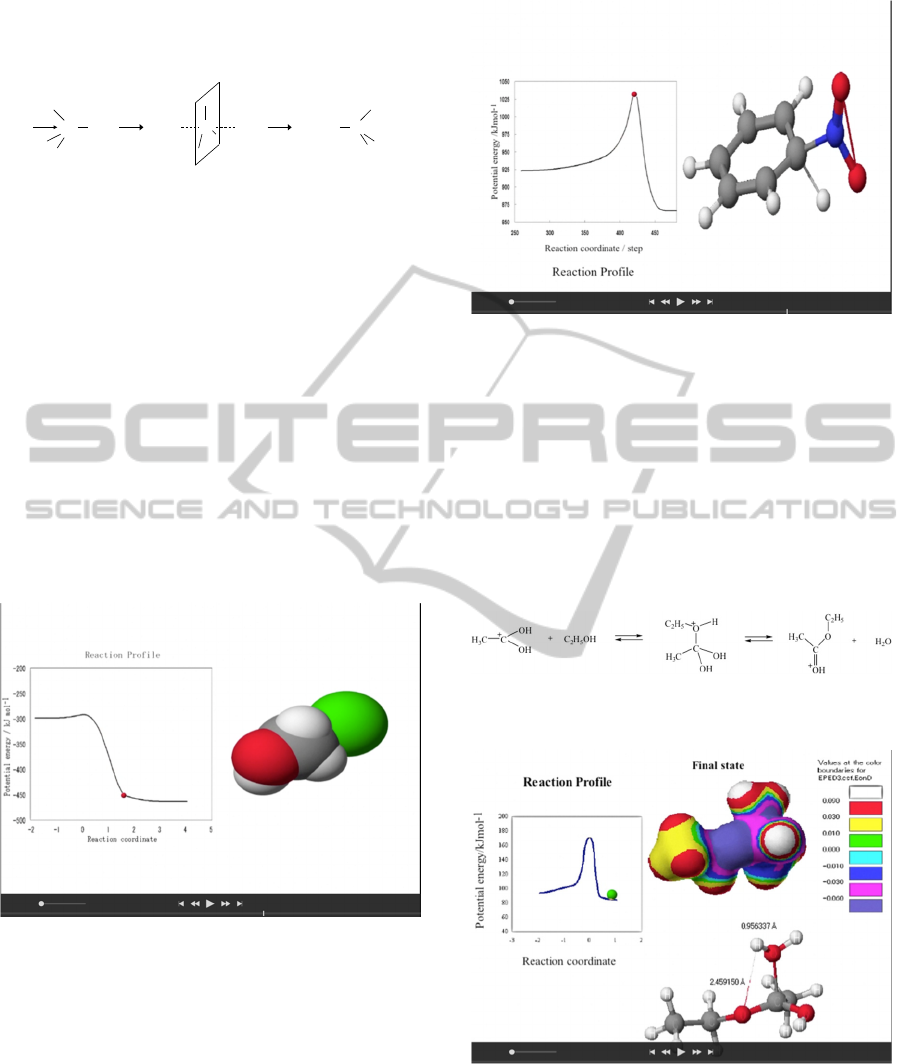
Walden’s inversion: Structural change of reactants
in the reaction, shown in the Scheme 2, was studied
as a model of Walden’s inversion.
Scheme 2: Images of Walden’s inversion.
Reaction of hydroxide and chloromethane is a
typical example of the Nucleophilic Substitution in
the 2
nd
order reaction. Carbon atom at the centre to
which halogen attaches is attacked by the
nucleophile, hydroxide, from a position 180 degrees
from chlorine and then methyl alcohol forms.
Picture of CG movies are shown in the Figure 2. The
CG shows the reaction profile, which demonstrates
the degree of the reaction progress by the ball
indicating the potential energy vs. the reaction
coordinate. Movies were made by using not only the
ball-and-stick model, which shows change in
molecular configuration easily, but also the space-
filling model, which shows realistic shape. A student
is expected to obtain the image of an umbrella
reverse like motion in Walden’s inversion.
Figure 2: CG teaching material of Walden’s inversion.
Nitration of Benzene: A picture of teaching
material is shown in the Figure 3. Left part of the
material shows the reaction profile, potential energy
vs. reaction coordinate, which indicates the degree of
the reaction progress by the red ball on the profile.
Right part shows structural change shown in ball and
stick model, While choreographed animation of
chemical reaction are common (For example, Tasker
& Dalton, 2010), CG based on theory in the present
study could provide not only images of energy
change but also images of dynamical structure
change with more realistic shape.
Figure 3: CG teaching material of benzene nitration.
Esterification of Ethanol and Acetic Acid: The
mechanism of esterification of acetic acid and ethyl
alcohol the reaction is well known (For example
Loudon, 1984), and generally, the esterification
proceeds in the presence of proton catalyst. The rate-
determining step includes the paths of an attack of
the oxygen atom of hydroxyl group of ethyl alcohol
to the central carbon of the formed carbonium ion
and release of water as shown in the Scheme 3. This
step dominates all over the reaction.
Scheme 3: Mechanism of esterification on the rate-
determining step.
Figure 4: CG teaching material of esterification.
The Figure 4 shows the combination CGs on the
way from the state of reactants to that of products
via the transition state. The teaching material
demonstrates the changes of electrostatic potential
and realistic shape of the intermediate of the reaction
on the reaction profile in all stages at the same time.
C Cl
H
H
H
OH
‐
C
Cl
H
H
H
OH
-
C
Cl
-
H
H
H
OH
+
DevelopmentofElectronicTextbookforChemicalExperiment-TakingEsterificationasanExample
555
Distribution of the electrostatic potential among
the intermediate can be seen by the colours. The
model by electrostatic potential provides information
about electrostatic distribution of the intermediate on
the way of the reaction.
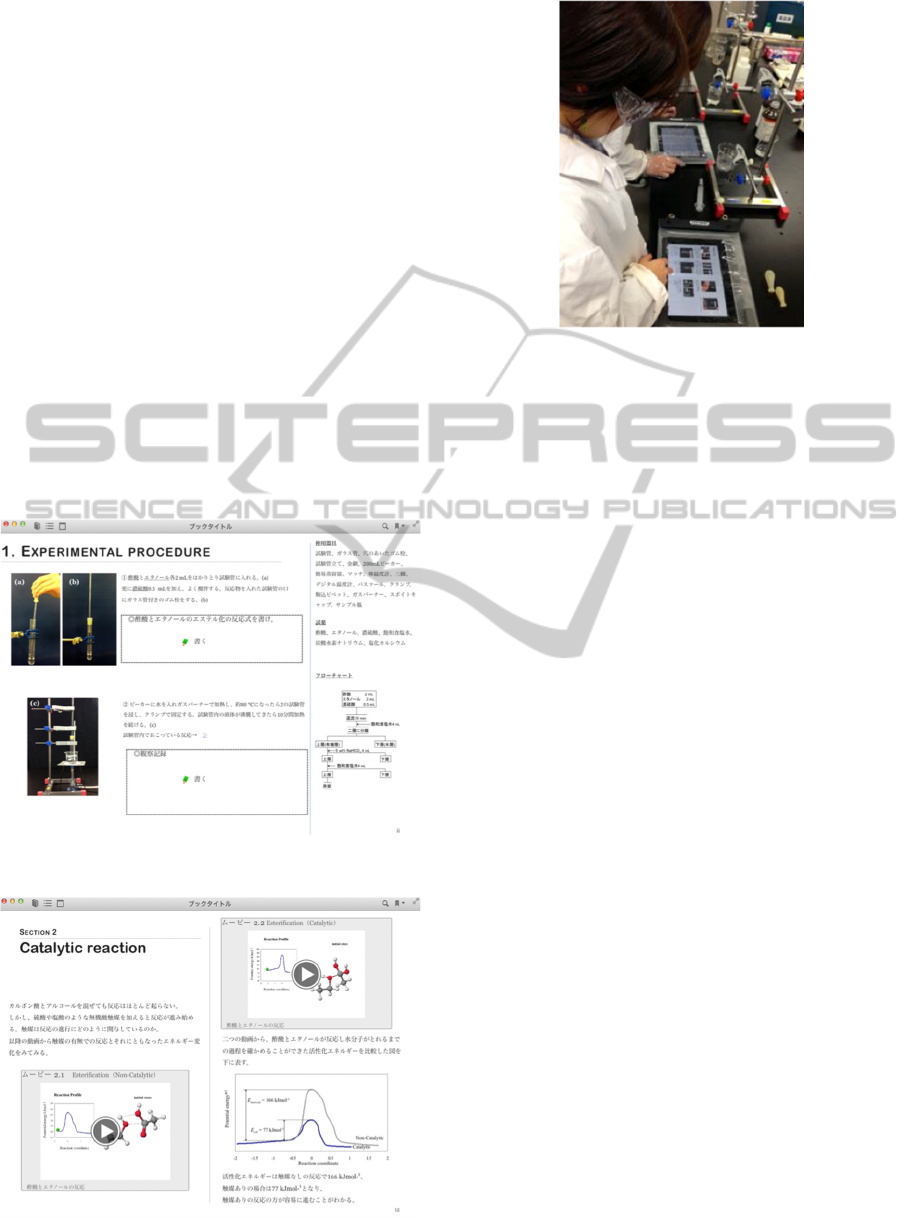
3.1.2 Feature of Electronic Textbook
The CG teaching material of the esterification was
combined with chemical experiments of student’s
laboratory for the purpose of making electronic
textbook of basic chemistry to provide experiment at
the observable-level, CG visualization at the
molecular-level, and chemical equation at the
symbolic-level.
The electronic textbook was inserted with images
of experimental procedure in the flow charts and
photographs, which can be enlarged by students
touch (Figure 5). Student can write memo for the
observation. CG teaching materials of reaction
profiles were also inserted (Figure 6). When student
touches the CG teaching material in the tablet
Figure 5: Experimental procedure in electronic textbook.
Figure 6: CG teaching material in electronic textbook.
Figure 7: Electronic textbook with waterproof cover.
computer, the teaching material appears to show
image of the structural change during the reaction.
Student can compare different reaction mechanisms.
If student touches the material again, the Quick
Time control bar appears and the green ball on the
profile can move by student’s choice. Student can
manipulate the reaction back and forth until they
obtain the image of the reaction.
Students were able to conduct experiment smoothly
and safely with the electronic textbook inserted in
the Ziploc type plastic bag (Figure 7).
4 CONCLUSIONS
Developing policy of electronic textbook for
chemical experiment of student’s laboratory at the
university was decided which aimed at integration of
observable level experiment and the molecular
world. The electronic textbook was developed
according to the policy. The developed textbook
could display picture of apparatus and flow-chart of
small-scale experiment in addition to CG teaching
material. The CG teaching material in the textbook
effectively demonstrates images of dynamical
reaction mechanism. From the preliminary study,
students were able to conduct experiment smoothly
and safely with the electronic textbook inserted in
the Ziploc type plastic bag. The developed electronic
textbook could be used to integrate the observable
level experiment and the molecular world.
ACKNOWLEDGEMENTS
This work was supported by JSPS Grant-in-Aid for
Scientific Research (C) (25350188).
CSEDU2015-7thInternationalConferenceonComputerSupportedEducation
556

REFERENCES
Fukui, K., 1970. A Formulation of the Reaction
Coordinate, J. Phys. Chem., 74, 4161-4163.
Gilbert, J. K., Treagust, D. F., 2009. in Gilbert, J. K.,
Treagust, D. (eds.), “Models and Modelling in Science
Education Vol. 4 Multiple Representations in
Chemical Education”, Springer, 333-350.
Ikuo, A., Ikarashi, Y., Shishido, T. and Ogawa, H., 2006.
User-friendly CG visualization with animation of
chemical reaction: esterification of acetic acid and
ethyl alcohol and survey of textbooks of high school
chemistry, Journal of Science Education in Japan, 30
(4), 210-215.
Ikuo A., Nagashima H., Yoshinaga Y., and Ogawa H.,
2009. Calculation of potential energy in the reaction of
“I + H
2
→ HI + H”, and its visualization, The
Chemical Education Journal (CEJ),
Registration #13-2.
Ikuo, A., Nagashima, H., Yoshinaga, Y., and Ogawa, H.,
2012. Development and practice of teaching material
in tablet computer based on computer graphics by
quantum chemistry calculation - Reaction of I + H
2
→
HI + H -, Proc. 7th IEEE Intl. Conf. on Wireless,
Mobile, and Ubiquitous Technologies in Educ., 82-86.
Ikuo, A., Yoshinaga, Y., and Ogawa, H., 2014. An
Approach to the Electronic Textbook of Basic
Chemistry Linking Chemical Experiments - CG
Teaching Materials Based on Quantum Chemical
Calculation -, Proc. 5th Intl. Conf. on Computer
Supported Educ. (CSEDU 2013), 688-691.
Ikuo, A., Yoshinaga, Y., and Ogawa, H., 2014. CG
Teaching Material for the Electronic Laboratory
Textbook - Esterification of Acetic Acid and Ethanol,
Proc. 6th Intl. Conf. on Computer Supported Educ.
(CSEDU 2014), 226-231.
Kahn, S. D., Pau, C. F., Overman, L. E. and Hehre, W. J.,
1986. Modeling Chemical Reactivity. 1.
Regioselectivity of Diels-Alder Cycloadditions of
Electron-Rich Dienes with Electron-Deficient
Dienophiles, J. Am. Chem. Soc., 108, 7381-7396.
Kleinman, R. W., Griffin, H. C., Kerner, N. K., 1987. J.
Chem. Edu., 64, 766-770.
Loudon, G. M., 1984. Organic Chemistry, Addison-
Wesley Publishing Co., Inc., p.1010.
Stewart, J. J. P., 1989. Optimization of parameters for
semi empirical methods I. Method, J Comp. Chem., 10
(2), 209–220.
Tasker, R., Dalton, R., 2010. in Gilbert, J. K., Reiner, M.,
Nakhleh, M. (Eds.), “Models and Modelling in
Science Education Vol. 3 Visualization: Theory and
Practice in Science Education”, Springer, 103-131.
Tuvi-Arad, I. and Blonder, R., 2006. Continuous
symmetry and chemistry teachers: learning advanced
chemistry content through novel visualization tools,
Chem. Educ. Res. and Pract., 11(1), 48-58.
Velazquez-Marcano, A., Williamson, V. M., Ashkenazi,
G., Tasker, R. F., and Williamson, K. C., 2004. The
use of video demonstrations and particulate animation
in general chemistry, J. Sci. Educ. and Tech., 13(3),
315-323.
DevelopmentofElectronicTextbookforChemicalExperiment-TakingEsterificationasanExample
557
