
Localizing Changes in Driver Behavior via Frequency-pattern-analysis
M. Schneider, M. Sieber and B. F
¨
arber
Human Factors Institute (IfA), Universit
¨
at der Bundeswehr M
¨
unchen, Werner-Heisenberg-Weg 39, Neubiberg, Germany
Keywords:
Data Analysis, Driver Behavior, Driver Assistance Systems, T-Test, Fourier-Series.
Abstract:
Explorative analysis of driver behavior, a key variable in the context of automotive research and development,
can be tedious. The authors present a quick and easy method to identify changes in recorded driver behavior
data. The method consists of a data processing algorithm that uses Fourier-series and statistical t-tests to
identify points in time where changes in the frequency of the recorded signal occur. An exemplary use-
case for the method is presented for driver steering torque data obtained in an experiment with an automatic
obstacle-avoidance maneuver. The results allow for the assumption that changes in frequency of driver steering
torque may mark meaningful, implicit changes in driver behavior even when driver behavior does not explicitly
change, thereby making obvious the potential of the proposed analysis method.
1 MOTIVATION
Driver behavior is a key variable in the context of au-
tomotive research and development. For the evalua-
tion of a driver assistance system, for example, driv-
ing experiments are conducted to observe the human-
machine-interaction. Manual processing of the at-
tained data is tedious but often the only option where
the analysis is of an explorative nature and points of
interest within the analyzed data are yet unknown.
For this reason the authors of this paper devised a
method to automatically identify changes in subjects’
driving behavior without the need to manually sight
individual data.
2 ALGORITHM
The proposed method utilizes a combination of
Fourier-series, see e.g. (Goebbels and Ritter, 2011),
and t-tests, see e.g. (Bortz, 1977). Based on the
assumption that changes in recorded driver behav-
ior (e.g. driver steering wheel torque) manifest in a
change of the frequency pattern of the recorded sig-
nal, the method poses a viable tool for the explorative
analysis of driver behavior.
2.1 Theoretical Approach
In order to be able to detect points of interest within
recorded data, where the recorded signal changes sig-
nificantly, the processing algorithm must employ sta-
tistical tests comparing the data preceding the point of
interest to the data following it.
To do so, at least one of the data’s characteristics
must be chosen for comparison. The authors chose
the frequency of the recorded signal. Fourier-fitting
the data and comparing frequencies allows for com-
parison of trends and tendencies rather than merely
absolute values, and can therefore potentially prove
more revealing. Other methods of fitting the recorded
signal (linear, polynominal, Gaussian and spline fit-
ting) and comparing the resulting characteristic pa-
rameters have been considered but not been found to
yield better results.
The authors employed Fourier fitting of the fourth
order based on the equation (Mathworks, 2015)
g(x) = a
0
+
∑
i=4
i=1
a
i
· cos(i · x · f ) + b
i
· sin(i · x · f )
Comparing the entire range of parameters of the
Fourier series (a
0
to a
4
, b
1
to b
4
and f ) in order
to identify points of interest using multivariate anal-
ysis of variance has not proven more advantageous
than comparing only the frequencies f , which in turn
requires less computational power and is therefore
preferable.
In a first approach, the authors chose a repeated
measures t-test for the purpose of testing for signifi-
cance. The repeated measures or paired t-test calcu-
lates the probability of yielding a difference between
paired samples of at least the observed mean differ-
ence, given its distribution (estimated by the observed
standard deviation of the differences) and sample size.
33
Schneider M., Sieber M. and Färber B..
Localizing Changes in Driver Behavior via Frequency-pattern-analysis.
DOI: 10.5220/0005486800330038
In Proceedings of the 1st International Conference on Vehicle Technology and Intelligent Transport Systems (VEHITS-2015), pages 33-38
ISBN: 978-989-758-109-0
Copyright
c
2015 SCITEPRESS (Science and Technology Publications, Lda.)
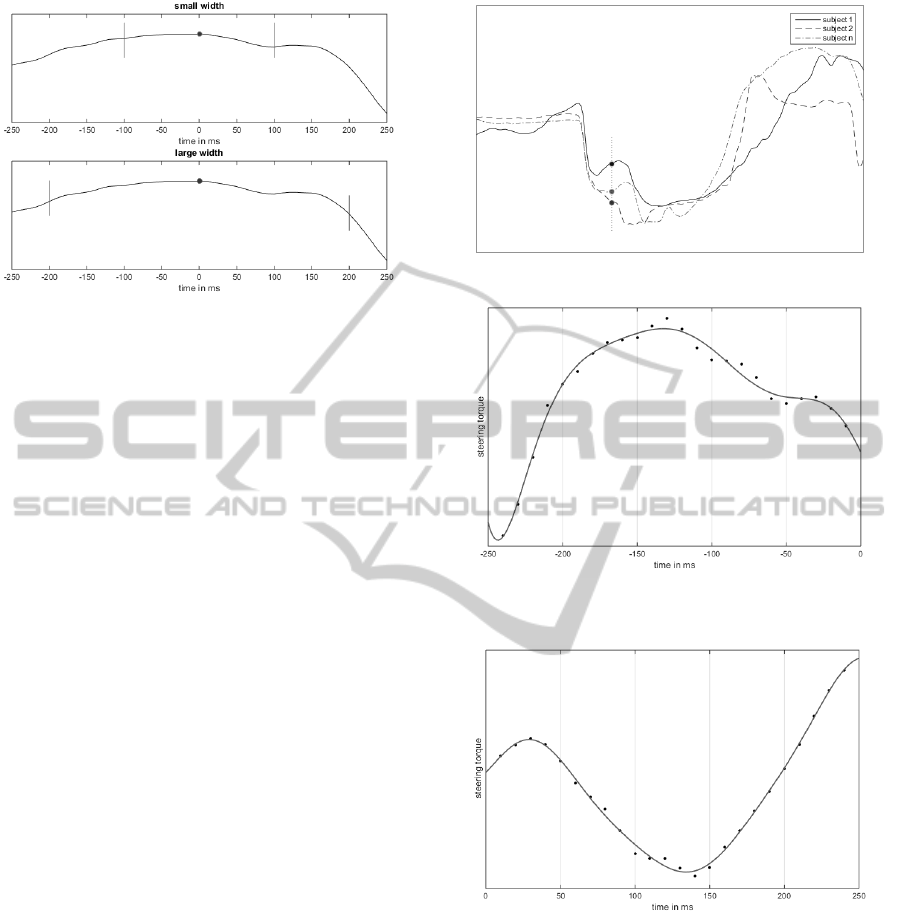
Figure 1: Specified widths around data point.
The test is based on the assumption that the dif-
ferences are normally distributed, a requirement that
may not necessarily be met. It should be noted, how-
ever, that the t-test has proven very robust even when
this requirement is violated. Moreover, replacing the
suggested t-test with any other significance test (e.g.
non-parametric tests) within the method will work
equally well.
2.2 Requirements
For optimal results and fast processing, the data
should comply with the following criteria:
• Data of all test subjects should be synchronized
to a well-defined point in time (e.g. the onset of
a driver assistance function’s intervention). Well-
parallelized data leads to higher accuracy of the
results.
• Data should be recorded in high frequency. A
higher number of measurements per time unit fa-
cilitates convergence of the analysis.
Beyond these requirements, a time window within
the recorded data must be selected as subject of the
analysis.
2.3 Processing the Data
In order to detect a change in driver behavior, the fre-
quency patterns of the recorded signal preceding ev-
ery measurement point within the examined time win-
dow are compared to those following the measure-
ment point.
To do so, an algorithm first isolates data in a spec-
ified width around one point in time (Figure 1) from
each test subject’s data set (Figure 2) and then per-
forms a Fourier-fitting of the isolated data left (Figure
3), as well as of the data right (Figure 4) of this point.
In a second step, the attained Fourier-frequencies
for the local data preceding and following this point in
Figure 2: Current point of analysis in synchronized data.
Figure 3: Fourier-fitting (solid line) of the data points (dots)
left of an exemplary point of analysis.
Figure 4: Fourier-fitting (solid line) of the data points (dots)
right of an exemplary point of analysis.
time (Table 1) are compared to each other for all test
subjects using a within-subjects t-test. The p-value
and effect size resulting from the comparison at this
data point are saved and plotted.
A variation of the widths of the seperated time
windows entails the option of weighting an effect in
the analysis depending on its time scale. Effects with
long-term influence are detected more easily and re-
aliably when utilizing larger widths, while smaller
area-widths facilitate the detection of short term ef-
fects. Utilizing an entire spectrum of widths for the
VEHITS2015-InternationalConferenceonVehicleTechnologyandIntelligentTransportSystems
34
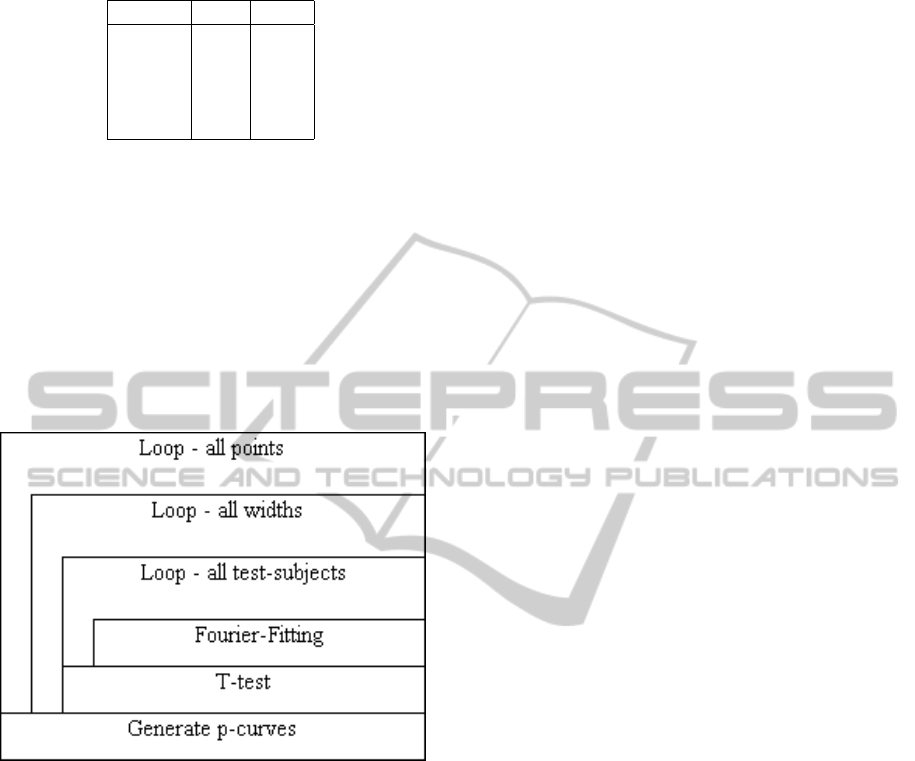
Table 1: Calculated frequencies for t-test.
sub ject f
le ft
f
right
1 f
l1
f
r1
2 f
l2
f
r2
3 f
l3
f
r3
... ... ...
n f
ln
f
rn
analysis enables a broader examination of both long
and short term effects.
The two steps of Fourier-fitting and statistical test-
ing are repeated progressively for each data point
within the examined time frame. In the end, the
procedure returns the p-values plotted over time, en-
abling the data analyst to quickly assess brief periods
of interest where p-values are low and driver behavior
has apparently changed.
The entire procedure is pictured in Figure 5.
Figure 5: Structogram of the algorithm.
2.4 Analysis and Results
Experimental use of this method has shown that a plot
of the averaged p-values for all area-widths over time
is a valuable way to visually process the results of
such an analysis. Local or global minima in this curve
mark points of interest in the analyzed data, that in-
vite further investigation into the cause of change in
driver behavior at these points. The resulting knowl-
edge can then be used to retrospectively analyze the
data of each test subject at the identified points of in-
terest.
3 PRACTICAL USE IN DRIVER
BEHAVIOR ANALYSIS
3.1 Background
Driver steering torque data obtained in a driving ex-
periment with an automatic obstacle-avoidance ma-
neuver will serve as an exemplary use-case for the
proposed analysis method.
In the experiment 60 test subjects drove an instru-
mented car with electrical power steering. During the
experiment, a driver assistant system applied torque to
the steering wheel to steer left in order to avoid collid-
ing with an obstacle on the road ahead. The assistance
system would subsequently apply torque to the steer-
ing wheel to steer right in order to restore the car’s
original heading. Each test subject experienced the
automatic steering intervention under two conditions:
the legitimate condition where the steering interven-
tion was triggered in reaction to a suddenly appear-
ing obstacle, and the illegitimate condition where the
steering intervention was triggered on an empty road,
simulating a faulty activation (Figure 6).
It was expected a priori that driver steering torque
would initially be opposed to the torque applied by
the assistance system due to the inertia of the driver’s
hands as well as that of the steering wheel itself, and
possibly due to drivers’ first reaction of unreflect-
edly holding the steering wheel in position as they
would in reaction to other steering perturbances such
as wind gusts or potholes. It was further expected
that, shortly thereafter, drivers would uphold their re-
sistance against the torque applied by the assistance
system in the illegitimate condition in order to over-
ride the unjustified steering intervention, while resis-
tance would decline or disappear entirely in the legit-
imate condition, as drivers give in to or even support
the efforts of the assistance system.
While the expectations for the illegitimate condi-
tion were met, the resulting data showed that the over-
whelming majority of test subjects did not lessen their
resistance against the torque applied by the assistance
system during the steering left phase of the maneuver
even in the legitimate condition. This may be a result
of the assistant system’s target trajectory aiming for a
transverse offset of unnecessary extent, attempting to
take the car much further to the left than drivers felt
the need for.
3.2 Research Question
Despite the initial, supposedly unreflected, reaction
and the later, supposedly reflected, reaction of the
drivers to the automatic steering intervention having
LocalizingChangesinDriverBehaviorviaFrequency-pattern-analysis
35
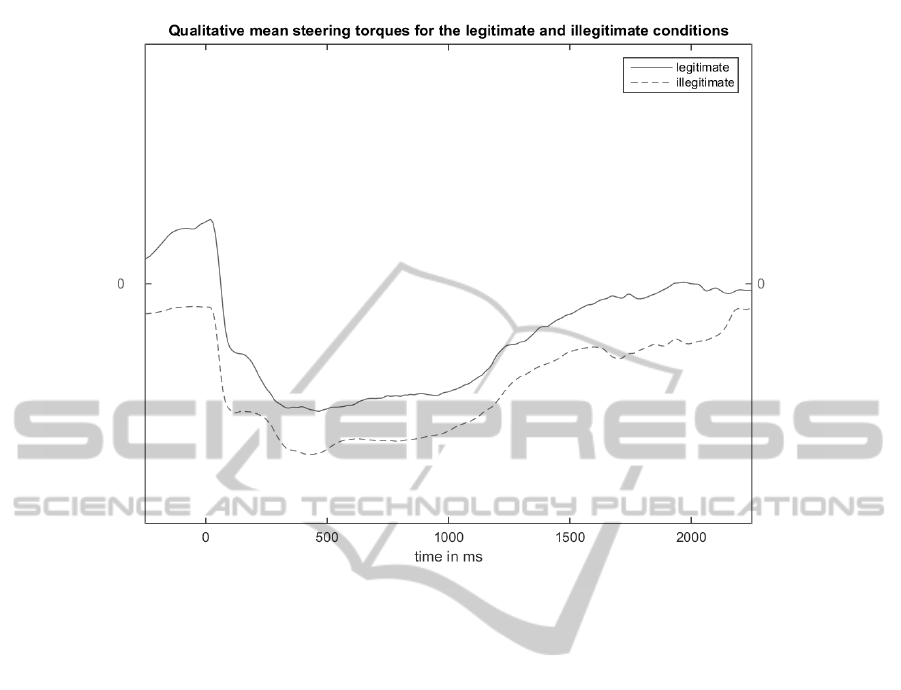
Figure 6: Qualitative mean steering torque in the legitimate (solid line) and illegitimate (dashed line) conditions.
been the same, i.e. trying to hold the steering wheel in
place, in both conditions, the authors intended to in-
vestigate whether it was possible to identify the point
in time where the supposedly unreflected initial reac-
tion ends. The underlying hypothesis hereby having
been that the later, supposedly reflected, reaction of
the drivers may be of a different quality regarding the
frequency pattern of the driver steering torque.
4 RESULTS AND FURTHER USE
4.1 Results
The test subjects’ data were synchronized to the on-
set of the automatic steering intervention (defined as
time=0s) and processed using the proposed method as
described in (2.2). Using an alpha-level of 5%, the re-
sulting p-value plot for the legitimate condition (Fig-
ure 7) yields points of interest at the onset of the auto-
matic steering event (A), as well as at approximately
120ms (B), 360ms (C), 1130ms (D), and 1840ms (E)
thereafter. The resulting p-value plot for the illegit-
imate condition (Figure 8) yields the same points of
interest with the exception of (E).
The changes in driver steering torque frequency
discovered in the legitimate condition at (A), (D) and
(E) are trivial. They mark the onset of the automatic
steering intervention, the change of direction of the
steering torque applied by the assistance system in or-
der to restore the car’s original heading, and the end
of the automatic steering event respectively. The sig-
nificant changes in steering torque applied by the as-
sistance system via electrical power steering at these
points consequentially manifest in the observed driver
steering torque.
In the illegitimate condition, drivers almost en-
tirely compensated for the applied steering torque, so
that steering right in order to restore the car’s original
heading was unnecessary. In this condition, (D) there-
fore does not mark a change in direction of the steer-
ing torque applied by the assistance system, but in-
stead the end of the automatic steering event, thereby
replacing the effect observed at (E) in the legitimate
condition.
The change in driver steering torque discovered
in both conditions at (B) can also be dismissed as a
system-induced effect, as it coincides with a prepro-
grammed readjustment of the steering torque applied
by the assistance system performed at a fixed time of
0.1s after the onset of the automatic steering interven-
VEHITS2015-InternationalConferenceonVehicleTechnologyandIntelligentTransportSystems
36
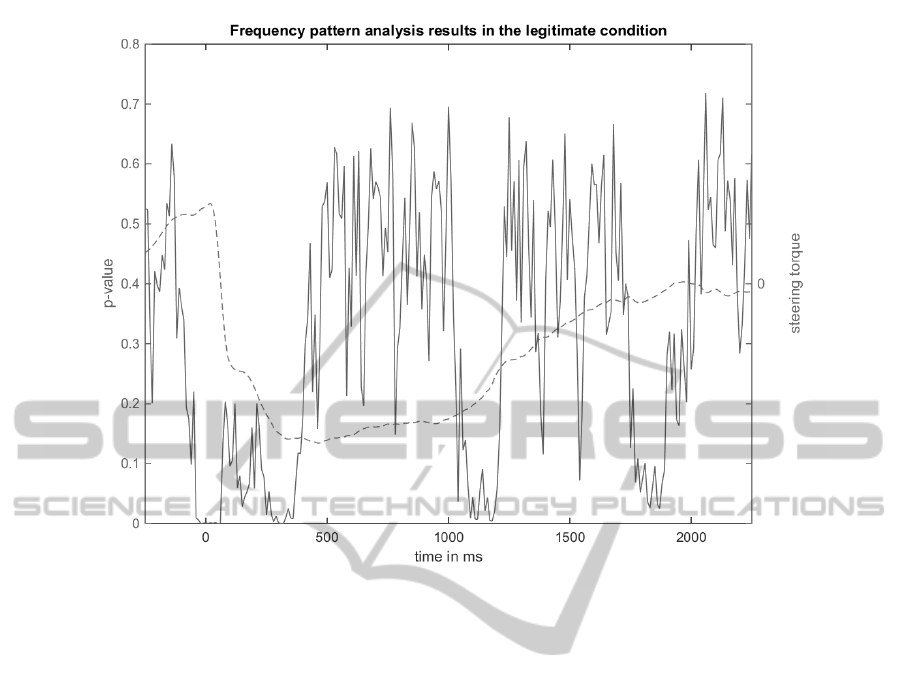
Figure 7: Mean steering torque (dashed line) and frequency-pattern analysis results (solid line) in the legitimate condition.
tion, where the previously applied torque was eval-
uated in regard to the fraction of the target steering
angle it had been able to attain, and was subsequently
adjusted.
The change in driver steering torque at (C), how-
ever, does not coincide with an obvious change in the
steering torque applied by the assistance system. The
significant change of driver steering torque frequency
at this point is therefore a possible candidate for the
point in time where the initially unreflected reaction
of the drivers becomes a reflected one.
4.2 Discussion
The presented method has reliably identified various
points in time throughout the automatic steering inter-
vention, where driver behavior changed significantly.
It has succeeded in pointing out all of the explicit
changes in driver steering torque induced by changes
in the steering torque applied by the assistance sys-
tem, as well as in identifying a change in driver steer-
ing torque frequency that is not accompanied by a
significant change in the magnitude driver steering
torque itself.
The change in driver steering torque frequency
identified in this experiment’s data at approximately
360ms after the onset of an automatic steering in-
tervention does not coincide directly with system-
induced changes in steering torque and can therefore
not be dismissed as a mere artefact. It is considered
by the authors as an indication of a possible change in
driver behavior from an initially unreflected to a re-
flected action, though no explicit change in driver re-
action is observed in regard to working with or against
the steering intervention.
Reviewing literature on drivers’ reaction times to
road stimuli (Triggs and Harris, 1982), 360ms appears
a short time span for a driver’s reaction to take place.
Considering, however, that drivers only had to per-
ceive the situation and decide how to react while the
physical reaction itself, i.e. holding the steering wheel
in place, was already being acted out, the time span
appears reasonable. Other researchers reported recog-
nition reaction times to be of this size, e.g. (Laming,
1968). Neuroimaging methods during an experiment,
where test subjects were instructed to decide whether
a presented number was greater or smaller than five -
a simple decision task perhaps comparable to decid-
ing whether to steer more intensely or not - found that
the motor regions of the cortex were activated to carry
out the test subject’s decision approximately 330ms
after the onset of the stimulus, a time span that is well
LocalizingChangesinDriverBehaviorviaFrequency-pattern-analysis
37
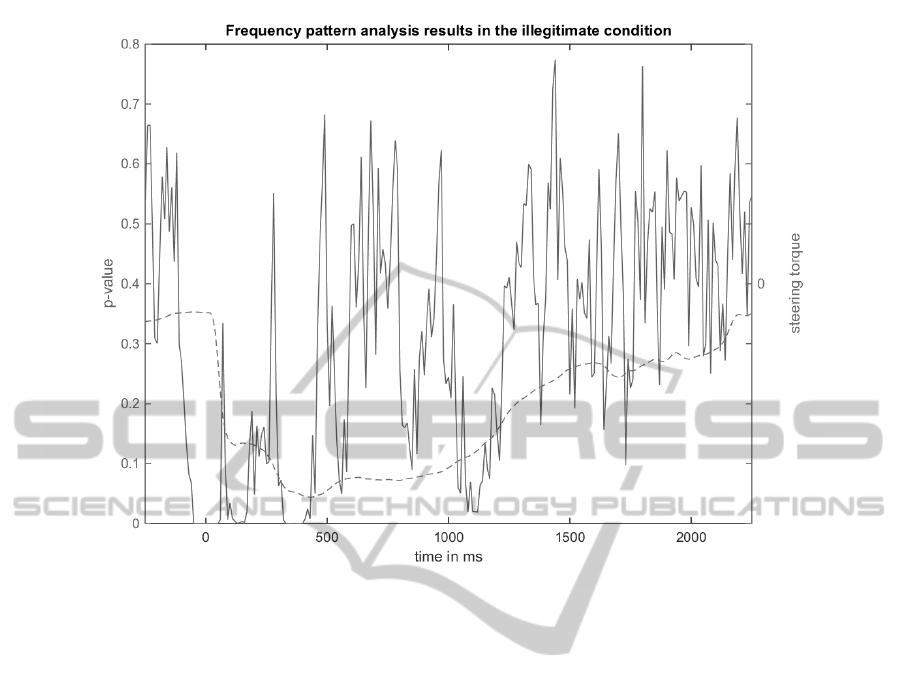
Figure 8: Mean steering torque (dashed line) and frequency-pattern analysis results (solid line) in the illegitimate condition.
compatible with the time span observed in the data
reported here.
In a driving experiment very similar to the one re-
ported in this paper but using a target trajectory with
far less transverse offset for the automatic steering in-
tervention, a recline in driver steering torque opposing
the torque applied by the steering automaton was ob-
served at approximately 500ms after the onset of the
steering intervention, giving further support to the hy-
pothesis that the drivers’ decision on how to react in
this scenario is being made approximately at 360ms
after onset of the steering intervention, since 140ms
appear to be a reasonable time span for the physical
part of the reaction to be carried out, see e.g. (Houli-
han et al., 1994).
Though not yet throughly researched, the method
proposed in this paper provides a quick and conve-
nient way to perform an explorative analysis of driver
behavior. Beyond that, it also provides some evidence
that implicit changes in driver behavior may reflect
in changes of the frequency pattern of driver steer-
ing torque, which the proposed method is also able
to detect. The subject should be systematically re-
searched to collect further evidence for or against this
hypothesis. If the hypothesis proves correct, the anal-
ysis method proposed by the authors for driver be-
havior data should prove an even more useful tool
to quickly identify changes in driver behavior, even
those of implicit nature where the driver reaction does
not explicitly change, potentially granting unprece-
dented insight to experimentally observed driver be-
havior.
REFERENCES
Bortz, J. (1977). Lehrbuch der Statistik fuer Sozialwis-
senschaftler. Springer-Verlag, Berlin Heidelberg, 1st
edition.
Goebbels, S. and Ritter, S. (2011). Mathematik verstehen
und anwenden - von den Grundlagen bis zu Fourier-
Reihen und Laplace-Transformation. Springer Spek-
trum, Heidelberg, 1st edition.
Houlihan, M., Campbell, K., and Stelmack, R. M. (1994).
Reaction time and movement time as measures of
stimulus evaluation and response processes. Intelli-
gence, 18:289–307.
Laming, D. R. J. (1968). Information theory of choice-
reaction times. Academic Press, London.
Mathworks (2015). Fourier Series. The MathWorks, Inc.,
http://de.mathworks.com/help/curvefit/fourier.html.
Triggs, T. J. and Harris, W. G. (1982). Reaction time of
drivers to road stimuli. Human Factors Report, HFR-
12:14f.
VEHITS2015-InternationalConferenceonVehicleTechnologyandIntelligentTransportSystems
38
