
Coastal Risk Forecast System
Andr
´
e Sabino
1
, Armanda Rodrigues
1
, Pedro Poseiro
2
, Maria Teresa Reis
2
, Conceic¸
˜
ao J. Fortes
2
and Rui Reis
2
1
Nova LINCS, Departamento de Inform
´
atica, Faculdade de Ci
ˆ
encias e Tecnologia,
Universidade Nova de Lisboa, Caparica, 2829–516, Portugal
2
Hydraulics and Environment Department (DHA), National Laboratory for Civil Engineering (LNEC),
Av. do Brasil, 101, Lisbon, 1700-066, Portugal
amgs@campus.fct.unl.pt, a.rodrigues@fct.unl.pt, {pposeiro, treis, jfortes, rreis}@lnec.pt
Keywords:
Risk Management, Early Warning, Consequence and Risk Maps, Geographic Information Systems.
Abstract:
Runnup and overtopping are the two main sea wave originated events that threat coastal structures. These
events may cause destruction of property and the environment, and endanger people. To build early warning
forecast systems, we must take into account the consequence and risk characterization of the events in the
affected area, and understand how these two types of spatial information integrate with sensor data sources
and the risk determination methodology. In this paper we present the description and relationship between
consequence and risk maps, their role on the risk calculation, and how the HIDRALERTA project integrates
both aspects into its risk methodology. We present a case study for Praia da Vit
´
oria port, in Azores Portugal.
1 INTRODUCTION
In coastal zones and ports, the evaluation of wave run-
up and overtopping of maritime structures is very im-
portant to assess the risk related with both the fail-
ure of those structures or the flooding of the protected
regions. In Portugal, due to its coastline length, the
concentration of population and economic activities
close to the sea, its severe sea-wave climate, and the
relevance of ports for the national economy, the study
of wave run-up and overtopping is particularly impor-
tant.
In fact, emergency situations caused by sea-waves
hitting the coast are common, usually endangering
the safety of people and goods, with serious conse-
quences for the economy and society. Recent exam-
ples of such events in Portugal are:
Esmoriz. Flooding due to overtopping of the seawall
in February 2011, with damages in the infrastruc-
ture and homes along the seafront;
Estoril. Frequent overtopping of the seawall, which
affects its use and disrupts the nearby railway line;
Praia da Vit
´
oria Port, Azores. Strong overtopping
of the breakwaters completely destroyed the struc-
tures after a December 2001 storm;
Marina do Lugar de Baixo, Madeira. Repeated
events of massive overtopping of the breakwater
in 2006, damaging the structure quite seriously
and leading to the marina inoperability.
Therefore, it is deemed of paramount importance
to implement an early warning system able to forecast
the occurrence of emergency situations, enabling the
adoption of measures to prevent live loss by the na-
tional or local authorities, and reduce economic and
environmental damages.
This is the context of the HIDRALERTA project,
whose goals are to design and implement the early
warning system for the Portuguese coastal areas,
mainly focused on the forecast of wave run-up and
overtopping events. To further understand and predict
run-up and overtopping events, the project also aims
to propose and validate a methodology for long-term
planning and forecast. The methodology is being in-
stantiated with a case study, and is already using real
data.
As a long-term planning tool, the system uses
datasets of several years of sea-wave characteristics
and/or pre-defined scenarios, and evaluates the sea-
wave risks for the protected areas, allowing the con-
struction of Geographic Information Systems (GIS)
based risk maps. These maps aim to support the re-
sponsible entities’ decision-making process regarding
long-term management.
As a forecast and early warning tool, the system
uses numerical forecasts of sea-wave characteristics
201
Sabino A., Rodrigues A., Poseiro P., Reis M., J. Fortes C. and Reis R..
Coastal Risk Forecast System.
DOI: 10.5220/0005469902010209
In Proceedings of the 1st International Conference on Geographical Information Systems Theory, Applications and Management (GISTAM-2015), pages
201-209
ISBN: 978-989-758-099-4
Copyright
c
2015 SCITEPRESS (Science and Technology Publications, Lda.)
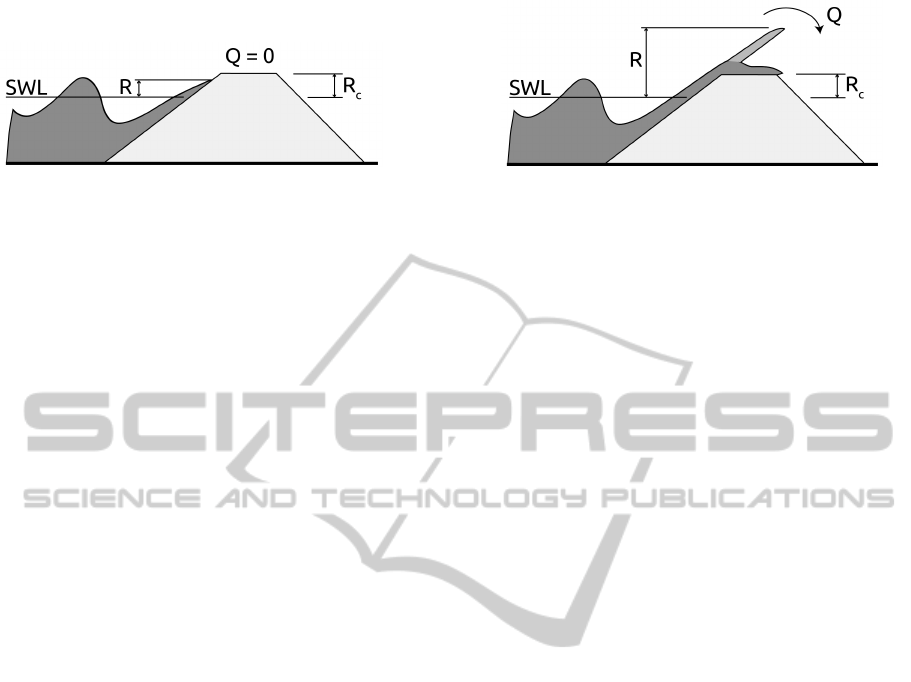
(a) Wave runup (b) Wave runup and overtopping
Figure 1: Representation of wave runup, R, and overtopping (mean discharge, Q) events on a structure with freeboard R
c
(still
water level, SWL).
that enable the identification, in advance, of the oc-
currence of emergency situations, prompting the re-
sponsible entities to adopt measures to avoid loss of
lives and minimize damage.
Furthermore, this methodology enables tools
that contribute to the fulfillment of the directive
2007/60/EC of the European Parliament, and of the
European Council of October 23, 2007, which has
recommended the development of risk maps by 2013,
and flood risk management plans, including the estab-
lishment of systems of forecasting and early warning,
by 2015.
The early warning system module is already run-
ning on a daily basis for Praia da Vit
´
oria Port, in Ter-
ceira Island, Azores, Portugal. Currently, it is being
deployed on S. Jo
˜
ao da Caparica beach, in Costa da
Caparica, Portugal.
Several aspects of the methodology followed by
the HIDRALERTA have been presented in previ-
ous work (Sabino et al., 2014). This work presents
the latest developments of the project regarding risk
and consequence maps production, and its integration
with the alert dissemination component of the system.
The remaining of this paper is organized as the fol-
lowing:seciton 2 presents the HIDRALERTA project
background and related work; section 3 presents the
risk assessment methodology, including the defini-
tion of the consequence table and map (section 3.1);
section 4 describes the warning system; section 5
presents the case study area, where the system is cur-
rently running; section 6 draws some conclusions.
2 BACKGROUND AND RELATED
WORK
Our goal is to build warning systems for two types of
events on coastal areas: wave run-up; and wave over-
topping. Wave run-up occurs when a wave climbs a
beach or structure slope. Overtopping occurs when
a volume of water passes over the crest of a struc-
ture due to wave action, which may be caused by
waves running up the structure slope, exceeding the
structure freeboard, and passing a continuous sheet of
water over the crest. Overtopping may also happen
when a wave hits a vertical structure, sending a ver-
tical plume of water over the crest, or when a wave
breaks on the seaward face of the structure and pro-
duces splash. The diagrams in figure 1 show the con-
ditions for run-up (figure 1(a)), and for run-up and
overtopping (figure 1(b)) events.
In countries like Portugal, with a long coastline,
it is extremely relevant to study wave induced risks,
especially wave overtopping, given the importance
of the socioeconomic activities in port/coastal areas
and the severity of the sea conditions. In this con-
text, the HIDRALERTA project has been developing
a set of integrated decision-support tools for port and
coastal management, whose focus is to prevent and
support the management of emergency situations, and
the long-term planning of interventions in the target
area.
The stakeholders involved in this type of system
are structure owners, civil protection authorities, and
all other users of the target areas. The warning that is
delivered to each type of user differs in the amount of
information that characterizes the event. The project
is developing a set of warning icons that can be asso-
ciated with risk levels, which inform the responsible
entities about the specific consequences to their inter-
est area.
The HIDRALERTA project in motivated by pre-
vious work, such as the GUIOMAR project (Neves
et al., 2009), which developed a GIS integrated sys-
tem used for numerical modeling of wave propagation
in coastal and port engineering studies.
Unlike countries such as the United Kingdom and
the Netherlands, Portugal does not yet have a national
flood forecast and warning system. In fact, the coun-
try actually lacks local systems.
Previous work on a system focused on the fore-
cast of tidal floods at the North East Region of Eng-
land (Lane et al., 2008) also provides context to the
HIDRALERTA project.
GISTAM2015-1stInternationalConferenceonGeographicalInformationSystemsTheory,ApplicationsandManagement
202

The most widely used tools for predicting wave
run-up and overtopping, and the corresponding flood-
ing on beaches, coastal, and port structures are empir-
ical and semi-empirical formulas based on physical
model tests or field studies, such as the semi-empirical
model of Hedges & Reis (Hedges and Reis, 1998), as
presented in (Raposeiro et al., 2009).
However, the direct application of all these for-
mulae is limited to specific wave or water level con-
ditions and simple structural or beach configurations.
Physical models remain the most reliable method for
determining runup and overtopping, being used for
prototype studies, as well as to provide data for the
development, calibration and validation of other pre-
diction methods.
Due to the continuous increase in computer
performance, numerical models have been devel-
oped further, and are becoming increasingly attrac-
tive (Reis et al., 2011). They are more flexible than
empirical formulas and physical models, but their use
in practical engineering applications still has limita-
tions (Neves et al., 2008).
Given the complexity of these prediction mod-
els, machine learning methods are also suitable for
the task. Several artificial neural networks have been
developed lately, including by team members (Mase
et al., 2007) and by the CLASH project team (Co-
eveld et al., 2005).
Previous work on Project Life-Saver has been also
essential for this work. That project dealt with the
evaluation of current emergency measures in the con-
text of the Alqueva dam break (Sabino and Rodrigues,
2009; Sabino et al., 2008; N
´
obrega et al., 2008). In
this context, an emergency scenario simulator was de-
veloped and integrated in a decision support system,
involving several tools to aid risk management ac-
tivities for flood emergency scenarios. These results
have now been taken a step further, with the aim of
automatically providing these tools in different geo-
graphic areas and by abstracting the work developed
with the creation of generic platform to aid the evalu-
ation of different risk situations in an emergency man-
agement context.
3 RISK EVALUATION
Every target area of the system is divided into
stretches. Each stretch represents an area in space
where the risk will be constant. In our case study,
the target area is a port in Azores, which is divided
into several stretches, representing port structures and
segments of the seawall. Our methodology will deter-
mine, for a particular event, the risk levels associated
with each stretch.
The consequence and risk associated with emer-
gency events are the two most relevant concepts of
the HIDRALERTA project methodology.
Consequence refers to the effects emergency
events may have on the area, which are relevant to
the emergency response and preparedness. Specifi-
cally, these effect refer to threats to human lives, prop-
erty and the environment. Understanding the potential
consequences of an emergency event is key to enable
risk assessment.
Risk relates the consequences of an event with the
probability of it ever occurring, with the actual value
being computed by the expression
risk = event probability × consequences, (1)
which balances the study of past event (mainly ex-
treme events) with the assessment of the characteris-
tics of the study area.
Equation 1 computes values in a particular scale,
meaningful to the emergency management stakehold-
ers. In our case study, the risk value is a level on an
ordinal scale, between 0 and 4, with 0 indicating no
risk, and 4 the maximum risk. Eventually, each risk
level will be associated with a set of emergency re-
sponse actions for each stretch.
To compute a value in the risk ordinal scale, we
define values associated with several consequence
levels, as presented in Table 1. With these conse-
quence levels we are able to build consequence maps
for events.
We are also able to build risk maps, representing
the spatial distribution of risk levels, which are suit-
able for warning.
3.1 Consequence Map
Table 1 describes the consequences level associ-
ated with different emergency scenarios. The table
was developed in close collaboration with the Praia
da Vit
´
oria Port Authority, and considers the conse-
quences of dangerous events, and the expected im-
pact for human lives, the environment, port manage-
ment, and property. The levels in this table reflect
the importance of dangerous events for risk level as-
sessment, representing different degrees of response
requirements and prioritization. For example, it is
important to distinguish between an event with high
probability of occurrence but with low consequences
from an event with a low probability of occurrence but
with very high consequences, which is typically more
critical to manage. Figure 2 presents an example of a
consequence map for the Praia da Vit
´
oria Port.
CoastalRiskForecastSystem
203
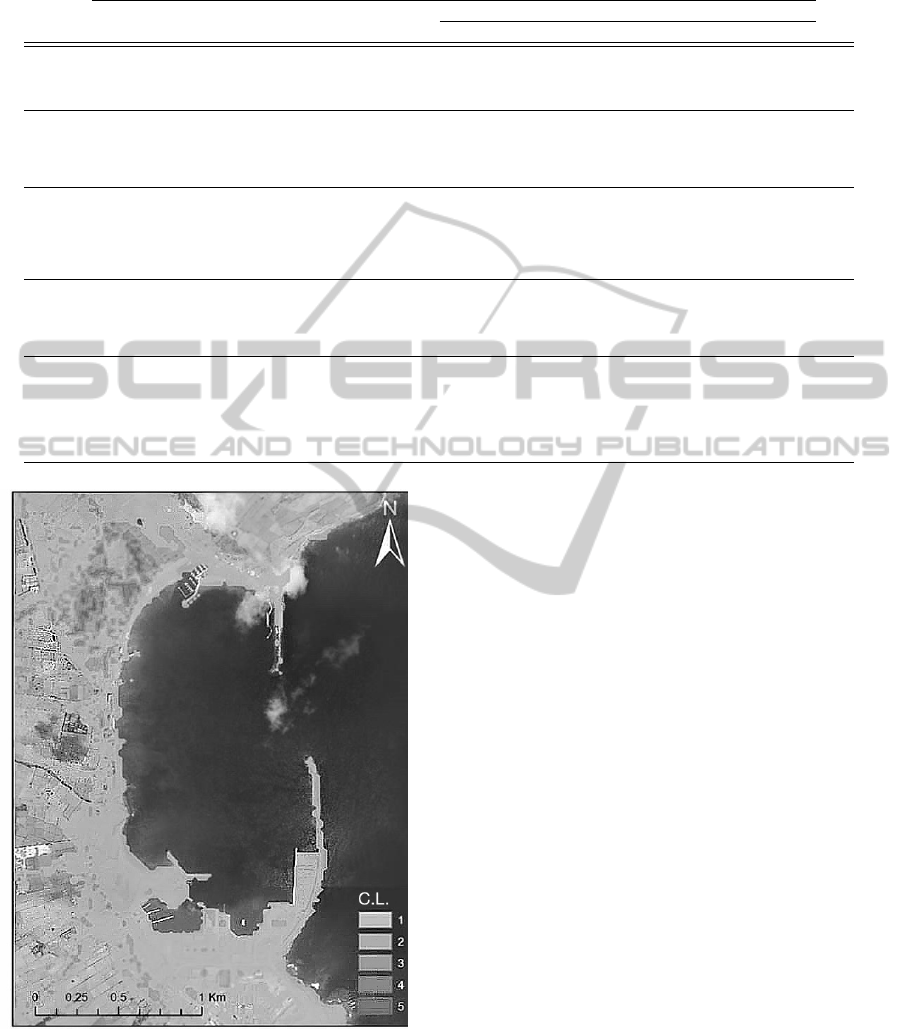
Table 1: Descriptions of the several consequence levels.
Consequences (Guidelines)
Property
Description People Environment Port Management Buildings Equipment Maritime Structure Level
Insignificant Almost no
injuries (bruises
at most).
Almost no
environmental impact.
Small changes to port
activities.
Almost no exterior
damage.
Almost no damage. Damage in the active
area of the structure
requiring no
intervention.
1
Marginal Single slight
injury.
Small cargo spills (e.g.,
oil).
Some changes to port
activities; bad local
publicity for the port.
Minor exterior and
interior damage.
Minor damage
requiring no stopping;
almost immediate
problem resolution.
Occurrence of block
movements and falls
without filter exposure;
immediate intervention
not required.
2
Relevant Multiple slight
injuries or single
major injury.
Some areas are
restricted due to
pollution caused by
cargo spills.
Restrictions on loading
and unloading; possible
partial shutdown; bad
widespread publicity.
Moderate interior
damage.
Damage requiring
temporary equipment
downtime for repair.
Occurrence of block
movement and falls
without filter exposure;
superstructure affected
but with no significant
movements.
5
Serious Multiple major
injuries or single
fatality.
Pollution episodes in
and out of port zone
with potential
irrecoverable losses to
the environment.
Loading and unloading
are impossible for
several days; bad
national publicity.
Major interior damage;
building structure
affected.
Major damage;
prolonged equipment
downtime.
Filter layer affected;
substantial movements
of the superstructure.
10
Catastrophic Multiple
fatalities.
Widespread cargo
spills; serious
contamination;
irrecoverable losses to
the environment;
international aid
needed.
Very serious
constraints to loading
and unloading over a
long period; very
serious and long term
loss of trade; bad
international publicity.
Very serious interior
damage; building
structure seriously
damaged; imminent
danger of collapse.
Equipment loss (no
recovery possibility).
Collapse of the
structure.
25
Figure 2: Praia da Vit
´
oria port consequence map, enabled
by the AHP methodology. Consequence levels (C.L.) are
represented by a color scale.
The consequences of run-up, overtopping, and
flooding have been estimated using a methodology
for a simple qualitative evaluation of the consequence
level associated with hazardous events in the tar-
get area (Raposeiro et al., 2009). However, in that
methodology there is no prioritization or allocation of
weights to the different environmental, economic, and
social aspects relevant to the target area, specifically
for the occurrence of hazardous events that exceed
pre-set thresholds. To complement the qualitative
method for the determination of consequence levels,
Poseiro, et al. (Poseiro et al., 2013), applied a method-
ology based on a multi-criteria analysis, which en-
ables spatial analysis, classification, and assignment
of weights to each aspect that characterizes the target
area (Craveiro et al., 2012). This methodology for the
establishment of the consequences map consists on
the construction of a spatial index of human pressure
on the port and coastal area through the application of
the Analytic Hierarchy Process (AHP).
Recent developments include the application of
AHP method in the port and bay of Praia da Vit
´
oria,
Azores, and the application of Coastal Vulnerability
Index and Hazard Assessment to obtain the Coastal
Risk in sandy beaches with and without coastal de-
fence structures in Costa da Caparica, near Lisbon, by
using a geo-referenced database and the multi-criteria
analysis.
3.2 Risk Map
The following five-step methodology relies on the
concept of risk level to enable a qualitative assessment
of wave overtopping risk:
GISTAM2015-1stInternationalConferenceonGeographicalInformationSystemsTheory,ApplicationsandManagement
204
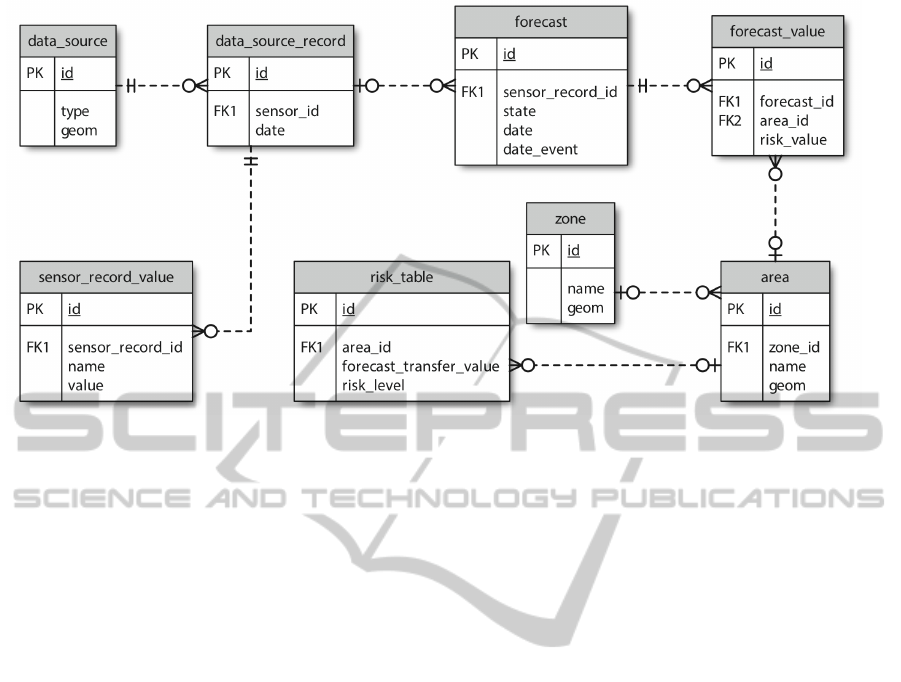
Figure 3: Data model of the risk database. It manages data from data sources and forecast components.
1. Defining acceptable thresholds for the overtop-
ping values, guided by Pullen, et al. (Pullen et al.,
2007a), and according to structures characteristics
and utilization;
2. Defining, with table 1, the probability level for the
different thresholds;
3. Selecting the consequences level for each thresh-
old in table 1;
4. Computing the risk level associated with the dif-
ferent preset thresholds;
5. Building risk level maps and analyzing risk levels
acceptability.
With the evaluation of the mean overtopping dis-
charges, the next step is the threshold definition of the
overtopping discharge for each segment, according to
the nature of the activities carried out in the area shel-
tered by it, and the overtopping impact on the safety
of the structure itself, people, and infrastructure.
The set of thresholds is defined by the limits of the
mean overtopping discharge per linear meter of the
structure, as described by Pullen, et al. (Pullen et al.,
2007b). We count the number of times those thresh-
olds are exceeded in the relevant structures, estimate
the associated probability of exceeding such thresh-
olds, and determine the probability level, based on
table 1. For each structure, the consequences level
associated to the occurrence of mean overtopping dis-
charges that exceed the same thresholds is established
using table 1. Finally, the risk level is obtained by the
product between probability levels and consequences
levels.
4 WARNING SYSTEM
The warning system integrates the information gener-
ated by all the other components of the project. It is
designed to assess and disseminate warnings of sea-
wave runnup and overtopping events. It also deals
with the different data sources that may be available
to a particular scenario.
Specifically, the component deals with the follow-
ing tasks:
• Data acquisition from the data sources;
• Trigger the wave overtopping determination com-
ponent;
• Store risk assessment results;
• Disseminate current warning conditions through
the following channels: Website, Twitter account,
and Email;
• Maintain the zone characterization, using a map
with the overtopping consequence layer and threat
areas;
• Visualization tools for time series geo-referenced
data sources and forecast data.
The system is managed through a web interface. It
manages two types of data: from the data sources and
interpolations, and the warning data. The data model
in section 4.1 presents the data organization for data
sources and interpolation. The warning data follows
a straightforward CRUD design approach.
CoastalRiskForecastSystem
205
4.1 Architecture
As mentioned previously, there are several data
sources available. However, the relevant parameters
collected from those sources remain the same: the sig-
nificant wave height, the spectral peak period and the
angle of wave attack.
The general architecture of the warning system is
shown in figure 4.
Figure 4: Warning system architecture.
Data collected from data sources are managed to-
gether with forecast data. Figure 3 illustrates the
warning system data model that integrates informa-
tion from data sources and the forecasting compo-
nents.
The terms used in the data model are defined as
the following:
Data Source. Any source that provides records with
the three sea-wave parameters: significant wave
height (meters), spectral peak period (seconds)
and angle of wave attack (degrees).
Zone. The study area.
Area. A particular threat area inside the Zone that
will be tested for potential overtopping events. Al-
though there is an arbitrary number of areas inside
a zone, these are subjected to what is possible to
represent on the risk map.
Forecast. The value of potential overtopping dis-
charges (l/s/m), or wave runup for the set of threat
areas, with one forecast value for each area.
Risk Area. The threshold table that relates a forecast
value with a risk level, for each area. Different
areas are subject to different thresholds.
Depending on the zone characteristics, the data
source may be a single point location, like a single
wave sensor buoy, or a collection of points, like a
subset of the WAVEWATCH III grid. The forecast
value also varies between a mean overtopping dis-
charge value (NN OVERTOPPING2) and wave run-
up information (which is exclusive to the empirical
formulas approach).
The warning events’ data is managed sepa-
rately by the web application framework, referencing
records on the risk database.
From the model in figure 3, each Forecast requires
a specific Data Source Record. This record may refer
to any type of sensor that outputs the parameters re-
quired by the feature model.
5 CASE STUDY: PORTO DA
PRAIA DA VIT
´
ORIA AC¸ ORES
The port of Praia da Vit
´
oria, is located on the Praia da
Vit
´
oria bay, at Terceira Island, the second largest of
the Azores archipelago. Praia da Vit
´
oria bay is bor-
dered to the north by Ponta da M
´
a Merenda and to
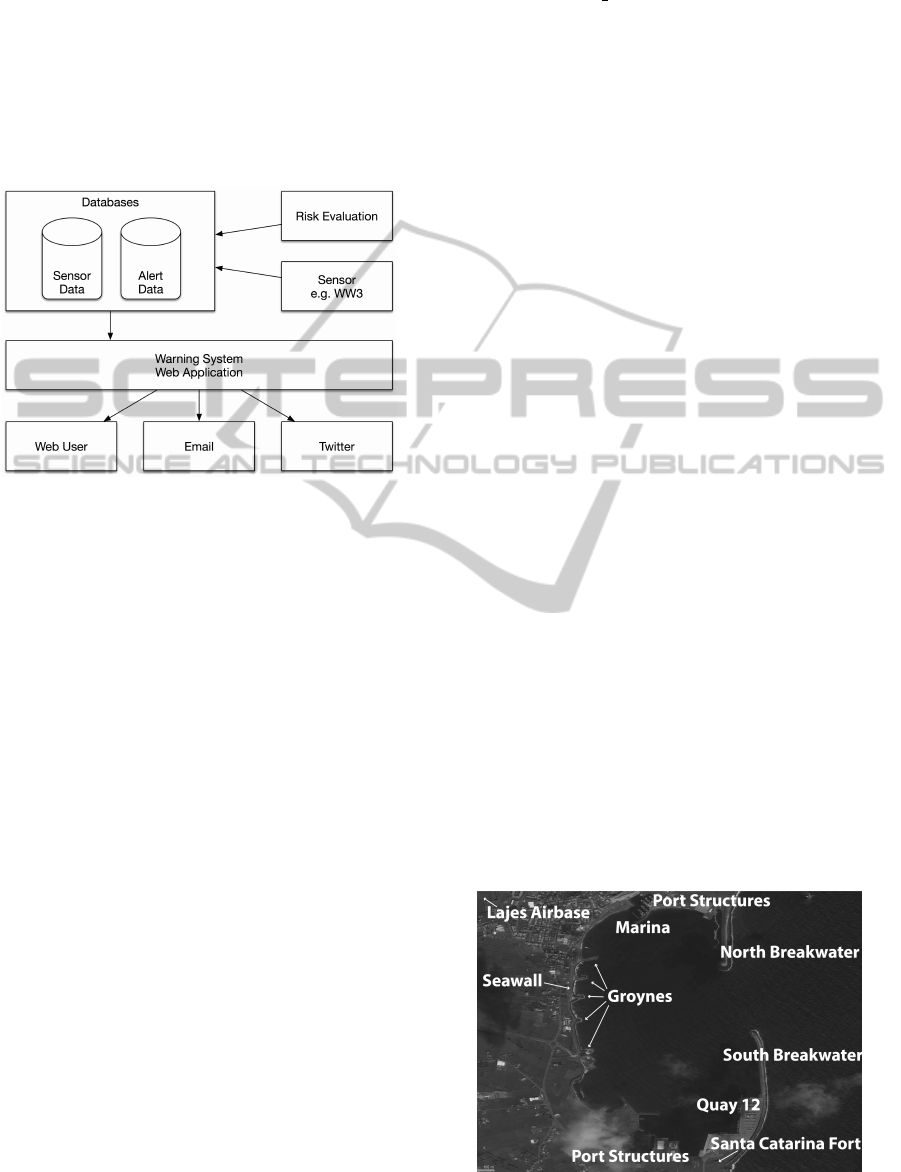
the south by Ponta do Baixio. Figure 5 provides an
overview of the area.
In the early sixties, the north breakwater was built
to protect the port facilities that support the Lajes air-
base. It is a rubble-mound breakwater, 560 m long,
with a north-south alignment, rooted in the Ponta do
Esp
´
ırito Santo. Later, in the eighties, the second
breakwater (south breakwater) was built, rooted on
the south side of the bay, near the Santa Catarina fort.
The breakwater is approximately 1300 m long, with
a straight alignment (north-south) that bends close to
its shore connection. It protects the facilities (com-
mercial sector and fishing port) of the Praia da Vit
´
oria
port.
Taking advantage of the shelter provided by these
breakwaters a marina was built in the late nineties by
the Municipality of Praia da Vit
´
oria at the location of
the former fishing harbour. The port basin is approxi-
mately 1 km by 2 km.
Figure 5: Main structures and areas of the Praia da Vit
´
oria
port, Azores, Portugal.
GISTAM2015-1stInternationalConferenceonGeographicalInformationSystemsTheory,ApplicationsandManagement
206
The bay shoreline has a 1 km long coastal de-
fence. There is a field of five groynes in front of the
port entrance, rooted to the coastal defense. Although
these groynes do not have the same length, they have
approximately the same alignment (WSW-ENE), and
are referred to herein as groynes 1 to 5, from south
to north. At the root of groyne 3 there is a build-
ing, in which operates a bar. Between some of the
groynes there are narrow beaches whose sand volume
decreases as one moves south. The longest beach is
located between groyne 5 and the marina jetty.
Presently, there are several sea-wave measuring
devices that can characterize the sea wave regime
within the port. In fact, within the scope of the CLI-
MAAT project (Esteves et al., 2009), a directional
wave-buoy was deployed 4 km northeast from the
port, in a region about 100 m deep, whose data were
used to validate the methodology for wave propaga-
tion applied in this study.
The warning system is running permanently for
Praia da Vit
´
oria. The sea-wave characterization mod-
ule runs every day to predict 180 hours of wave char-
acteristics at the port entrance and into the port, to-
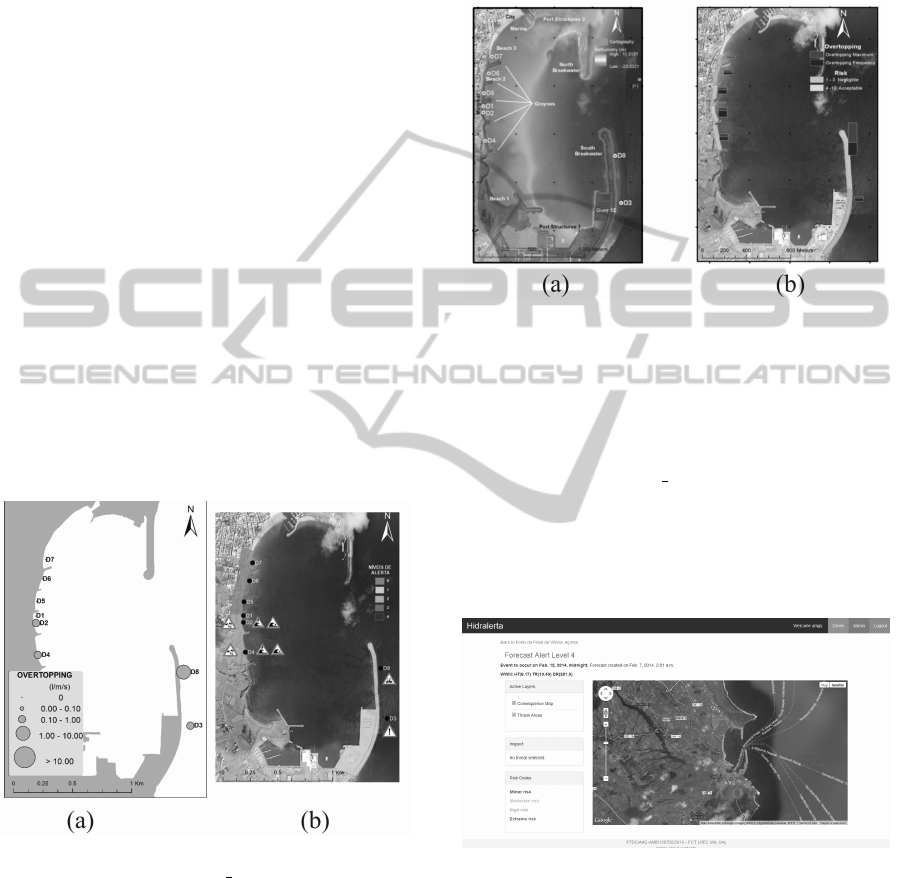
gether with wind field and tide level predictions. Ev-
ery 3 hours, the system creates a layout with signif-
icant wave height and angle of wave attack, as pre-
sented in figure 6.
Figure 6: Examples of layouts created by the
HIDRALERTA system for NN OVERTOPPING2 results
at October 16, 2010, 12:00. a) shows mean overtopping
discharges at particular locations. b) shows the risk map
presented to stakeholders, including warning information.
The risk assessment of Praia da Vit
´
oria permits the
construction of risks maps in this area. In the quali-
tative risk evaluation, we considered a five-year pe-
riod with sea-wave data from 2008 to 2012, as well
as the effects of local wind and the astronomical tide
level. The methodology was applied to eight struc-
tures along the port and bay of Praia da Vit
´
oria, from
D1 to D8 (see figure 7 a)). Example of a risk map
is presented in figure 7 b), which shows the regions
where mitigation measures are to be implemented.
The AHP methodology was employed to generate the
consequences map (see figure 2).
Figure 7: Examples of layouts created by the AHP method-
ology. a) shows the target area. b) shows the risk map.
Once the wave characteristics in the port are avail-
able, every 3 hours, the second module, which pre-
dicts the run-up/overtopping associated to those wave
characteristics, is applied. For each set of wave/water
level characteristics, NN OVERTOPPING2 provides
information on mean wave overtopping discharge for
each of the studied cross-sections of the structures. If
the mean overtopping discharge exceeds the pre-set
threshold, a warning is issued. The WebGIS is pre-
sented at figure 8.
Figure 8: Example screen of the WebGIS component, with
an example of a forecast alert. The system enables a color
code representation of risk levels. Each stretch is repre-
sented by a polygon with the same color code of its risk
level.
6 CONCLUSIONS
This paper presents the recent developments of the
HIDRALERTA system, a novel system currently be-
ing implemented as an early warning application and
CoastalRiskForecastSystem
207

also to assess the risk of flooding in coastal and port
regions. The system, implemented in a WebGIS envi-
ronment, follows the basic idea of using wave fore-
casts (up to 180 hours) to calculate the effects of
waves on the coast, particularly in terms of wave over-
topping and flooding. Once wave overtopping and
flooding are evaluated, they are compared with pre-
defined thresholds, to build warning maps and risk
maps, and, if necessary, to issue warning messages.
Here we have described the application of the sys-
tem to the Praia da Vitoria bay, in Terceira Island,
Azores. It shows that HIDRALERTA system has the
potential to become a useful tool for the management
of coastal and port areas, due to its fast and efficient
capacity to effectively issue warning and to evaluate
risks. In the framework of the HIDRALERTA project,
the system has also been applied to low-line areas,
namely sandy beaches and dunes systems under pres-
sure and higher vulnerable to climate changes impacts
such as Costa da Caparica, either as a warning sys-
tem or as a risk evaluation tool, but it can be easily
extended to other locations. In fact, it has been ap-
plied to other Portuguese locations, such as the ports
of Ponta Delgada (Azores) and Sines, and the Praia
da Gal
´
e coastal area.
At this point, the project is developing:
• The replacement of the DREAMS linear wave
model by the BOUSS-WMH nonlinear wave
model;
• Carry out overtopping tests on physical models
for other types of structures, being the data pro-
duced within these tests used in evaluating the per-
formance of empirical, neuronal network or nu-
merical tools;
• Improve the methodology for constructing maps
of consequences;
• Create maps to enable illustration of the spa-
tial distribution of successive volume thresholds,
which will be complemented maps of conse-
quences, and consequently maps of risk of over-
topping/flooding;
• Set suitable levels (thresholds) to issue a warning.
ACKNOWLEDGEMENTS
This work is supported by Fundac¸
˜
ao para a Ci
ˆ
encia
e Tecnologia, Minist
´
erio da Educac¸
˜
ao e Ci
ˆ
encia, Por-
tugal, through grant PTDC/AAC-AMB/120702/2010.
The authors are grateful for the information on Praia
da Vi
´
oria (port and bay) provided by Portos dos
Ac¸ores, S.A., Anabela Sim
˜
oes and Eduardo Azevedo
from Universidade dos Ac¸ores, and Conceic¸
˜
ao Ro-
drigues from Azorina - Sociedade de Gest
˜
ao e
Conservac¸
˜
ao da Natureza, S.A.
REFERENCES
Coeveld, E. M., Van Gent, M. R. A., and Pozueta, B.
(2005). Neural network manual for NN Overtopping
program. Technical report, TU Delft.
Craveiro, J., Antunes, O., Freire, P., Oliveira, F., Almeida,
I., and Sancho, F. (2012). Comunidades urbanas na
orla costeira: a metodologia multicrit
´
erio AHP (An-
alytic Hierarchy Process) para a construc¸
˜
ao de um
´
ındice de vulnerabilidade social face
`
a ac¸
˜
ao mar
´
ıtima.
In Atas do 2 Cong. Ibero Americano de Responsabili-
dade Social.
Esteves, R., Valente, A., Costa, M., Reis, F., and Azevedo,
E. (2009). Dados Direccionais de Agitac¸
˜
ao Mar
´
ıtima
nos Ac¸ores (Projecto CLIMAAT-Clima e Meteorolo-
gia dos Arquipelagos Atl
ˆ
anticos). In 6as Jornadas
Portuguesas de Engenharia Costeira e Portu
´
aria.
Hedges, T. S. and Reis, M. T. (1998). Random wave over-
topping of simple seawalls: A new regression model.
Water, Maritime & Energy Journal, 130(1):1–10.
Lane, A., Hu, K., Hedges, T., and Reis, M. (2008). New
north east of England tidal flood forecasting system.
In FLOODrisk 2008, Flood Risk Management: Re-
search and Practice, pages 1377–1387, Oxford, UK.
Mase, H., Reis, M., Nagahashi, S., Saitoh, T., and Hedges,
T. (2007). Effects of zero overtopping data in artifi-
cial neural network predictions. In Proceedings of the
Coastal Structures’07, pages 2–4, Venice, Italy.
Neves, D. D. R., Z
´
ozimo, A. C. A., Fortes, C. a. J. C.,
and Pinheiro, L. (2009). GUIOMAR: Geo(graphical)
User Interface for cOastal and MARine Modeling.
Wave regime at Sines. Journal of Coastal Research,
SI(56):1209–1213.
Neves, M. G., Reis, M. T., Losada, I., and Hu, K.
(2008). Wave overtopping of P
´
ovoa de Varzim break-
water: Physical and numerical simulations. Journal
of Waterway, Port, Coastal and Ocean Engineering,
134(4):226–236.
N
´
obrega, R., Sabino, A., Rodrigues, A., and Correia, N.
(2008). Flood Emergency Interaction and Visualiza-
tion System. In Proceedings of the 10th International
Conference on Visual Information Systems.
Poseiro, P., Fortes, C., Reis, M., Simoes, A., Rodrigues, A.,
and Azevedo, E. (2013). A methodology for Overtop-
ping Risk Assessment in Port Areas: Application to
the Port of Praia da Vit
´
oria (Azores, Portugal). In 6th
SCACR International Short Course / Conference on
Applied Coastal Research.
Pullen, T., Allsop, N., Bruce, T., Kortenhaus, A.,
Sch
¨
uttrumpf, H., and van der Meer, J. (2007a). Wave
Overtopping of Sea Defences and Related Structure-
sAssessment Manual. Technical report.
Pullen, T., Allsop, N. W. H., Bruce, T., Kortenhaus, A.,
Sch
¨
uttrumpf, H., and van der Meer, J. W. (2007b). Eu-
GISTAM2015-1stInternationalConferenceonGeographicalInformationSystemsTheory,ApplicationsandManagement
208

rOtop Wave Overtopping of Sea Defences and Related
Structures: Assessment Manual. Technical report.
Raposeiro, P. D., Reis, M. M. T., Fortes, C. a. J. C., and Fer-
reira, J. C. (2009). Methodology for estimating run-up
and flooding at the costal zone using the GUIOMAR
system: application to Vale do Lobo beach. In Pro-
ceedings of the COASTGIS’09, volume 2.
Reis, M., Neves, M., Lopes, M., Hu, K., and Silva, L.
(2011). Rehabilitation of Sines West Breakwater:
wave overtopping study. Proceedings of the ICE -
Maritime Engineering, 164(MA1):15–32.
Sabino, A., N
´
obrega, R., Rodrigues, A., and Correia, N.
(2008). Life-Saver: Flood Emergency Simulator. In
Proceedings of the 5th International ISCRAM Confer-
ence, number May.
Sabino, A. and Rodrigues, A. (2009). A visual language for
spatially aware agent-based modeling in crisis scenar-
ios. In Proceedings of the 12th AGILE International
Conference on Gepgraphic Information Science.
Sabino, A., Rodrigues, A., Ara
´
ujo, J. a., Poseiro, P., Reis,
M. T., and Fortes, C. a. J. (2014). Wave Overtop-
ping Analysis and Early Warning Forecast System. In
Murgante, B., Misra, S., Rocha, A. M. A. C., Torre,
C., Rocha, J. G., Falc
˜
ao, M. I., Taniar, D., Apduhan,
B. O., and Gervasi, O., editors, Proceedings of the
14th International Conference on Computational Sci-
ence and Its Applications, Guimar
˜
aes, Portugal.
CoastalRiskForecastSystem
209
