
Signal Processing for Underwater Archaeology
Davide Moroni, Maria Antonietta Pascali, Marco Reggiannini and Ovidio Salvetti
SILab, Institute of Information Science and Technololgies - CNR, Via G. Moruzzi 1, 56124, Pisa, Italy
Keywords: Underwater Robotics, Underwater Cultural Heritage, Image-based Modelling and 3D Reconstruction,
Multi-Sensor Data Analysis, Archaeological Object Recognition.
Abstract: About three million wrecks lie scattered on the oceans’ seafloors. This huge patrimony is actually
threatened by criminal enterprises having advanced tools available for localization and rescue operations.
ARROWS, a currently ongoing EU FP7 project, is an example of the effective commitment between
cultural institutions and the scientific community towards the safeguard of the sunken cultural heritage.
ARROWS is devoted to advanced technologies and tools for mapping, diagnosing, cleaning, and securing
underwater and coastal archaeological sites. A fleet of Autonomous Underwater Vehicles (AUVs) will be
manufactured with the purpose of surveying the seabed and sensing the underwater environment by means
of proper payload sensors (digital cameras, side scan and multi-beam sonars). This paper describes a set of
underwater scene understanding procedures specifically tailored to the purposes addressed in the ARROWS
frame. In particular the data collected by the AUVs during the acquisition campaigns will be processed to
detect targets of interest located on the seabed. The main approach adopted in the object detection
procedures is to highlight the amount of regularity in the captured data. This can be pursued by exploiting
computer vision algorithms that perform i) the recognition of geometrical curves ii) the classification of
seafloor areas by means of textural pattern analysis iii) a large scale map generation to return an overall
view of the site and iv) a reliable object recognition process performing the integration of the available multi
modal information. Moreover the collected raw data together with the analysis output results will be stored
to allow for an offline deep analysis of the archaeological findings. This will represent a powerful tool to be
used by expert users or by the general public to enjoy the underwater cultural heritage.
1 INTRODUCTION
The marine environment represents a hostile frame
for any kind of human or scientific activity. The
peculiar setting imposes strict constraints for survey,
mapping and rescue of sunken objects. Given the
huge number of wrecks scattered all over the globe’s
seabed, around three million according to UNESCO
reports (http://www.unesco.org/), joint actions
between cultural institutions and scientific
communities have been fostered by the European
Union in order to commit for the safeguard of the
sunken cultural heritage.
One of the joint venture aiming at the above cited
goals is ARROWS, an EU FP7 project devoted to
the development of low cost technologies for marine
archaeological site detection and preservation
operations. The ARROWS researchers, guided by
the suggestions of a dedicated Archaeological
Advisory Group (AAG), look for solutions to the
mapping, diagnosis and cleaning tasks of underwater
archaeological sites. To those particular aims a team
of new heterogeneous Autonomous Underwater
Vehicles (AUVs) is currently being developed.
Those AUVs are designed to host optical (digital
cameras) and/or acoustic (Sidescan sonar,
Multibeam echo-sounder) payload sensors in order
to endow the system with environment sensing
capabilities. The captured data will be fed to a scene
understanding procedure performing manmade
object detection tasks. To this purpose the adopted
criteria is to highlight the regularity content in the
data. In this framework we consider regular those
areas containing parts of primitive curves, like lines,
circles and ellipses.
Regularity can also be assessed by analysing the
objects surface appearance in terms of the repeating
textural patterns detected in the captured maps.
Based on those features, we can perform attentive
analysis of the environment by giving to an area a
label of interest proportional to the regularity
content: more regular areas are marked with higher
ranks while chaotic and unstructured area will be
marked with low ranks.
80
Moroni D., Pascali M., Reggiannini M. and Salvetti O..
Signal Processing for Underwater Archaeology.
DOI: 10.5220/0005462100800084
In Proceedings of the 5th International Workshop on Image Mining. Theory and Applications (IMTA-5-2015), pages 80-84
ISBN: 978-989-758-094-9
Copyright
c
2015 SCITEPRESS (Science and Technology Publications, Lda.)

In the first part of this paper the main features of the
algorithms implementing the detection and
classification tasks will be described. The remaining
part of the paper describes the major activity
emerging after the project experimental campaigns,
concerning the postprocessing of the collected data
and the generation of two primary results: i) the 3D
models of the detected archaeological objects and ii)
a set of large scale maps containing the result of an
image mosaicking process, providing an overall
view of the surveyed area. These output results are
mainly oriented to directly involved cultural
operators, enabling them to study in detail every
single object without moving it from its
environmental framework, but will be also available
for dissemination and fruition of the underwater
cultural heritage by the general public.
2 AUV SENSING SYSTEM
The main goal of the ARROWS missions is to
perform a systematic mapping of the marine
seafloors and to process the output maps to detect
and classify potential archaeological targets. To that
aim the underwater vehicles outlined in the previous
section will be equipped with a proper set of sensor
devices, e.g. optical cameras and acoustic sonars.
These sensors represent appealing choices to the
oceanographic engineer since they provide
complementary information about the surrounding
environment. Generally speaking acoustic sensors
are exploited to create large scale maps of the
environment while cameras provide more detailed
images of the targets.
The AUV payload equipment will consist of a
couple of digital cameras plus an acoustic device
optionally selected between a sidescan sonar or a
multibeam echosounder, either forward looking or
bathymetric.
3 PAYLOAD DATA PROCESSING
Since the chosen sensor typologies operate on
different principles the captured data are affected by
different distortions, relating to both systematic as
well as environmental sources of corruption. The
cameras introduce geometrical distortions in the
images because of the propagation of
electromagnetic waves through the optical unit.
Moreover the optical signal is affected by strong
degradation due to energy absorption in the water
medium.
On the other hand acoustic sonars are affected as
well by geometrical distortions. That is due to the
peculiar perception of the environment: e.g. side
scan sonar maps contain a central black stripe which
is generated by the propagation of acoustic waves
through the water column. That represents useless
information that has to be erased in order to restore
the correct geometrical properties of the data.
Intensive fluctuations in the pose of the vehicle
which is hosting the sensors, may represent a
relevant source of geometry distortion of the data. In
case of strong oscillations of the vehicle induced by
intense waves or currents this can represent a
dominant issue. This issue highlights the strong need
for the synchronization of the optical and acoustic
data with the navigation data records, in order to get
a proper correction. Under the hypothesis that the
whole set of noise sources can be reduced by proper
restoration and geometry correction techniques the
successive goal is to analyse the output data to
provide an informative description of the
environment.
3.1 Geometry Assessment
The assessment of primitive curves segments in an
image is a typical computer vision issue that has
been tackled in many ways. In order to fulfil the
curve detection purposes within the ARROWS
project, a dedicated procedure has been developed.
The implemented algorithm is based on a statistical
approach in order to provide the system with enough
reliability and computational performances. The
application of the algorithm, based on the Gestalt
theory (Patraucean, 2012), is more thoroughly
described in (Moroni, 2013; Moroni, 2014). Some
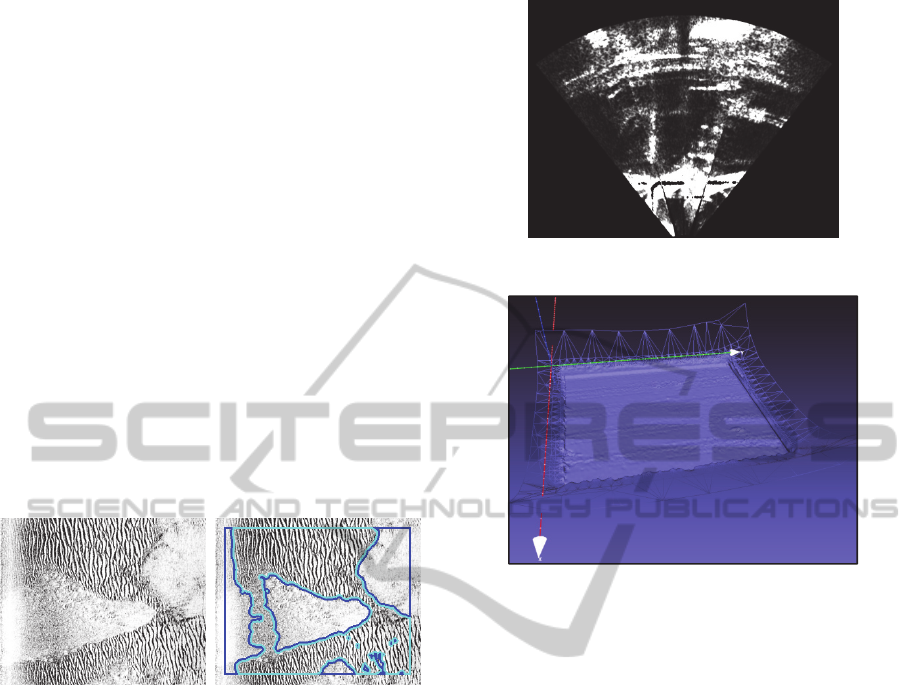
results are showed in Figure 1.
Figure 1: Application of the curve detection algorithm to a
side scan sonar image detail (image taken from
http://www.jwfishers.com/).
3.2 Texture Analysis
Texture is a descriptor of the surface appearance of
objects. This parameter can be exploited to discern
between different kinds of objects and to assign each
SignalProcessingforUnderwaterArchaeology
81
of them to a specific class. In the special case of
underwater mapping, textural analysis is employed
to classify the surveyed environment into seafloor
categories (sand, rock, vegetation). This enables the
detection of anomalies that can be related to
potentially interesting objects.
Within the many descriptors available in the
literature we chose a method based on the Gabor
filters (Jain, 1991). Mathematically speaking a
Gabor filter is a 2D sinusoid, with specific
orientation and frequency values, modulated by a
Gaussian function. The convolution of this filter
with an image results in a map where the regions
exhibiting frequency and orientation values similar
to the filter ones are emphasized. By varying
frequency and orientation and repeating the
convolution operation a set of filter responses is
obtained. Those responses can be clustered
according to the dominant components. This way
every pixel in the image will be assigned to a
specific class. The application of Gabor filters for
textural analysis purposes is illustrated in Figure 2.
Figure 2: Side scan sonar image segmentation by
exploiting of a Gabor filtering technique (image taken
from http://www.ise.bc.ca/).
3.3 Seabed Bathymetry
In the ocean’s setting the multibeam echosounder is
typically exploited for detailed reconstruction of
limited areas of the seafloor. The sensor technology
is based on the simultaneous collection of echoes
from the scattering points located on the seafloor
acoustic footprint. During July 2014 a dedicated
experimental session has been carried out at the
Ocean Systems Lab, Heriot Watt University of
Edinburgh. In that circumstance a BlueView MBES
2250 has been employed to survey a small pool
facility available in the lab.
The raw output data returned by the MB 2250
consist of 2D maps representing the echo returns
collected along the different directions of the
acoustic fan (Figure 3). These maps require a pre-
processing stage to emphasize and extract the
relevant signal from a complex and unstructured
background. To this aim the raw acoustic data has
Figure 3: Example of a multibeam echosounder map.
Figure 4: 3D mesh resulting from the processing of the
multibeam echosounder maps.
been pre-filtered using a median mask to reduce the
corruption associated with the granular noise
(Blondel, 2009) affecting the signal.
Later the signal has been manipulated to isolate the
connected structure corresponding to the first
echoes. To this aim a cascade of morphological
transformations (Gonzalez, 2008) have been applied
to the map to i) identify the connected components
in the map as those structures exhibiting continuity
features and ii) to smooth the contour of the objects
and to discard undesired protrusions by means of an
opening operator. Finally the bathymetry has been
estimated integrating the pre-processed map and the
knowledge of the vehicle position and attitude
obtained from auxiliary sensors measuring the
vehicle pose. By repeating this operation for every
captured map it has been possible to reconstruct the
3D morphology of the pool facility as a set of x, y, z
points. The point cloud can be finally refined by
generating a mesh (Figure 4).
3.4 Large Scale Maps
In the underwater setting the maximum observable
area is inevitably reduced due to the sensor limited
performances and to the unfavourable environmental
IMTA-52015-5thInternationalWorkshoponImageMining.TheoryandApplications
82
conditions. By exploiting a mosaicking technique
(Elibol, 2014; Prados, 2014) the data can be
represented in an overall coherent framework,
showing clearly the spatial relationship between
structures on the seafloor, even if captured at non-
consecutive instants.
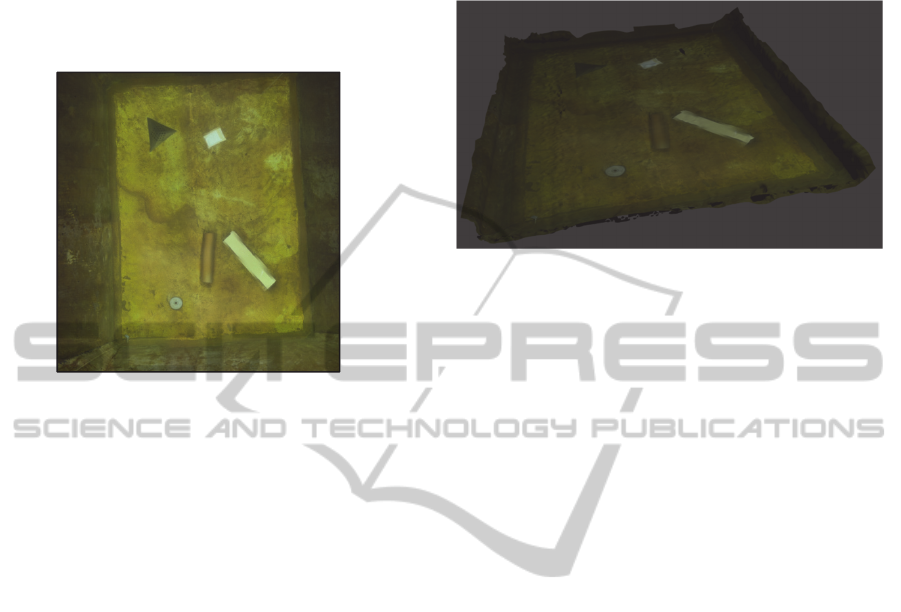
Figure 5: Image mosaic of the small pool at the Ocean
Systems Lab obtained by registering and stitching the
captured optical data.
SIFT correspondences can be identified in the
overlapping areas of chronologically consecutive
maps and exploited to refer all the captured data to a
common coordinate system (Lowe, 2004). The
following step is to fuse all the data in an overall
single synthesis map, consisting of the output
mosaic map. An example of mosaicking technique
applied to the data captured at the Ocean Systems
Lab pool is represented in Figure 5.
3.5 Data Integration
As stated in the previous sections, each sensor
employed in the survey missions will provide an
individual description of the environment. As far as
a robust object recognition process is pursued, it is
interesting to conceive a synthesis structure
summarizing all the informative content related to an
area of the seabed. This can be formally expressed
by introducing a multi-dimensional map, made up of
multiple layers. A point in this map gives details
about the whole information available for the
corresponding point in the world. This refers to
information concerning (i) the raw captured data, (ii)
the results of data analysis algorithms and (iii) the
bathymetry collected by proper sensors or estimated
by computer vision procedures. It is expected that
considering the whole set of available information
can be an efficient way to perform robust object
recognition, reliable with respect to false alarms
rejection. An example of data integration result,
obtained by stitching the camera images mosaic on
the multi-beam bathymetry is illustrated in Figure 6.
Figure 6: Bathymetric map, obtained by integrating a
multi-beam echo-sounder map and an optical mosaic. The
data have been captured during an experiment performed
in the small pool facility of the Ocean Systems Lab, Heriot
Watt University, Edinburgh.
4 CONCLUSIONS
The overall aim of the project is to provide the
archaeologist with tools to be exploited in multiple
ways. First of all the robotic and automation
technology presented in this paper will make easier
the archaeologist procedures, carried out in the
typical hostile and complex underwater
environment. As a byproduct, the archaeologist will
be provided with techniques to perform indirect
measurements and to formulate an historical
interpretation on the findings. Finally, in order to
disseminate knowledge regarding the underwater
cultural heritage and to increase the sensitivity to the
problem of its preservation, the developed tools will
be addressed different audiences, including the
general public. In particular, one of the purposes of
the project is to devise new dissemination channels
making use of 3D immersive representations. The
resulting simulated environment will be populated
by the models generated during the project post-
processing stage. In the following months, the
developed methodology will be tested by organizing
specific campaigns in two European sites, one in
Italy, in the Egadi Archipelagos, and one in the
Baltic Sea. All the collected data will be processed
using the methods reported in this paper and will be
used for assessing the validity of our approach. As a
result, a set of 3D scenes will be produced, with the
aim of replicating the experience of wreck
exploration and survey.
SignalProcessingforUnderwaterArchaeology
83

ACKNOWLEDGEMENTS
The activity described in this paper has been
supported by the ARROWS project. The project has
received funding from the European Union’s
Seventh Framework Programme for research,
technological development and demonstration under
grant Agreement no. 308724.
The authors would like to thank Dr. Pamela
Gambogi, Executive Archaeologist and Coordinator
of the Underwater Operational Team (N.O.S) of the
Tuscany Archaeological Superintendence.
The authors would also like to thank Professor Yvan
Petillot and Professor David Lane from Heriot Watt
University of Edinburgh, for kindly providing access
to the facilities of the Ocean Systems Laboratory.
REFERENCES
Blondel P. "The handbook of sidescan sonar", Springer
Praxis Books, 2009.
Elibol A., Kim J., Gracias N., Garcia R. "Efficient Image
Mosaicing for Multi-robot Visual Underwater
Mapping", Pattern Recognition Letters. Vol. 46, pp.
20–26, 2014. DOI: 10.1016/j.patrec.2014.04.020.
Gonzalez R. C., Woods R. E. "Digital Image Processing",
Pearson International Edition, 2008.
Jain, K. A., Farrokhnia, F. “Unsupervised Texture
Segmentation Using Gabor Filters”. Pattern
Recognition, Volume 24, Issue 12, Dec. 1991, pp.
1167-1186, ELSEVIER SCIENCE INC.
Lowe D. G. “Distinctive image features from scale
invariant keypoints”, In: International Journal of
Computer Vision, 60 (2), pp. 91-110, 2004.
Moroni D., Pascali M. A., Reggiannini M., Salvetti O.
“Underwater scene understanding by optical and
acoustic data integration.”, In: Proceedings of
Meetings on Acoustics (POMA), vol. 17 article n.
070085. Acoustical Society of America through the
American Institute of Physics, 2013.
Moroni D., Pascali M. A., Reggiannini M., Salvetti O.
“Underwater manmade and archaeological object
detection in optical and acoustic data”, In Pattern
Recognition and Image Analysis, Volume 24 (2), pp.
310 - 317. Springer, 2014.
Patraucean, V., Gurdjos, P., Von Gioi, R. G. “A
parameterless line segment and elliptical arc detector
with enhanced ellipse fitting”. In ECCV 2012 –
Lecture Notes in Computer Science, 2012.
Prados R., Garcia R., Neumann L. "Image Blending
Techniques and their Application in Underwater
Mosaicing", Springer, 2014.
IMTA-52015-5thInternationalWorkshoponImageMining.TheoryandApplications
84
