
Determination of Direction and Velocity of the Objects
Vasiliy N. Kruglov, Artem V. Kruglov and Uriy V. Chiryshev
Ural Federal University named after the first President of Russia B. N. Yeltsin, 19 Mira Street, Yekaterinburg, Russia
Keywords: Machine Vision, Control Systems, Image Processing, Fast Fourier Transform, Video Sequence, Frame
Matching, Correlation Surface, Motion Vectors, Movement Direction, Movement Velocity, Scene Depth.
Abstract: In this paper the analysis of methods for determination the direction and velocity of the objects is given. As
applied to the problem of geometry assessment for round timber the optimum by the ratio of accuracy and
performance is phase correlation method. Nonetheless the pointed problem requires better accuracy and
validity, so we had to improve this method and adapt it to the concrete conditions. Modified algorithm was
tested on the image database of real technological process of round timber movement on the conveyer belt.
The offered method has shown its high effectiveness and validity.
1 INTRODUCTION
Determining the direction and velocity of the objects
is possible by combining two adjacent frames in the
video sequence. For two given images:
∶ → ,
∶ → ,, ⊂
(1)
where d is dimension of the images (usually d=2),
the task of combining the images is to find such a
spatial transform ∶→ and brightness transform
∶→which allow to convert one image to
another so that a correspondence points of these
images match each other:
,∈,∈
(2)
That is, every frame is processed by the certain
mathematical apparatus, which allows to determine
the movement of the scene’s object between the
current and previous frames in the sequence of
images.
The most promising methods for the problem
under investigation are: method of determining the
displacement on the basis of cross-correlation
functions (CCF) (Jänne, 2007), the method based on
the phase correlation (Gonzalez and Woods, 2005)
and Lucas-Kanade method based on the optical flow
(Lucas and Kanade, 1981). Although a number of
methods discussed in this article are not complete,
they are typical representatives of the motion
analysis technique, commonly used in practice. Each
of these methods has advantages and disadvantages
as well as they require the optimum conditions,
which depend on the particular application.
2 BODY OF ARTICLE
Method based on the cross-correlation functions of
the two images is calculated according to the
formula:
11
00
11 11
22
00 00
[( , ) ( , )]
(, ) ,
(, ) ( , )
0, 1, 0, 1
NM
yx
NM NM
yx yx
Ix y Tx xy y
Cxy
I
xy T x xy y
xKMyLN
(3)
With this method it is possible to select section of
one image on another and the difference between the
location of these sections on the images is equal to
displacement of the object against the camera
occurred at the time of a new frame arrival. Among
the shortcomings of the method based on CCF
should be noted the instability to rotations and affine
distortions, as well as high sensitivity to brightness
variations.
Lucas-Kanade method searches for the bias in
the vicinity of the singular point (Shi and Tomasi,
1994). This approach is often called differential as it
is based on the calculation of the partial derivatives
by horizontal and vertical directions of the image. In
case of founding the bias in the vicinity of the
singular point, its position updates for further search.
Otherwise, the singular point is excluding from
103
N. Kruglov V., V. Kruglov A. and V. Chiryshev U..
Determination of Direction and Velocity of the Objects.
DOI: 10.5220/0005431501030107
In Proceedings of the 5th International Workshop on Image Mining. Theory and Applications (IMTA-5-2015), pages 103-107
ISBN: 978-989-758-094-9
Copyright
c
2015 SCITEPRESS (Science and Technology Publications, Lda.)
further analyses. By its nature, this method is local,
that is, the area only around the pixel is taken into
account for the determination of the particular pixel
displacement. As a consequence, it is impossible to
sufficiently determine the bias within the large
uniformly colored sections of the frame.
Fast Fourier Transform method (FFT) for the
phase correlation function is based on the
assumption that if the signal has spatial and temporal
shift, the frequencies and amplitudes of the
harmonic components remain constant, only the
initial phases change (phase-frequency spectrum),
and the phase of each harmonic component varies
proportional to the frequency and shift of the signal
at that.
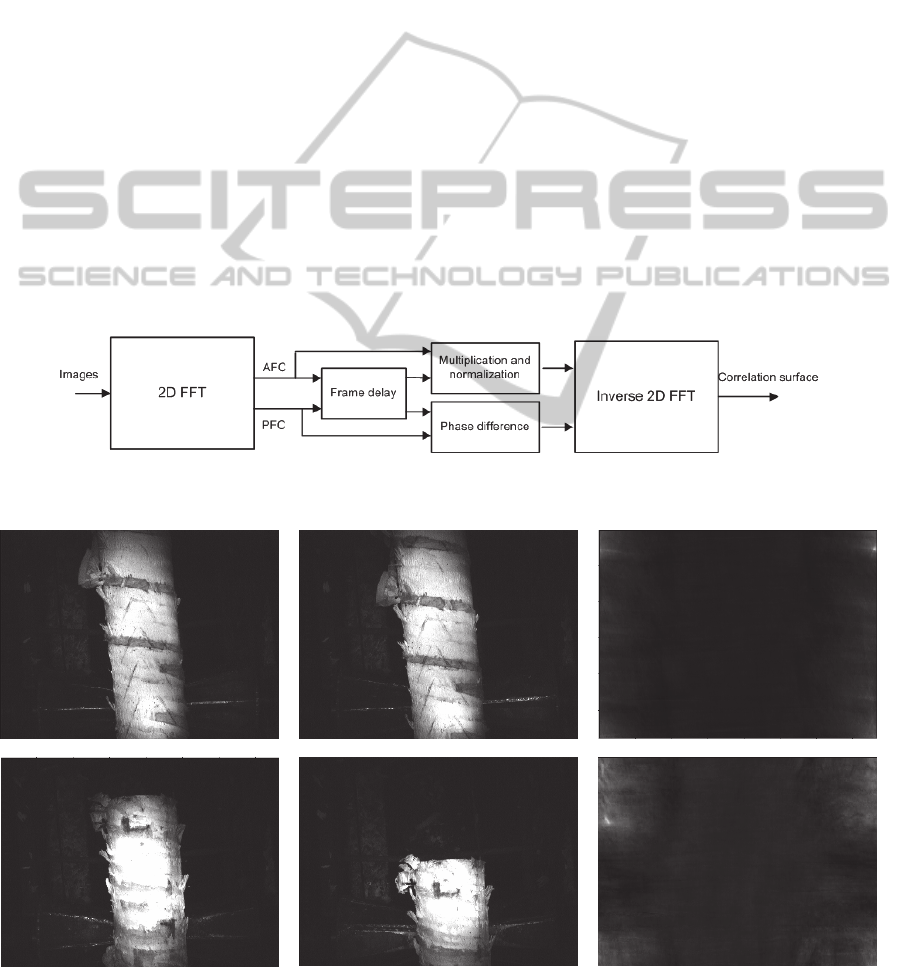
Block diagram of moving vectors receiving by
the phase correlation method is shown on the Figure
1.
The result of transformation is a correlation
surface which is function of two spatial values on
the image plane. If there was no movement the
difference of phase spectra is equal to zero. In this
case spectral components sum up during the
synthesis in phase. It results in surge with spike in
origin of coordinates. When the object moved
several number of maximums appear on the
correlation surface.
Figures 2-3 present results of transforming by
phase correlation obtained with the help of Image
Processing Toolbox.
Transformation was applied to the whole image
and as a result we have one vector (spike)
correspond to the direction of object’s movement.
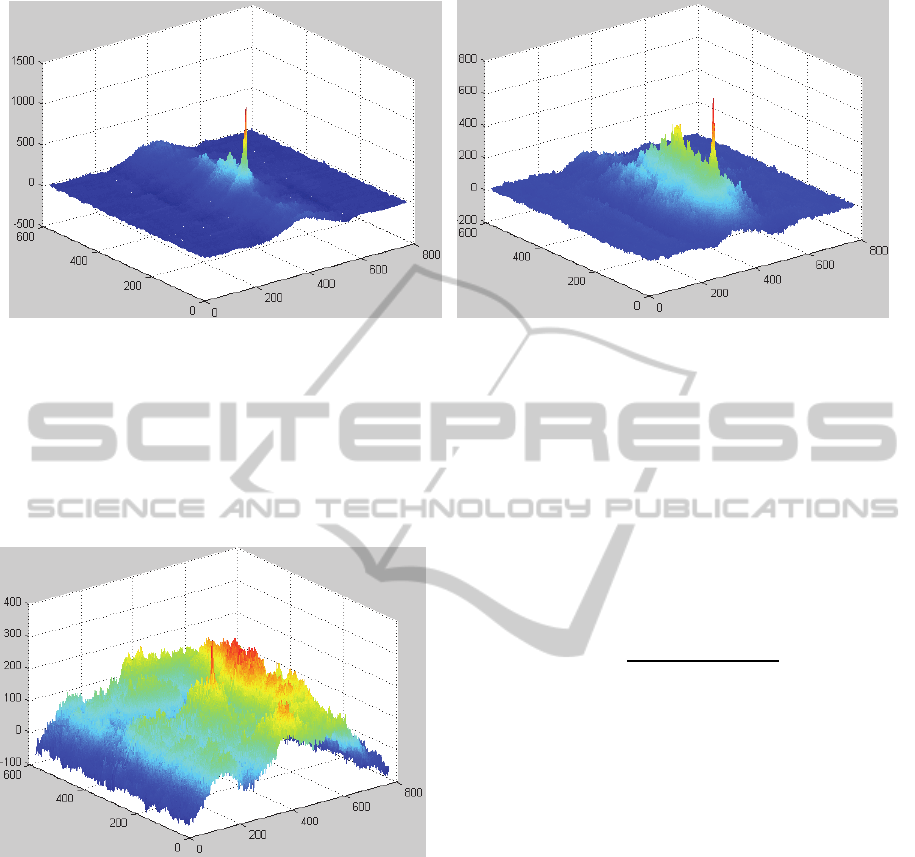
Disadvantages of this method are
Impossibility of determination the value of
movement in case of several moving objects on
the frame
High noise susceptibility
In case of intense noise on the one of the frames
(e.g. camera noise) the dedicated spike may
correspond to the noise (Figure 4), so the
information about direction and velocity of
movement will be inconsistent. In the problem of
geometry assessment of round timber target object
(log) is measured 180-250 times during scan, so
propagation error leads to incorrect result, which is
unacceptable for this task.
Figure 1: Block diagram of FFT phase correlation workflow (AFC – amplitude-frequency characteristic, PFC – phase-
frequency characteristic).
a) previous image b) current image c) correlation surface
d) previous image e) current image f) correlation surface
Figure 2: Phase correlation method for two pairs of frames (a-b and d-e).
IMTA-52015-5thInternationalWorkshoponImageMining.TheoryandApplications
104
a)
b)
Figure 3: 3D-images of correlation surfaces from figures 2,c and 2,f respectively.
Moreover, phase correlation method is not
capable to carry out analysis of several objects in
general case because each object (log on the
conveyer belt) has its own direction and velocity of
movement which don’t match with these
characteristics of other objects.
Figure 4: 3D-image of correlation surface with intense
noise.
Unfortunately, each of these methods has
limitations so the use of any one for this task
becomes difficult. Method based on the CCF is not
resistant to the affine distortions and rotations, and
leaves out of account a particular texture. Lucas-
Canada method is not resistant to affine distortions,
highly sensitive to changes in brightness and shows
insufficient result in the absence relief sections on
the image. FFT phase correlation algorithm has a
lower performance compared to the previous ones,
but it is more accurate.
Thus, based on these findings, an algorithm that
adapt to the scene conditions and the features of the
objects on the image in order to operate with
maximum efficiency for solving the motion
estimation of roundwood on the conveyor was
developed.
This method is as follows. At the first stage of
the frame processing the selection of the front-stage
objects is carried. Then, several sections (7-15 pcs.)
are taken on each selected object, and each section
of the current frame F
i
(t) is compared with the
corresponding block of the previous frame F
i
(t-1),
i
(0,n) by FFT phase correlation as follows:
,
, ∙
э
∗
,
∙
э
(4)
where R(u,v) is a spectral unit function which phase
is equal to the phase difference between the
functions
т
F
and
э
F
. Variables u and vare angular
frequencies. Further the inverse Fourier transform is
computed via the function of mutual phase
spectrum:
1
(, ) [ (,)]Pxy F Ruv
(5)
Function P(x,y)gives a clear peak which determines
the measure of similarity of the images, and the peak
position corresponds to the shift of one picture
relative to another. The basic idea of this step is to
identify the most informative sections within each
region F
i
(t) and to establish by them matching with
the region on the previous frame. In this case, it is
necessary that each section contains enough
information (relief texture) to establish a correct
match. To achieve this, the procedure of stacking the
measuring sections by elliptical curve relative to the
center of the field F
i
(t) with subsequent
measurement of the value reflecting the information
content of each section is implemented. Information
content is measured in the horizontal E
H
and vertical
DeterminationofDirectionandVelocityoftheObjects
105
E
V
directions as follows:
1
1
00
1
1
00
(, ) ( , ) (, )
(, ) ( , ) (, )
j
i
j
i
M
M
HtijH
ij
M
M
VtijV
ij
Exy Ixiay jaSij
Exy Ixiay j aSij
(6)
where S
H
, S
V
are Sobel functions for horizontal and
vertical directions which applied to the image I
t
at
the point (x,y) and
,
– tie point in kernel
coordinates
10 1 1 2 1
202 000
10 1 1 2 1
HV
SS
(7)
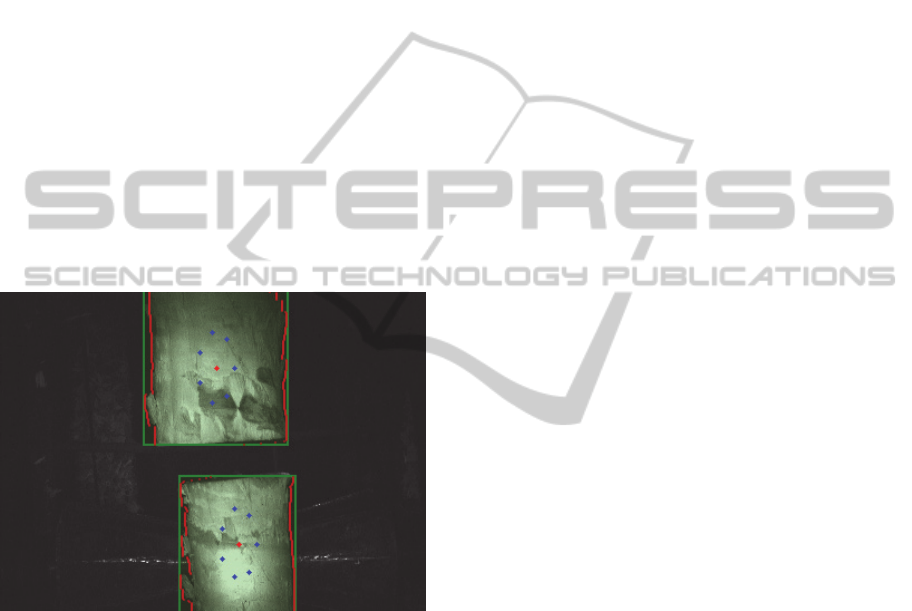
It is necessary to make a number of adjustments to
the current step, concerning certain aspects of the
algorithm. Firstly, the search sections for each
region of interest are stacked along the elliptic curve
within each log (blue dots in Figure 5).
Figure 5: Visualisation of sectional FFT phase correlation
in video sequence in the task of roundwood analysis.
Centers of each section of the objects are marked with
blue dots.
This step is stipulated by the necessity of
compact and uniform distribution of the regions of
interest within each log. It is this method will be by
far the best in terms of uniform stacking of sections
due to the fact that the logs have the elongated along
the motion’s direction profile with a relief texture on
the image. Secondly, the magnitude of the
information content of each section in fact is
meaning of the contrast ratio within a region of
interest so it provides a priori information for
solving the problem of searching the best vector. In
other words, the contrast value establishes a
connection, i.e. indirectly affect the probability of a
correct definition of the shift. Intuitively, the more
contrasting matching sections, the higher probability
that the motion vector for this section will be the
most correspond to the real shift.
With this approach the matching is performed in
two stages. At first, the discrete correlation function
is computed and its "rough" maximum is
determined, then the peak position is adjusted by the
intensity interpolation method (Gonzalez and
Woods, 2005). In the next step, among formed
candidate vectors search for the best one, which
value is considered as the shift of the object, is
implemented by heuristic search method.
This process has three important features. Firstly,
the subpixel search of the peak position of the
correlation surface would greatly increase the
accuracy of determining the shift of the objects.
Secondly, the search operator is applied not to the
entire image, but to the regions where objects were
detected. Thirdly, due to the exhaustive search
within a few number of motion vectors (for the
current task which characterized by objects with
feebly marked relief and possible lack of the specific
features the number of candidates is 7 for each
object) and parallel processing (Kruglov et al.,
2013), a high speed of the algorithm is achieved
(Figure 5).
Tracking objects assumes the establishment of
correspondence between the objects of the previous
frame and the objects detected in the current frame
(Kruglov and Kruglov, 2013). Correspondence
between the objects considered to be established if
these objects are spatially close, displacement is
small and both are sufficiently similar. Proximity
criterion is the fulfillment of the following
conditions:
the Euclidean distance between the centers of
mass of the objects is small;
the size of the object does not vary much from
one frame to another (also by the Euclidean
distance).
The resulting algorithm for determination the
direction and velocity of the logs on the basis of the
phase correlation method was tested on the images
database of the actual video sequence process
(435,000 frames). The size of the sections for phase
correlation was 64 * 64 pixels, the number of blocks
- 7 for each selected front-stage object. Test was
carried out in MATLAB framework on the IBM PC
IntelCore i7 2.8GHz. The results of the test are
shown in Table 1.
IMTA-52015-5thInternationalWorkshoponImageMining.TheoryandApplications
106

Table 1: Performance of the algorithm.
1 object
7 sections
2 objects
14 sections
3 objects
21 sections
Without
multithreading
15 ms 28 ms 40 ms
With multithreading
(OpenMP)
7 ms 11 ms 14 ms
According to the results, it should be noted that
offered method for determination the direction and
velocity of the objects based on the phase correlation
demonstrates high efficiency on the test images.
Reliability and performance of the algorithm fully
comply with the conditions of use in machine vision
systems for real-time control of technological
processes associated with the analysis of fast-
moving objects.
3 CONCLUSIONS
As is known from mechanics, solid body moving in
three-dimensional space, can have a six degrees of
freedom maximum: three translational and three
rotational. Degrees of freedom are a set of
coordinates that certainly defines the position of an
object in an associated coordinate system.
Log, like a solid body moving in the plane of the
conveyor, has four degrees of freedom (two
rotational and two translational) This limitation
should be considered in solving the problem of
measuring the volume of logs by observing their
movement in front of the camera. It is possible to
simplify the problem by assuming that the log
moves along rigid rails, i.e. it does not have the
ability to move sideways and rotate, then it has only
one degree of freedom. When using such
simplification, in the sequence of images would be
observed the shift with a constant orientation,
wherein only the instant amplitude varies from
frame to frame. But the fact is that in the real
conditions of logs transportation such ideal type of
movement does not exist. Therefore, it is recognized
as necessary that the log has four degrees of freedom
and all four components of the movement must be
taken into account to accurately measure log’s
length; or at least we can consider the log as material
point with one degree of freedom in the main
approximation (and make corrections due to its
vibrations in other directions when its main
movement is calculated with proper accuracy).
Task of determining the movement of the log can
be formulated as follows: if the log’s shift on the
image is defined by offered method for two
neighboring frames, and its value can be written as a
vector with coordinates (x, y), then how the value
characterizing the physical movement of the log can
be obtained from the resulting vector? How to get
the four-dimensional vector from the two-
dimensional? How to solve a system of two
equations and four unknowns?
In the photo and video camera, an image is
formed under the law of the central projection. As
we know, such a mapping of three-dimensional
space on a plane is not unambiguous because all
three-dimensional points lying along a single ray are
projected at one point on two-dimensional image. In
other words, once we got the log’s image, i.e. from
three-dimensional space transformed into a two-
dimensional, we lost a lot of information related to
the depth of the observed scenes and objects in it.
Recovering of this information is not possible
while using only one camera. The only way of
further developing for this task is to use multiple
cameras for reconstruction of the log in three-
dimensional space. In that case the information
about the depth of the scene and objects on the
image allows to convert the value of the motion
vector, obtained by the offered method, to the
physical movement of the log.
REFERENCES
Jänne B., 2007. Digital image processing, Technospera.
Moscow,5
th
edition.
Rafael C. Gonzalez, Richard E. Woods 2005. Digital
image processing.Technospera.Moscow,3
rd
edition.
Dvorkovich A. V., Dvorkovich V. P., Zubarev J. B.,
Sokolov A., 1998. A method for analyzing motion
vector components in dynamic images. Patent of the
Russian Federation, the application of 15 July 1998.
Dvorkovich V. P., Nechepaev V. V., 1998. Motion
compensation using the Fourier transform. 1st Int.
Conf. Digital Signal Processing and its Application.
Moscow, ICSTI.
J. Shi, C. Tomasi, 1994. Good features to track. Proc.
IEEE Comput. Soc. Conf. Comput. Vision and Pattern
Recognition.
B. D. Lucas, T. Kanade, 1981. An iterative image
registration technique with an application to stereo
vision. IJCAI'81 Proceedings of the 7th international
joint conference on Artificial intelligence - Volume 2.
Kruglov V. N., Kruglov A. V., Chiryshev U. V.,
Chiryshev A. V., 2013. Application of intensive
algorithms in real time machine vision systems.
Fundamental research. № 10.
Kruglov V. N., Kruglov A. V., 2013. A way to estimate
the discharge of the melt jet flowing out of a melting
furnace. Pattern recognition and image analysis, № 4.
DeterminationofDirectionandVelocityoftheObjects
107
