
Petri Net Model Cost Extension based on Process Mining
Cost Data Description and Analysis
Dhafer Thabet, Sonia Ayachi Ghannouchi and Henda Hajjami Ben Ghézala
RIADI Laboratory, National School for Computer Sciences, Mannouba University, Mannouba, Tunisia
Keywords: Business Process Management, Business Process Improvement, Process Mining, Petri Net Model Cost
Extension, Cost Description, Cost Analysis.
Abstract: Organizations always look for enhancing their efficiency and competitiveness by improving their business
processes. Business Process Management includes techniques allowing continuous business process
improvement. Process mining is a mature technology allowing to extract knowledge from event logs.
Process model extension is a process mining technique covering different perspectives of the business
process. Furthermore, financial cost incurred during business process execution is one of the relevant
information needed by decision makers to take the appropriate improvement decisions in terms of cost
reduction. Thus, we proposed a solution allowing Petri Net model extension with cost information using
process mining extension technique. However, the proposed solution simply provides cost information by
associating them to the corresponding elements of the Petri Net model, which is not sufficient for decision
making support. In this paper, we propose several improvements and extensions of the proposed solution in
order to enhance the provided decision making support. These proposals include cost data structuring,
description and analysis with respect to the recommendations drawn from talks with experts.
1 INTRODUCTION
Efficiency and competitiveness are the main
concerns of all organizations (Briol, 2008). The
Business Process Management (BPM) approach has
been highly considered for its potential of,
continuously, enhancing organizations’ business
processes (BPs). Process Mining (PM) is a BPM
technique used to analyze BPs based on Event Logs
(ELs) commonly available in today’s information
systems. Among the PM techniques, the extension
technique enables process model enhancement with
useful information. Moreover, organizations are
always concerned with reduction of costs incurred
during the execution of their BPs. Management
Accounting (MA) is the field dealing with how cost
and other information should be used for planning,
controlling, continuous improvement and decision
making (Weygandt, Kimmel and Kieso, 2010;
Hansen and Mowen, 2006). Furthermore,
associating cost data to the corresponding elements
of the BP model enables decision makers to easily
have accurate cost information about each element.
In (Thabet, A. Ghannouchi and H. Ben Ghezala,
2014a), we studied the issue of BP model extension
with cost information based on PM. Then, we started
by proposing a solution for cost extension of Petri
Net (PN) models based on PM extension technique.
A PN is a directed bipartite graph populated by
places and transitions connected by arcs. Although
the proposed solution is a new way of providing BP
cost information, but improving cost data handling
would further facilitate decision making for BP
improvement in terms of cost reduction.
In the remainder of this paper, we specify the
considered research questions in Section 2. In
Section 3, we present related works to the research
questions. Section 4 summarizes the talks we
conducted with experts and present the enhanced
solution design. Section 5 deals with the enhanced
solution implementation. In Section 6, we illustrate
the test of the enhanced solution. Finally, in Section
7, we summarize the main contributions and present
the future works.
2 RESEARCH QUESTIONS
The main research goal of our work is to extend BP
model with cost information using the PM extension
268
Thabet D., Ayachi Ghannouchi S. and Hajjami Ben Ghézala H..
Petri Net Model Cost Extension based on Process Mining - Cost Data Description and Analysis.
DOI: 10.5220/0005377402680275
In Proceedings of the 17th International Conference on Enterprise Information Systems (ICEIS-2015), pages 268-275
ISBN: 978-989-758-098-7
Copyright
c
2015 SCITEPRESS (Science and Technology Publications, Lda.)

technique in order to support decision makers to
improve their BPs in terms of incurred cost
reduction. Based on cost annotated ELs (Nauta,
2011), the solution we proposed in (Thabet, A.
Ghannouchi and H. Ben Ghezala, 2014a; 2014b)
performs a PN model cost extension including cost
information extraction, calculation and association
to each transition of the PN model.
However, as we aim at providing better support
for decision makers, the proposed solution may be
improved at different levels, mainly, in terms of cost
data structure, description and analysis. In this
paper, we consider the following main research
questions:
What are the suited improvements we should
adopt for the proposed solution -at the levels
of cost data structure, description and
analysis- so that it provides better decision
making support for BP cost reduction?
What are the suited ways to bring these
improvements to the proposed solution?
3 RELATED WORKS
Nauta (2011) proposed an architecture to support
cost-awareness in PM. Nauta’s approach, mainly,
allows to annotate initial EL with cost information
based on a cost model created using information
provided by management accountants, the BP and
the organizational models. Then, the cost annotated
EL is used to generate cost reports (Nauta, 2011).
However, cost reports are not sufficient for a better
decision making support.
This work have been pursued by a current PhD
project named “Cost-aware BPM” started in 2012
(Wynn, 2012). The authors propose a cost mining
framework to support MA decisions on cost control
for monitoring, predicting and reporting. The
proposed framework allows customizable cost
reports generation and cost prediction (Wynn, Low
and Nauta, 2013). The cost prediction looks for cost
patterns so that it would be possible to predict cost
consumption of an ongoing BP (Wynn, et al., 2014).
The cost prediction is based on a cost extension of
the transition system approach (van der Aalst,
Schonenberg and Song, 2011) to produce a cost-
annotated transition system. However, the authors
focus on interpretation of the generated cost-
annotated transition system without explaining the
method used to deduce cost patterns and also
without giving details about the way the transition
system-which is used in to predict current case time
completion- was extended for cost prediction.
4 SOLUTION DESIGN
In the following, we give an overview about the
conclusions drawn from talks with experts, the
enhanced approach and the enhanced cost data
structure based on these conclusions.
4.1 Talks with Experts
In order to find out the appropriate improvements to
adopt for the first version of the proposed solution,
we organized appointments for talks with experts in
MA and BPM. These talks were driven by a
question-based guide and led us to the following
main recommendations:
Cost data structure: (1) cost types differ from
an organization to another and (2) it is
important to take into account resource, time
and data attributes.
Cost data description: cost data could be
described using tables and graphics in order to
be represented based on other related factors.
Cost data analysis: interest to analyze cost
data in such a way to find out what are the
factors influencing cost values.
4.2 Approach Overview
As shown in Figure 1, the inputs of the proposed
approach are: the PN model and the corresponding
cost annotated EL produced by Nauta’s approach.
The first step of the approach is the extension of the
PN with cost data. This step includes cost data
extraction from a cost annotated EL, PN model
loading and cost data association to the
corresponding transition of the PN model. The
output of this step is a cost extended PN model.
Next, the PN model is displayed along with the
associated cost perspective. The next step of the
approach is to handle the cost extended PN model in
such a way to further support decision makers in BP
cost reduction. For each selected transition, cost data
can be handled in two ways: cost data description
and analysis. Cost data description allows decision
makers to get insight about each transition of the PN
model from a cost point of view. Cost data analysis
provides knowledge about the factors influencing
cost values for each transition of the PN model.
4.2.1 Cost Data Description
Cost data description is improved using
customizable tables and graphics. On one hand,
tables are used to present cost values computed
PetriNetModelCostExtensionbasedonProcessMining-CostDataDescriptionandAnalysis
269

according to the user selected computation mode(s)
and cost type(s) for each transition of the PN. On the
other hand, graphics are used to present different
views of average cost values based on different
factors for each transition of the PN model. The
considered views are as follows:
Cost/Cases view: represents the average cost
data and user-defined cost data based on BP
cases. This enables decision makers to
visualize the average cost evolution over BP
cases compared with the user-estimated cost,
for each transition.
Cost/Resources view: represents the average
cost value of transition instances executed by
each resource. This enables decision makers to
visualize the average cost value for each
resource involved in the considered transition
execution.
Cost/Cost Types view: represents the average
cost value per cost type. This allows decision
makers to visualize the distribution of average
cost values by cost types.
Thus, on one hand, the proposed approach allows
users to easily customize cost data description
directly on the PN model for each selected transition
using tables and graphics while in the approach
proposed by (Nauta, 2011; Wynn, Low and Nauta,
2013; 2014), only resource-related cost information
can be visualized and are in the form of separate
tables or graphs. On the other hand, the proposed
approach includes views allowing users to visualize
graphically the relationship between cost estimated
values and the actual ones which is not considered in
related works, namely, (Nauta, 2011; Wynn, Low
and Nauta, 2013; 2014).
4.2.2 Cost Data Analysis
We extended the proposed approach with two
methods for cost data analysis. We started by
focusing on the resource attribute as it is obvious
that resources, involved in the execution of a task,
influence the incurred cost of that task. We proposed
a resource classification method based on transition
average cost. The method consists in classifying
resources into two groups by comparing resource-
based average cost of a given transition with a user-
defined cost value. Afterwards, we proposed a cost
data analysis based on more than one attribute. The
goal is to extract knowledge about which transition-
related attributes influence transition cost values,
and how. Furthermore, Machine Learning (ML)
techniques can be used to discover structural
patterns in data, based on a set of training instances.
ML classification technique can determine classes of
instances based on their attributes (Rozinat, 2010;
Witten, Eibe and Hall, 2011; Han, Kamber and Pei,
2012). Therefore, using a ML classification
algorithm, we can extract knowledge about the
influence of selected attributes on transition cost
values. The inputs of a classification algorithm are:
training examples, attributes and classes. In our case,
for each transition of the PN model, training
examples are the transition-related instances
contained in the cost annotated EL. The attributes to
be analyzed are the transition-related attributes
including: resource, time and data attributes. The
classes are: C1 (respectively C2) represents
transition instances having an average cost value
higher (respectively lower) than a user-estimated
cost value. The outputs are the inferred structural
patterns represented in different forms such as
classification rules.
In (Nauta, 2011; Wynn, Low and Nauta, 2013;
2014), cost data analysis consists in predicting costs
of ongoing cases. This supports decision makers to
take decisions in order to reduce incurred costs of
the ongoing case. However, cost data analysis we
propose supports decision makers to find out which
factors influence cost values for each selected
transition. Thus, this supports them to take the
appropriate decisions in order to improve the whole
BP from a cost point of view.
4.3 Petri Net Meta-model Extension
with Cost Data Structure
The Petri Net Markup Language (PNML) is a
proposal of an XML-based interchange format for
PNs and has been defined as an international
standard (ISO/IEC 15909 series) which defines a
meta-model of four packages: PNML core model,
Place/Transition Nets, Symmetric Nets and High-
level Petri Net Graphs. PNML core model package
can represent any kind of PN (LIP6, 2012; 2013;
Hillah, et al., 2009). Therefore, in our work, we
consider the PNML core model package as the PN
meta-model. Figure 2 shows the UML (Unified
Modeling Language) class diagram representing the
PNML core model extended with the cost data
structure. The PNML Core Model package contains
classes and their relationships representing the
considered PN meta-model. More details about the
PNML Core Model structure are available in
(Hillah, et al., 2009; Thabet, A. Ghannouchi and H.
Ben Ghezala, 2014). The Cost Extraction and
Analysis package contains classes and their
relationships representing the cost data structure.
ICEIS2015-17thInternationalConferenceonEnterpriseInformationSystems
270
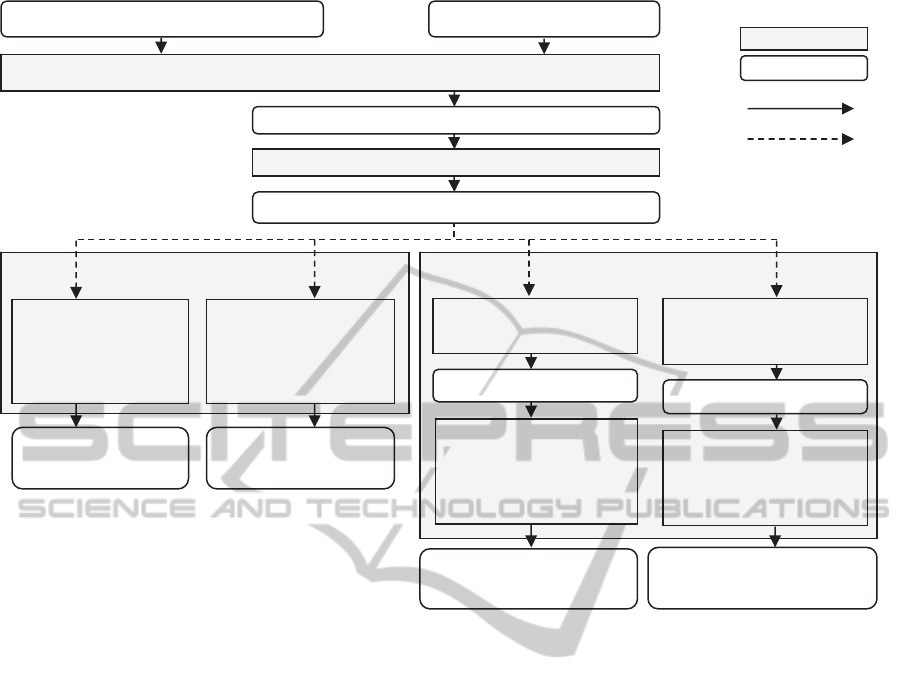
Figure 1: Overview about the proposed approach.
The cost data structure consists of the dark-colored
classes and their corresponding relationships. The
Cost class represents the cost concept which is
described by its value and its currency. The Task
Cost class represents the cost of a task in the cost
annotated EL. A task is considered as the equivalent
of a transition in the PNML model. Thus, the Task
Cost class is associated to the Transition class. A
task cost consists of the costs of the corresponding
task instances (Task Instance Cost class). The Task
Instance Cost class contains information about the
task instance and its cost. In order to be able to
describe and analyze cost data as detailed in Section
4.2.1 and Section 4.2.2, we should memorize
resource, time and data attributes for each task
instance. Each task instance is performed by one or
more resources, has start and end times and could
include other data attributes. Thus, we defined
Resource, Time and Data Attribute classes and
associate them to the Task Instance Cost class.
Moreover, a task instance cost is composed of
several elementary costs (Elementary Cost class).
Each elementary cost has a cost type (Cost Type
class). The proposed cost data structure is defined in
such a way to facilitate the cost extension of the
PNML core model. However, the cost data structure
proposed in (Nauta, 2011; Wynn, Low and Nauta,
2013; 2014) is defined for cost annotation of an EL.
Besides, the proposed cost data structure captures
every useful transition-related information for cost
data description and analysis while (Nauta, 2011;
Wynn, Low and Nauta, 2013; 2014) focus only on
resource and time information.
5 SOLUTION
IMPLEMENTATION
In the following, implementation of the proposed
solution improvements is presented.
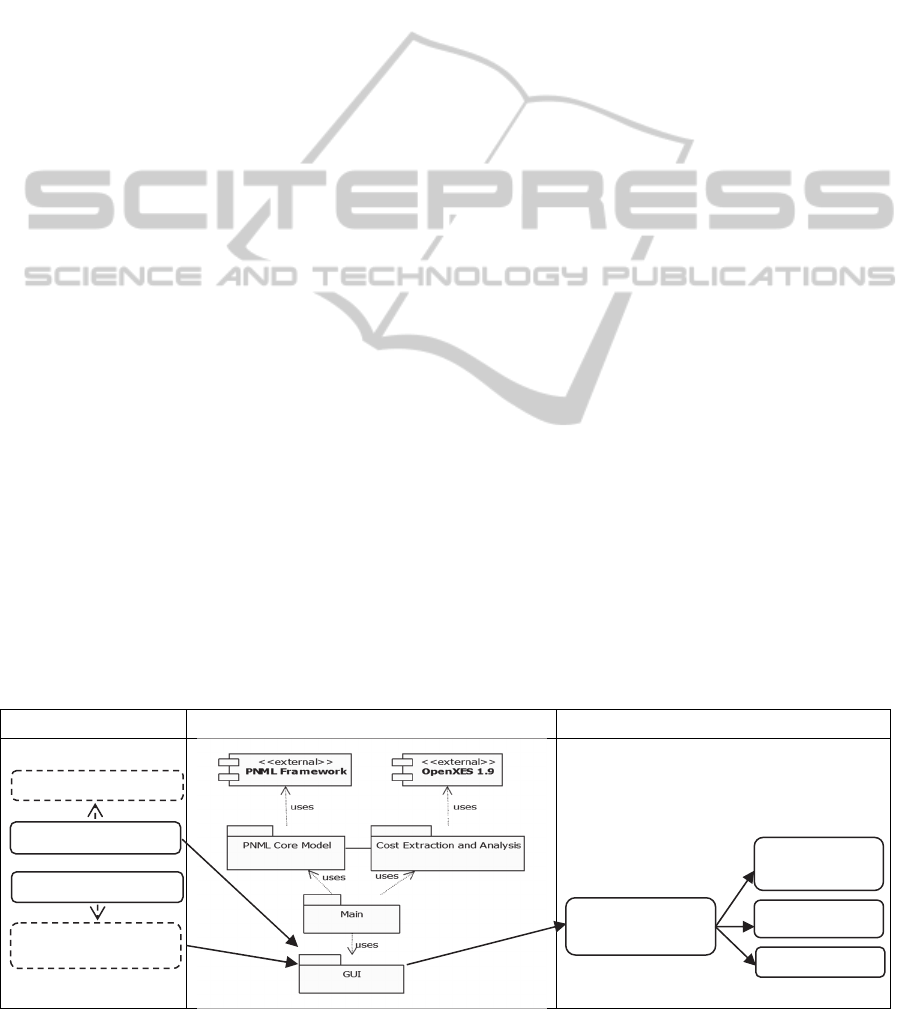
5.1 Tool Architecture Overview
As shown in the left side of Table 1, the required
inputs for the proposed tool are the following. (1)
The PN model file (PNML) which meets the PNML
core model structure; and (2) the corresponding cost
annotated EL (XES) which meets the cost extended
XES meta-model.
Extend and Display the Petri Net model with cost data
Cost annotated event lo
g
(
Nauta’s a
pp
roach
)
Petri Net model
Cost extended Petri Net model displayed
Describe cost data
for the selected transition
Analyze cost data
for the selected transition
Calculate and Display
cost data according to
the user-selected
computation modes
and cost types
Prepare and generate input
data for ML classification
Extract knowledge about
attributes influencing cost
values using a ML
classification algorithm
Cost data displayed
using tables
ML input data generated
Knowledge extracted and
displayed
Classify resources into
resources involved in
incurring costs
higher/lower than a user-
defined cost value
Resources classified and
displayed using tables
Calculate and Display
cost data based on the
user-selected factor
(cases/ resources/ cost
types)
Cost data displayed
using graphics
Select a transition
Cost extended Petri Net model with selected transition
Define
the estimated cost value
Use
r
-defined cost value
Input/Output
Step/Sub-Step
Le
g
end
Se
q
uential flow
Optional flow
PetriNetModelCostExtensionbasedonProcessMining-CostDataDescriptionandAnalysis
271
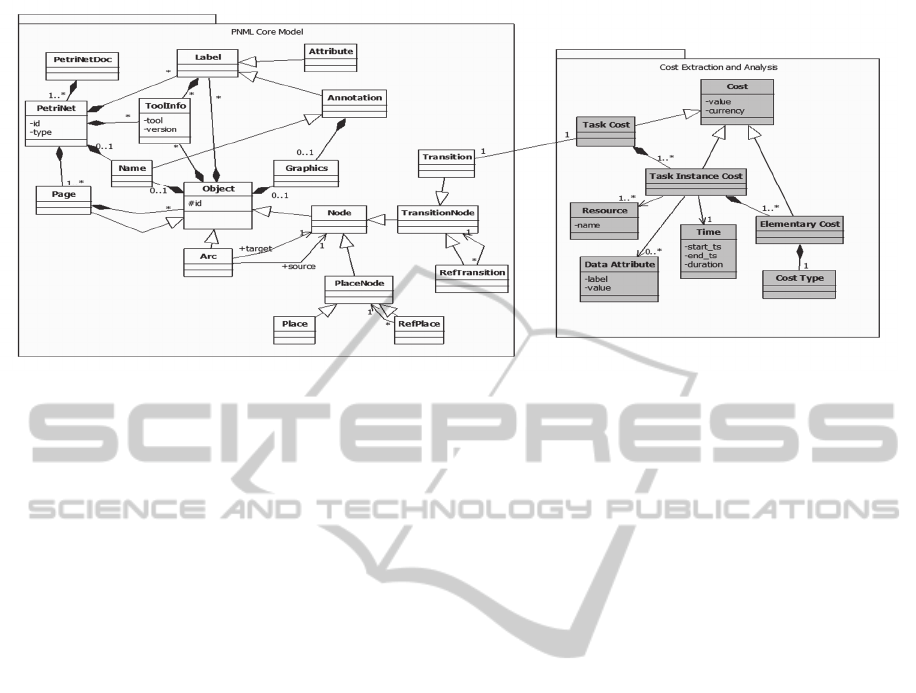
Figure 2: PNML core model extended with cost data structure.
XES is an XML-based generic format for ELs
(Hverbeek, 2012). The central part of Table 1 is a
UML component diagram illustrating the internal
structure of the implemented tool. The inputs are
imported using graphical user interfaces (GUI
package). The extraction of cost data from the cost
annotated EL is performed using the Cost Extraction
and Analysis package which imports the OpenXES
(1.9) library. OpenXES is a reference
implementation of the XES standard for storing and
managing EL data (Hverbeek, 2012). The extracted
cost data is structured with respect to proposed cost
data structure (Figure 2). The PN model is loaded
using the PNML core model package which uses the
PNML framework, a prototype implementation of
the international standard on PNs (LIP6, 2012;
2013). The main package ensures the association of
cost data to the corresponding PN transitions and the
display of the cost extended PN model using the
GUI package. Then, the produced output is a cost
extended PN model graphically displayed.
Afterwards, cost data description and analysis can be
performed using the Cost Extraction and Analysis
package. Cost data description outputs can be
displayed using tables or graphics while cost data
analysis outputs can be in the form of tables or
ARFF (Attribute-Relation File Format) files (Witten,
Eibe and Hall, 2011). ARFF is the main input file
format used in the Weka (Waikato Environment for
Knowledge Analysis) system (Witten, Eibe and
Hall, 2011). The Weka workbench is a collection of
state-of-the-art ML algorithms and data pre-
processing tools. It provides implementations of ML
algorithms which can easily be applied to a dataset
(Witten, Eibe and Hall, 2011). In our case, the
dataset is presented in Section 5.4.
5.2 Cost Extraction and Extension
Algorithms
In (Thabet, A. Ghannouchi and H. Ben Ghezala,
2014a; 2014b), we defined two different cost data
structures for cost extraction and extension
algorithms. This can be a waste of memory and
processing time. In this paper, we define a common
cost data structure in order to optimize our tool
performance and to further facilitate cost data
handling. The new defined cost data structure is
shown in Figure 2 (Cost Extraction and Analysis
package). Thus, we improved the algorithm of cost
data extraction from cost annotated EL. When
starting the parse of the cost annotated, a collection
of task costs is initialized. For each process instance
in the EL, every time a start event is found, start
time data are extracted and associated to the
corresponding task instance cost. For an end event,
cost types-related data are extracted and associated
to the corresponding task instance cost. Moreover,
resource, time and other attributes data are extracted
and linked to the corresponding task instance cost.
Task instances costs are grouped based on task
labels in order to obtain each task cost composed of
its corresponding task instances costs. Each task cost
is added to the task costs collection. Once the cost
data is extracted from the cost annotated EL and the
PN model is loaded, the latter is extended with the
extracted cost data. As the extracted cost data is
related to tasks in the cost annotated EL, we
consider the extension of PN transitions. Thus, each
task cost is associated to the corresponding
transition. Then, the result is a cost extended PN
model which is used to describe and analyze
transition-related cost data.
ICEIS2015-17thInternationalConferenceonEnterpriseInformationSystems
272
5.3 Cost Data Description
Implementation
The cost extended PN model is used to present
transition-related cost data using tables and graphics.
Tables are used to visualize cost data for a selected
transition in the PN model. Table lines represent the
user-selected computation modes (average,
maximum, minimum) and its columns represent the
user-selected cost types. Graphics (charts) are used
to visualize cost data by different views for a
selected transition in the PN model. The Cost/Cases
view is presented using a 2D curve which represents
the transition average cost values by BP cases. The
Cost/Resources view is presented using vertical bars.
Each one of them represents the average cost of task
instances executed by a resource. The Cost/Cost
Types view is visualized using waterfall-organized
bars. Each bar represents the average cost per cost
type for the transition in hand.
5.4 Cost Data Analysis Implementation
The first cost data analysis method consists in a cost-
based resource classification. For each transition of
the PN model, the user provides a cost type and the
corresponding estimated cost value. Then, the
average cost of task instances executed by each
resource is calculated and compared with the
estimated cost. Next, resources are classified in two
groups: the first (respectively second) group
includes resources which calculated average cost is
higher (respectively lower) than the estimated cost.
The obtained two groups are displayed using a two-
column table. The second method consists in using
ML classification algorithms in order to find out
which factors influence transition cost values, and
how. To be able to apply different classification
algorithms and test their results, we considered to
use the Weka system. Thus, we implemented
operations generating ARFF files for the user-
selected transition. For our case, each generated
ARFF file consists of attributes values and classes as
presented in Section 4.2.2. Thus, the generated
ARFF file can be easily imported into the Weka
system which allows to pre-process the input data.
Then, the user selects the attributes to consider for
the ML classification algorithm. Next, Weka
provides several algorithms to use for extracting
knowledge in different forms such as classification
rules.
6 SOLUTION TEST
The test of the proposed solution is performed using
a simple phone repair process. Details about the
process example are available in (Thabet, A.
Ghannouchi and H. Ben Ghezala, 2014a; 2014b).
Once the PN model cost extension tool is launched,
the user imports the input files: the PN model
(PNML file) and the corresponding cost annotated
EL file (XES file). We selected PNML and XES
files of the simple phone repair process example.
Then, the cost extended PN is displayed on the main
tool frame (background frame of Figure 3). When
right clicking on a specific transition of the PN
model, two options are provided: cost data
description and cost data analysis.
The cost data description is performed using
user-customized table or graphics. The top left frame
in Figure 3 shows the cost data description table
related to the “Analyze Defect” transition. Cost data
description graphics show different views about the
incurred cost of each transition of the PN. The
Table 1: General architecture of the Petri Net model cost extension tool.
Inputs Tool Architecture (UML Component Diagram) Outputs
XES meta-model with cost
extension (.xesext)
Cost annotated EL (.xes)
Petri Net model (.pnml)
PNML core model (.rng)
Cost extended
Petri Net model
graphically displayed
Cost Description
Tables/Graphics
dis
p
la
y
e
d
Cost Analysis Tables
displayed
ARFF files generated
PetriNetModelCostExtensionbasedonProcessMining-CostDataDescriptionandAnalysis
273
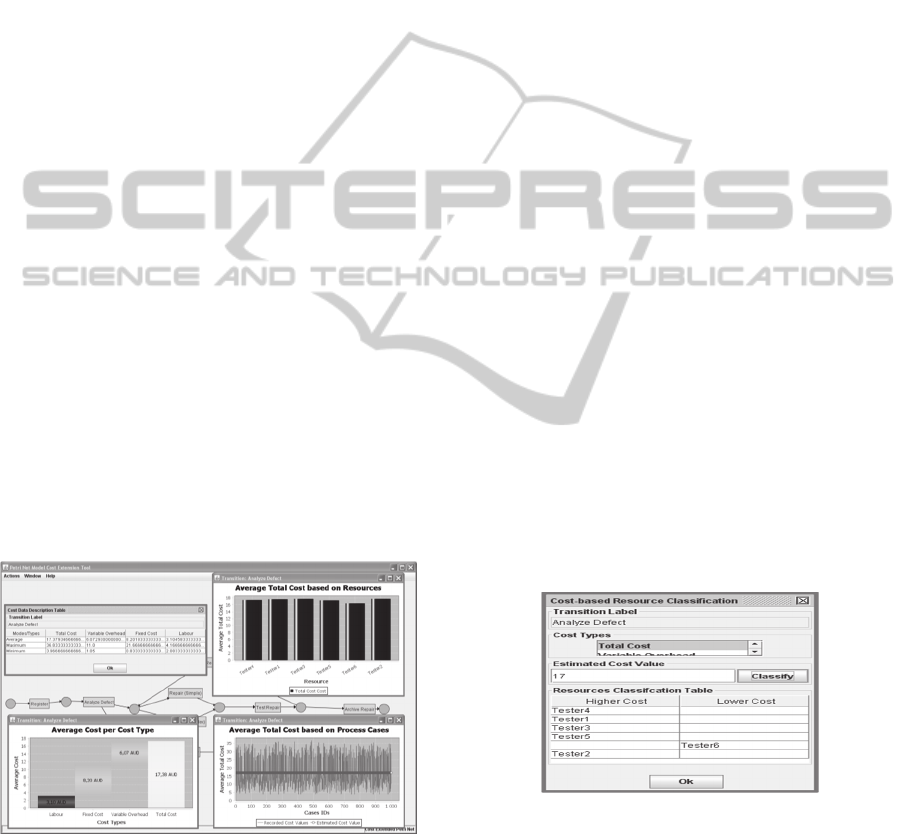
Cost/Cases view is illustrated by the bottom right
frame in Figure 3.
This view shows (1) a curve representing the
average total costs of the “Analyze Defect”
transition based on BP cases and (2) a line
representing the estimated cost provided by the user
(17 AUD). This graphic shows that the number of
cases having average costs higher than the user-
estimated cost value is important which indicates
that the execution of the transition incurs more costs
than estimated. The Cost/Resources view is
illustrated by the top right frame of Figure 3 which
shows bars each of which representing the average
of total costs related to “Analyze Defect” transition
instances executed by a resource. This graphic
shows that when the resource “Tester6” executes the
considered transition the total cost is at minimum.
The Cost/Cost Types view is illustrated by the
bottom left frame of Figure 3 which shows that the
total cost of the “Analyze Defect” transition is of
17,38 AUD and is distributed as follows: 3,10 AUD
(average labour cost), 8,20 AUD (average fixed
cost) and 6,07 AUD (average variable overhead).
This graphic indicates that fixed and variable
overhead costs represent the major part of the total
cost incurred by the considered transition execution.
The cost data analysis option can be performed
with two methods. The test of the first method is
illustrated by Figure 4 which shows that the average
total cost of “Analyze Defect” transition instances
executed by “Tester6” is lower than the estimated
cost value provided by the user (17 AUD). However,
the other resources are involved in incurring higher
total costs than the estimated one.
Figure 3: Displaying cost data description for the
“Analyze Defect” transition.
Taking into account the cost/resource graphical
view, this indicates that “Tester6” is the resource
that incurs (slightly) lower total cost than the other
ones, when executing “Analyze Defect” transition.
This may lead decision makers to a resource-based
solution to reduce the costs incurred by the
execution of “Analyze Defect” transition. We tested
the second method on the “Analyze Defect”
transition by selecting the total cost as a cost type
and 17 AUD as the estimated cost. Then, an ARFF
file is automatically generated according to details
presented in Section 5.4. Afterwards, the ARFF file
is imported using Weka system. After pre-
processing data by selecting the “resource”,
“duration”, “phone type” and “defect type” attributes
for the transition in hand, we applied different
classification algorithms among which we retained
the J48 algorithm (Witten, Eibe and Hall, 2011)
result as it provided the highest rate of correctly
classified instances (100%). The J48 extracts
knowledge in the form of decision trees. We present
the result in the form of classification rules:
If (phoneType = T1) Then
Cost is lower
If (phoneType = T2) Then
Cost is lower
If (phoneType = T3) Then
Cost is higher
The provided result shows that if the phone type
is T1 or T2, the incurred total cost of the “Analyze
Defect” transition is lower than the estimated cost
value. However, if the phone type is T3, the total
cost exceeds the estimated cost value. The
conclusion we can draw from the obtained result is
that if we assume that the estimated total cost value
of the transition “Analyze Defect” is 17 AUD, the
total cost incurred during the execution of this
transition depends on the “phone type” attribute. The
influence of the other attributes on the corresponding
total cost is not prominent.
Figure 4: Resource classification based on total cost of the
“Analyze Defect” transition.
This indicates to decision makers that reviewing the
repair of phones with type T3 is likely to lead to a
solution to reduce costs incurred by the execution of
“Analyze Defect” transition. The above presented
test case deals with the influence of “resource”,
“duration”, “defect type” and “phone type” attributes
on “Analyze Defect” transition cost.
ICEIS2015-17thInternationalConferenceonEnterpriseInformationSystems
274

7 CONCLUSION AND FUTURE
WORKS
In (Thabet, A. Ghannouchi and H. Ben Ghezala,
2014a; 2014b), we proposed a solution for PN cost
extension. In this paper, we carried out several
improvements of the proposed solution according to
talks with experts in MA and BPM. We improved
the proposed cost data structure in order to take into
account important cost-related concepts.
Furthermore, we extended the proposed solution
with cost data description and analysis. Cost data
description allows decision makers to get insight
about their BP from a cost point of view using tables
and graphics. Cost data analysis supports decision
makers to know which factors influence cost values
and how. This contributes to support making
decisions to reduce the incurred costs. Moreover, all
these improvements were implemented and tested
for the case of a simple phone repair process.
Currently, we are working on further
improvement of cost data analysis in order to
provide more accurate results for better decision
making support. This will be studied in conjunction
with different experts in order to validate the
proposed solution. Furthermore, we are studying the
generalization of the proposed approach to support
cost extension of any BP model (not only PNs).
Future works concern carrying out real world case
studies in order to evaluate the proposed solution.
REFERENCES
Briol, P., 2008. Ingénierie des Processus Métiers: de
l’élaboration à l’exploitation, Briol Patrice.
Han, J., Kamber M. and Pei, J., 2012. Data Mining:
Concepts and Techniques (3rd ed.), Elsevier. United
States of America.
Hansen, D.R. and Mowen, M.M., 2006. Cost
Management: Accounting and Control, Thomson
South-Western. United States of America.
Hillah, L.M., Kindler, E., Kordon, F. and Petrucci, L.,
2009. A primer on the Petri Net Markup Language and
ISO/IEC 15909-2*. In CPN’09, 10th International
workshop on Practical Use of Colored Petri Nets and
the CPN Tools. Denmark.
Hverbeek, 2012. Extensible Event Stream. (online)
Available at: <http://www.xes-standard.org>
(Accessed June 2013).
IEEE Task Force on Process Mining, 2012. Process
Mining Manifesto. In BPM 2011 Workshops. Springer.
LIP6 (Laboratoire d’Informatique de Paris 6), 2012.
PNML Framework download site. (online) Available
at: <http://pnml.lip6.fr> (Accessed July 2013).
LIP6 (Laboratoire d’Informatique de Paris 6), 2013.
PNML reference site. (online) Available at :
<http://www.pnml.org> (Accessed July 2013).
Nauta, W.E., 2011. Towards Cost-Awareness in Process
Mining. Master’s thesis. Eindhoven. (pdf) Available
at: <http://alexandria.tue.nl/extra1/afstversl/wsk-
i/nauta2011.pdf> (Accessed April 2012).
Process Mining Group, 2013. Process Mining: Research,
Tools and Application. (pdf) Available at:
<http://www.processmining.org> (Accessed June
2013).
Rozinat, A., 2010. Process mining: Conformance and
Extension, PhD Thesis, University Press Facilities.
Eindhoven.
Thabet, D., A. Ghannouchi, S. and H. Ben Ghezala, H.,
2014a. Towards Business Process Model Extension
with Cost Perspective based on Process Mining - Petri
Net Model Case. In ICEIS’14, 16th International
Conference on Enterprise Information Systems,
SciTePress. Portugal.
Thabet, D., A. Ghannouchi, S. and H. Ben Ghezala, H.,
2014b. Petri Net Model Extension with Cost
Perspective based on Process Mining. In ICMHIS’14,
9th International Colloquium of MHIS (Management
High Institute of Sousse). Tunisia.
van der Aalst, W.M.P., 2011. Process Mining: Discovery,
Conformance and Enhancement of Business
Processes, Springer-Verlag. Berlin.
van der Aalst, W.M.P., Schonenberg, M. and Song, M.,
2011. Time prediction based on process mining. (pdf)
Information Systems. Available at:
<http://wwwis.win.tue.nl/~wvdaalst/publications/p609
.pdf> (Accessed July 2014).
Weygandt, J.J., Kimmel, P.D. and Kieso, D.E., 2010.
Managerial Accounting Tools for Business Decision
Making, John Wiley & Sons Inc. United States of
America.
Witten, I.H., Eibe, F. and Hall, M. A., 2011. Data Mining:
Practical Machine Learning Tools and Techniques,
Elsevier. Burlington.
Wynn, M., 2012, Dr. Moe Thandar Kyaw Wynn’s
homepage. (online) Available at: <http://www.yawl
foundation.org/moe/index.html> (Accessed May
2012).
Wynn, M.T., Low, W.Z. and Nauta, W., 2013. A
Framework for Cost-Aware Process Management:
Generation of Accurate and Timely Management
Accounting Cost Reports. (pdf) Conferences in
Research and Practice in Information Technology.
Available at:
<http://crpit.com/confpapers/CRPITV143Wynn.pdf>
(Accessed July 2013).
Wynn, M.T., Low, W.Z., ter Hofstede, A.H.M. and Nauta,
W., 2014. A Framework for Cost-Aware Process
Management: Cost Reporting and Cost Prediction.
(pdf) Journal of Universal Computer Science.
Available at: <http://www.jucs.org/jucs_20_3/
a_framework_for_cost/jucs_20_03_0406_0430_wynn.
pdf> (Accessed July 2014).
PetriNetModelCostExtensionbasedonProcessMining-CostDataDescriptionandAnalysis
275
