
Using a Study to Assess User eXperience Evaluation Methods from
the Point of View of Users
Luis Rivero and Tayana Conte
USES Research Group, Instituto de Computação, Universidade Federal do Amazonas, Manaus, Brazil
Keywords: User eXperience, Evaluation Method, Empirical Study, Software Quality, Emotion.
Abstract: User eXperience (UX) refers to a holistic perspective and an enrichment of traditional quality models with
non-utilitarian concepts, such as fun, joy, pleasure or hedonic value. In order to evaluate UX, several
methods have been proposed that range from using questionnaires to employing biometrics to evaluate the
users’ emotions. However, few of these UX evaluation methods are comfortable or easy to use from the
point of view of users. This paper presents a study in which 10 users applied the Expressing Emotions and
Experiences (3E) and EmoCards methods. While 3E provides a template for reporting the experience, the
EmoCards provides a set of cards illustrating emotions as helping material. We have analyzed the features
that make it easy or difficult for users to employ these methods, the users’ preference and the number of
identified problems. Besides showing an application example of the methods to aid software practitioners in
future evaluations, we identified that the EmoCards allowed users to identify more problems, but 3E was
preferred do to its ease of use and freedom when describing an emotion and its causes.
1 INTRODUCTION
Traditionally, in Human Computer Interaction,
usability has been considered one of the main
attributes that represent quality in an instrumental,
task-oriented view of interactive products (Bargas-
Avila and Hornbæk, 2011). However, despite the
increasing attention that usability has received
(Fernandez et al., 2011), a new term, “User
eXperience” (UX), has emerged as an umbrella
phrase for new ways of understanding and studying
the quality in use of interactive products (Bargas-
Avila and Hornbæk, 2011). UX is defined as the
“person’s perceptions and responses that result from
the use and/or anticipated use of a product, system
or service” (ISO 9241, 2010).
Several UX evaluation methods have been
proposed to ensure that the development is on the
right track in terms of UX, or to assess if the final
product meets UX targets (Vermeeren et al., 2010).
Among the approaches that one can employ to
evaluate UX, Isbister et al. (2006) mention: (a) using
questionnaires administered after an experience,
which ask the user to rate his/her feelings about what
occurred; (b) analyzing videotaped sessions with
users, combining interpretation of think-aloud
commentary with deciphering of other cues of
emotion (smiling, gestures and the like) to develop
an impression of user’s affective reactions; and (c)
using biometrics, measuring galvanic skin response,
detecting small movements of the muscles of the
face or tracking pressure on the mouse.
According to Tähti and Niemelä (2006), it is
difficult to observe users and gauge their emotions
without affecting the UX. The use of certain
equipment (e.g. sensors) may make users feel
uncomfortable and restrict their natural movements
and actions. Also, Isbister et al. (2006) indicate that
the experience of the feedback giving should be
pleasant in and of itself, so users feel comfortable
when employing the evaluation method.
This paper describes how we applied two UX
evaluation methods: Expressing Emotions and
Experiences - 3E (Tähti and Niemelä, 2006) and
EmoCards (Desmet et al., 2001). We chose these
methods as they intend to make users feel
comfortable in order to reduce the effect of the
evaluation in their experience. Also, we have
analyzed the results of employing 3E and EmoCards
in terms of identified UX problems and the
perception of users on the employment of these
methods for the evaluation of interactive products.
By describing how to employ these UX evaluation
88
Rivero L. and Conte T..
Using a Study to Assess User eXperience Evaluation Methods from the Point of View of Users.
DOI: 10.5220/0005377300880095
In Proceedings of the 17th International Conference on Enterprise Information Systems (ICEIS-2015), pages 88-95
ISBN: 978-989-758-098-7
Copyright
c
2015 SCITEPRESS (Science and Technology Publications, Lda.)
methods, we intend to encourage the software
industry in applying them and improve the quality of
the developed applications. Furthermore, we have
identified improvement opportunities on the
evaluated methods to guide future research in the
evaluation of UX.
2 UX EVALUATION METHODS
UX evaluation methods can be employed to gauge
the product success in the real market and attract
potential customers (Yong, 2013). Below, we will
describe some of the UX evaluation methods
including their advantages and disadvantages.
The Self-Assessment Manikin (SAM) is a
picture-oriented method to directly assess the
pleasure, arousal, and dominance associated in
response to an object or event (Bradley and Lang,
1994). Furthermore, Mandryk et al. (2006) proposed
employing psychophysiological techniques to
measure the physiological response of the user to
different stimuli. Moreover, the Affective Diary
proposed by Ståhl et al. (2009) is a system that
records information on the user and his/her
emotions. Finally, the Visual Aesthetics Scale
(VAS) proposed by Lavie and Tractinsky (2004) is a
two-dimensional structure of perceived web site
aesthetics. Such scale measures: (a) the classical
aesthetics dimension, which measures traditional
notions of aesthetics (e.g. well organized, clear,
clean, others); and (b) the expressive aesthetics,
which measures the perceptions of the originality of
the site’s design.
Table 1 shows a brief analysis of the advantages
and disadvantages of the methods described above.
Mainly, methods that are cheap, quick and easy to be
applied by user, such as the SAM and VAS scales,
usually only provide indicators of the users’
emotions rather than the cause. Additionally, some
methods that manage to explain the reasons behind
the users’ emotions such as the Affective Diary, take
long to be applied and make users feel tired.
Moreover, although Psychophysiological
Techniques manage to objectively measure the
users’ responses, they fail to make users feel
comfortable due to the attached sensors. Also, the
necessary equipment to apply this method is very
expensive. These disadvantages show that there is a
need for further investigation on methods that
capture both the emotion and its context to explain
what aspects of the interaction affected the feelings
of the user (Tähti and Niemelä, 2006). Some
methods that can assist in the identification of UX
problems and their cause are the Expressing
Emotions and Experiences - 3E and EmoCards.
Table 1: Advantages and disadvantages of SAM,
Psychophysiological Techniques (PT), the Afective Diary
(AD), the Visual Aesthetics Scale (VAS), 3E and
EmoCards (EC).
SAM
PT
AD
VAS
3E
EC
Advantages
Helps users identify their
experiences
X X X
Quick and easy to use X X X X
Requires few resources X X X X
Gathers objective measures X
Disadvantages
It takes time to be applied X
Users have difficulty in
understanding the
represented emotions
X X
Does not explain the reason
for the emotion
X X
Expensive equipment X
Makes users feel
uncomfortable
X X
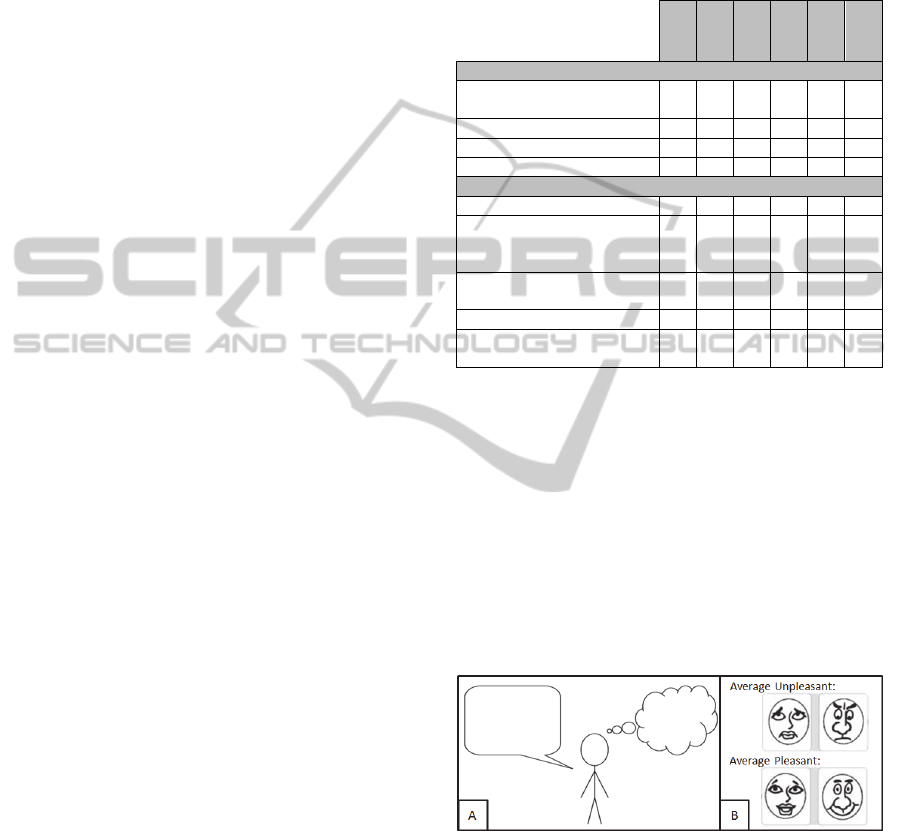
3E (Tähti and Niemelä, 2006) is a self-report
method, in which the user is provided with a simple
pictorial template for expressing emotions and
experiences, in the form of a sketched human body.
By employing 3E, users can draw a face to project
their emotional state, while writing in order to depict
inner thoughts. Moreover, the 16 emocards proposed
by Desmet et al. (2001) depict cartoon faces with
eight distinct emotional expressions (on the basis of
the ‘pleasantness’ and ‘arousal’). After a user select
an emocard, the evaluators explore what caused
him/her to choose it. Figure 1 shows both methods.
Figure 1: Part A - The 3E template (Tähti and Niemelä,
2006), and Part B - some EmoCards (Desmet et al., 2001).
As shown in Table 1, besides being cheap, 3E and
EmoCards allow gathering more profound
information than just the user’s feeling at the
moment of interaction (Tähti and Niemelä, 2006).
Moreover, users find expressing their emotions
using both 3E and EmoCards a pleasant task
(Desmet et al., 2001; Tähti and Niemelä, 2006).
UsingaStudytoAssessUsereXperienceEvaluationMethodsfromthePointofViewofUsers
89

According to Vermeeren et al. (2011), there is a
need for future research in analyzing the
practicability of UX evaluation methods. UX
evaluation methods need to be usefully employed in
product development and be easy to use both by
practitioners and users. Although 3E and Emocards
have been employed in the evaluation of the user
experience, identifying their benefits (Tähti and
Niemelä, 2006; Desmet et al., 2001), little
information is provided regarding the perception of
users on their application process, or improvement
opportunities. This paper proposes to do just that,
providing insights for future research and an
example of their applicability in the evaluation of a
real application under development.
3 EVALUATING 3E AND
EMOCARDS FROM THE
POINT OF VIEW OF USERS
3.1 Goal, Variables and Hypotheses
In this study we aimed at answering the following
research question: “What is the perception of users
regarding 3E and Emocards in terms of ease of use,
preference and overall experience?” Table 2 shows
the goal of this empirical study presented using the
Goal Question Metric (GQM) paradigm (Basili and
Rombach, 1988).
Table 2: Goal of the study applying the GQM paradigm.
Anal
y
ze
The 3E and EmoCards evaluation methods
For the
p
ur
p
ose o
f
Characterize.
With respect
to
The ease of use, number of identified
problems, and users’ opinion and preference
From the
p
oint of view
Of users and UX researchers.
In the context
o
f
A UX evaluation of the prototypes of a real
Web application under development.
We wanted to verify if users felt comfortable during
the employment of 3E and EmoCards when carrying
out a UX evaluation. Thus, the independent
variables of this study are: (a) applying the 3E and
EmoCards for evaluating UX and (b) the evaluated
Web application. Moreover, the dependent variables
that were considered to measure the users’
perception of the UX evaluation methods are: (a)
preference of the methods or, in other words, which
UX evaluation method the users would choose if
given the chance; (b) the users’ opinion on quality
factors of the evaluation methods (i.e. features that
make the method easy to use and make users feel
comfortable when employing it) (Vermeeren et al.,
2010); and (c) rate of UX problems found with each
method, which indicates how many UX problems
each method allowed researchers to identify in the
evaluated application.
To evaluate how users felt when applying 3E and
EmoCards, we have employed the Smileyometer
(Read and MacFarlane, 2006) which is a discrete
Likert type scale to apply a judgment score after an
experience (in this case, employing each method).
Our goal when applying the smileyometer is to have
an idea of how users rate their experience of
applying each of the UX methods. Also, to verify
other factors (such as difficulties, how easy it was to
employ the method, others), we have applied a
questionnaire asking for the subjects’ opinion
regarding 3E and EmoCards. Finally, to measure the
rate of UX problems found with each method, we
have counted the number of problems that each
method allowed the researchers to identify.
Using the indicators defined above, we planned
and conducted the study to test the following
hypotheses (null and alternative, respectively):
H
01
: There is no difference in terms of the
number of identified problems among the methods.
H
A1
: The number of identified problems
presents a difference among the methods.
H
02
: There is no difference in terms of the
Smileyometer score among the methods.
H
A2
: The Smileyometer score presents a
difference among the methods.
3.2 The Evaluated Web Application
“Similar Products” is a Web application that is
currently under development by Federal University
of Amazonas as part of a project on information
recovery. The main goal of the project is to assist
citizens when buying a product, so they can easily
find out which other similar products are available.
To do so, an information recovery method for
retrieving similar products was developed. In order
to evaluate the methods’ results in terms of accuracy
(how many of the retrieved products are actually
similar), the development team was also developing
the “Similar Products” Web application, which
would serve as an assistant for both showing the
retrieved products and allowing users to provide
feedback on the results. Interested readers can find
further information on the “Similar Products”
application in our report (Rivero and Conte, 2015).
We chose to evaluate the “Similar Products”
Web application since it was being developed for the
common user (people willing to buy a product and
interested in finding further products). Therefore, a
ICEIS2015-17thInternationalConferenceonEnterpriseInformationSystems
90

positive UX was strongly desired in order to
enhance its acceptance (Hassenzahl, 2005). Also, the
development team of “Similar Products” was
interested in improving the quality of the application
earlier in the development process, evaluating its
mockups (sketches of the user interface).
3.3 Participants, Materials, Procedure
and Data Collection
We carried out the study in 2014, with potential
users from the “Similar Products” Web application,
residing in the city of Manaus (Brazil). In order for a
person to participate in the study, (s)he was asked
questions regarding: (a) if (s)he regularly accessed
the internet; and (b) if (s)he bought or browsed
products there. All subjects who answered “Yes” to
these questions were asked to participate in the UX
evaluation. Overall, 10 people (4 male and 6 female)
meeting the selection criteria agreed to participate.
Also, they signed a consent form explaining the
main activities of the study and the confidentiality of
the results.
After agreeing to participate in the study and
signing the consent form, users were asked to enter a
lab room, where all equipment and materials
necessary for performing the UX evaluation were
prepared. Then, for each subject, a moderator
explained to him/her that (s)he would view a
proposal for the “Similar Products” application and
that the goal of the evaluation was not to evaluate
the user, but how (s)he felt when using the
application and identifying problems and
improvement opportunities. While experiencing the
application, the users performed tasks using a PDF
file which mapped the mockups. Such file contained
previously added links that had been created using
the Balsamiq Mockups tool (http://balsamiq.com/)
and allowed simulating interaction and navigation
between the mockups. The tasks were selected due
to their importance for achieving the main goal of
the “Similar Products” application: (a) search for a
specific product for which users wished to view
similar products, and (b) view similar products for a
selected product and rate their similarity.
After experiencing the “Similar Products”
application, the users would employ both UX
evaluation methods, 3E and EmoCards. We
highlight that the order in which these methods were
employed was randomly assigned, guaranteeing that
5 subjects employed 3E and then EmoCards (in that
order) and then 5 subjects employed EmoCards and
then 3E (in that order) to avoid bias. Finally, after
employing the methods to evaluate their experience,
the users were given a follow-up questionnaire
which contained the Smileyometer (Read and
MacFarlane, 2006) and open questions regarding
their opinion on the methods for evaluating UX.
Since there were no dropouts and all users filled
the characterization form and follow-up
questionnaires, none of the users’ data were
discarded. The authors of this paper acted as the
analysis team, checking the responses to the follow-
up questionnaires regarding: the users’ judgment
score after their experience with the UX evaluation
methods, their preference, and the answers to the
open questions regarding difficulties, how easy it
was to employ the UX evaluation method and
improvement opportunities. In the following section,
we describe our findings regarding 3E and
EmoCards from the point of view of users.
4 RESULTS AND DISCUSSION
4.1 Identified Problems using the UX
Evaluation Methods
The rich materials collected using EmoCards and 3E
were analyzed by our research team. The examples
presented in this paper have been selected as they
show how each UX evaluation method can support
the identification of causes for the expressed
emotions. To facilitate the identification of the users,
we will use the code UXX, where XX represents the
number of the user (ranging from 01 to 10).
Interested readers can find further examples and
information on the identified UX problems in our
technical report (Rivero and Conte, 2015).
Regarding the EmoCards results, most users felt
calmed and neutrally pleasant when using the
application. Also, some users had unpleasant
responses ranging from calm to average, while some
users felt pleasant ranging from calm to excited.
Finally, only one user felt excited with neutral
pleasantness. In this UX evaluation, we followed the
suggestions by Desmet et al. (2001) who employed
the EmoCards to help users express their emotional
responses. Thus, through an unstructured interview,
we asked users for the reasons for selecting a
specific card, and how it had affected their
experience. Below, we show an extract from the
interview with user U02, showing both positive and
negative aspects that influenced her experience:
- Interviewer: Which card would you choose to
represent what you felt while you were
experiencing the application?
UsingaStudytoAssessUsereXperienceEvaluationMethodsfromthePointofViewofUsers
91
- U02: Hum, I think this one. (U02 selects the
exciting/pleasant card)
- Interviewer: Why did you feel that way?
- U02: Well, because I felt very happy! I was
wondering: Will the system show me a table
comparing the products? And when it did, I was
surprised and happy (...)
- Interviewer: And is there any other card you
would chose to express what you felt?
- U02: I would also choose this one. (U02 selects
the calm/neutral card)
- Interviewer: How come?
- U02: Because I wasn’t able to perceive the
transitions in the system so easily. I got confused
because I didn’t know what I had to do next.
Regarding the results obtained from 3E, in
general, the users produced very communicative
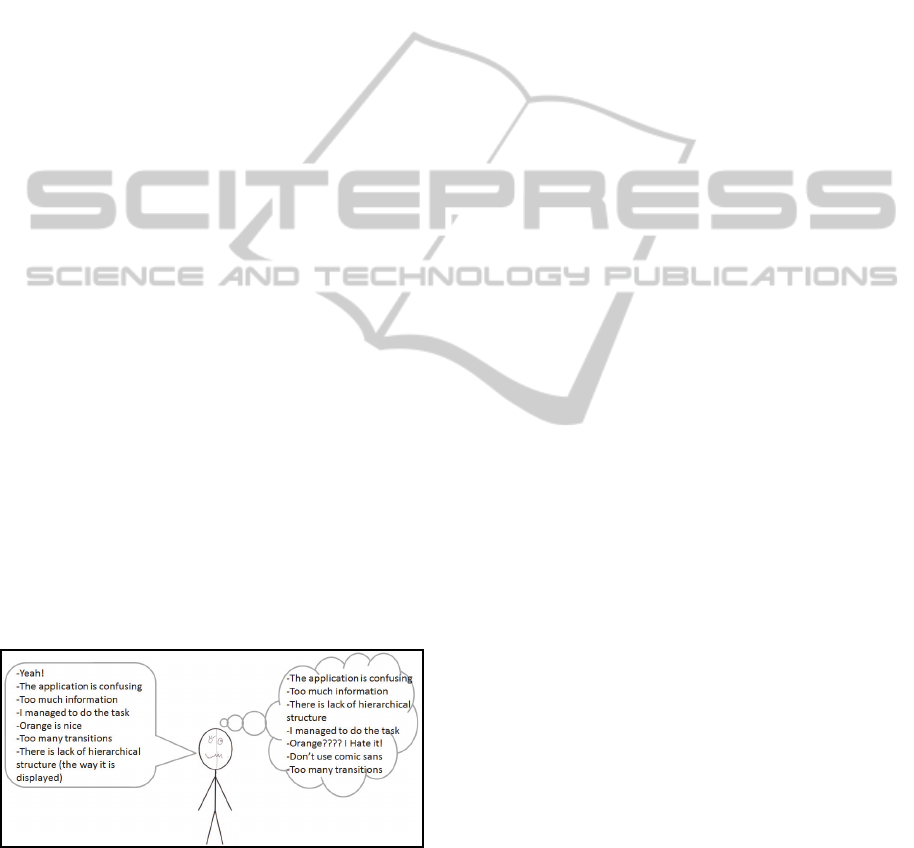
drawings and explanations. Figure 2 shows the 3E
template filled by user U09. We can see that user
U09 had mixed feelings about the application and
therefore, drew two faces at the same time: one
happy and surprised and another angry one. Also, in
the oral expression balloon the user indicated that:
(a) she felt confused, (b) the application had a lot of
disorganized information and (c) many steps were
required to perform the tasks. Similar information
was provided in the inner thoughts balloon.
However, there was a feature described by the user
that differed from what she really believed. In the
oral expression balloon, the user indicated that she
thought that the color orange was “nice”.
Nonetheless, when analyzing the inner thoughts
balloon, the user stated that she “hated orange”. One
possible explanation for this behavior is that users
might not feel comfortable revealing their real
opinions while being interviewed and that 3E could
be able to capture those inner thoughts.
Figure 2: A 3E template (translated from Portuguese)
filled by one of the users with mixed feelings.
Overall, we managed to identify 14 problems that
affected the overall experience of the users by
carrying out 10 UX evaluation sessions of about 30
minutes each (around 5 hours in total). The time
needed to evaluate the UX of the application would
have been shorter if we had not applied a follow-up
questionnaire on their perception of the employed
UX evaluation methods. In the following
subsections we refer to the number of identified
problems and the overall perception of the users
towards the methods to test our hypotheses.
4.2 Perception of Users on the Methods
4.2.1 Quantitative Analysis
In general, the EmoCards allowed finding more
problems than the 3E method. Three problems were
only found by employing 3E, five problems were
found by both methods and six problems were only
found by employing the EmoCards. Please, see our
technical report (Rivero and Conte, 2015) for a
detailed description of the identified UX problems.
When analyzing the results per user,
individually, a paired sample t-test (p = 0,520, α =
0,05) showed no statistical significance suggesting
that there is no difference in applying 3E or
EmoCards regarding the number of identified
problems. We employed this test as a Shapiro-Wilk
(Shapiro and Wilk, 1965) test (p > 0.05) indicated
that our sample was normally distributed for the
number of identified problems per method.
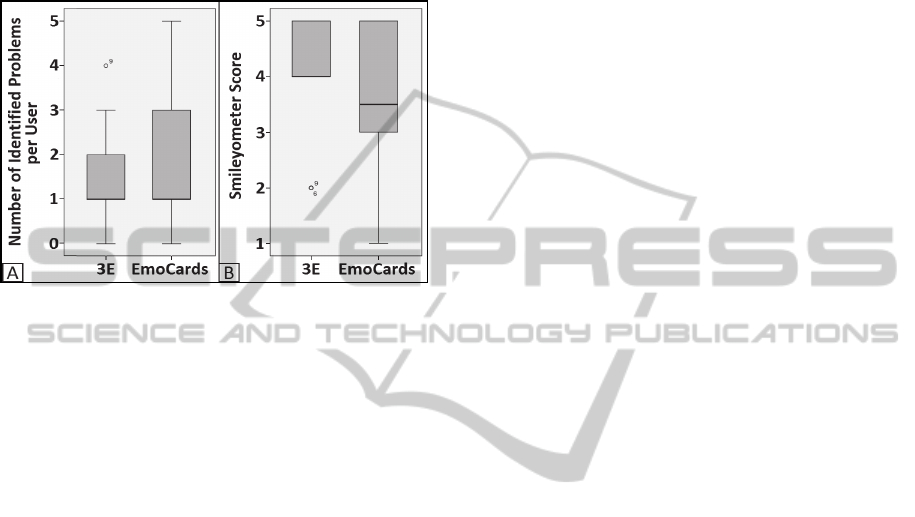
Figure 3 shows the boxplots graphs for each
method regarding the number of identified problems
per user (Part A) and the smileyometer scores per
user (Part B). Regarding the identified UX problems,
we can see that the median was of one problem in
both methods. However, users applying the
EmoCards reported more problems than when using
3E. A possible reason for this behavior is that the
cards acted as probes, encouraging the users to speak
about the UX problems. In Subsection 4.2.2, we will
describe the qualitative results supporting such idea.
In order to verify which method provided a more
positive evaluation experience, we have also
gathered data regarding the users’ preference. We
collected such data through the answer to the follow-
up questionnaire containing the Simleyometer (Read
and MacFarlane, 2006). We highlight that we chose
to apply questionnaires instead of interviews since
the latter can cause subjects to be shy and restrain
vital information. Note that the follow-up
questionnaire was applied after the users had tried
both methods (3E and EmoCards). The unstructured
interview shown in Subsection 4.1 refers to the
EmoCards evaluation, in which such interview is
part of the evaluation process itself as suggested by
Desmet et al. (2001). Thus, the follow-up
ICEIS2015-17thInternationalConferenceonEnterpriseInformationSystems
92
questionnaires were employed for gathering data
regarding the use of the UX evaluation methods, and
allowing subjects to express their feelings more
freely. Moreover, further information regarding what
influenced the subjects’ overall rating on the
methods was gathered through open questions (see
Subsection 4.2.2).
Figure 3: Boxplots graph for: (A) the number of problems
found by users for each of the methods, and (B) the
Smileyometer scores for each of the methods.
As mentioned before, we chose to apply the
smileyometer in order to compare the users’
perception towards the UX evaluation methods. Our
decision was based on the fact that the smileyometer
can be employed for judging different stimuli (in
this case, employing a UX method). In that context,
the smileyometer measured the users’ judgment in a
Likert type scale (Read and MacFarlane, 2006): (1)
Awful, (2) Not Very Good, (3) Good, (4) Really
Good, and (5) Brilliant. Thus, the maximum
judgment on a method is 5. In order to check if
differences between the smileyometer scores for
each method were significant, we carried out a
Wilcoxon statistical test (α = 0.05) and we created a
boxplot graph to facilitate visualization. This test is
equivalent to the paired sample t-test and it was
applied because a Shapiro-Wilk (Shapiro and Wilk,
1965) test (p < 0.05) indicated that our sample was
not normally distributed for the answers to the
smileyometer. The results from the Wilcoxon test
support the null hypothesis H
02
indicating that there
is no significant difference in the overall scores that
the users gave to each method (p = 0,670).
Figure 3 (Part B) shows the boxplots graph for
the smileyometer scores for each of the methods.
Although, the descriptive statistics showed that the
median score (4) for the 3E method was higher than
the median score (3,5) for the EmoCards method, in
general, users gave similar scores for both UX
evaluation methods, meaning that users enjoyed
applying both of them. However, when asked to
choose one of the methods 3E achieved higher
preference (6 out of 10). The explanation for such
result will we described in Subsection 4.2.2.
4.2.2 Qualitative Analysis
The follow-up questionnaires contained open
questions in order to verify: (a) which factors had
made it easy or difficult to apply the UX evaluation
methods; and (b) the reasons why some users
preferred one method over the other. Below, we
describe our findings regarding the users’ perception
on the UX evaluation methods.
The users gave both positive and negative
feedback regarding the 3E method for providing
affective information about using a system.
Comments regarding what made the 3E method easy
to use included:
“It was easy to describe (…) by writing.”
“(…) this method allows me to express myself,
describing what I am feeling and thinking. It also
allows me to draw.”
“Very nice, it uses graphs.”
“It is easy to draw my emotion.”
Some users also indicated difficulties in using
the 3E method. However, some of the difficulties
were contradictory to the features that made the
method easy to use. For instance, some users stated
that they liked drawing the faces, while others stated
that they found such feature difficult. Moreover,
some users indicated that the balloons were not that
easy to identify and that it was difficult to think of
what to write. This would suggest that perhaps 3E
might be more suitable for users who prefer a free
environment to describe their experience. Comments
on difficulties on using the 3E method included:
“It is very difficult to draw an expression.”
“It is not that easy to list what you are thinking. I
think it would be necessary to have an analytical
view of your thoughts (…)”
“It is difficult to differentiate the balloons.”
Regarding the use of the EmoCards method,
some users stated that it was easier to think of the
emotion as they had a predefined set of cards. Also,
it allowed them to think of what caused the emotion
and describe it. Some comments include:
“It has emotions from which you can choose.”
“It is easy (…) you just have to choose and talk.”
“It is easier to express yourself based on the
emotion.”
“It helps me define my emotions.”
When the users answered the questions regarding
UsingaStudytoAssessUsereXperienceEvaluationMethodsfromthePointofViewofUsers
93

the difficulties of using the EmoCards method, most
of them indicated that choosing the representative
emotion was the hardest thing to do. Comments on
difficulties on using the EmoCards included:
“It is difficult to choose the cards for each exact
situation.”
“Some faces are similar and it is difficult to find
one face that actually fits what I want to say.”
“It is not as simple to understand how the
method works.”
“The order of the faces was confusing (…)”
Finally, when asked about which method they
would choose, users who chose 3E indicated that
they felt freer in applying the method and that it
allowed providing a thorough explanation of why
they felt those emotions. On the other hand, the
users who chose EmoCards indicated that the
method was more dynamic and that it was much
more visually appealing than the 3E method. Also,
these users indicated that EmoCards would be more
objective, since they would be able to tell directly
what they wanted to say.
5 THREATS TO VALIDITY
The internal validity analyses if, in fact, the
treatment causes the results (Wohlin et al., 2000). In
this study we consider that the users’ experience can
be a threat if they were not part of the target
audience of the application. However, only users
who accessed the internet on a regular basis and
browsed or bought products online were selected.
Also, to avoid testing the application for just one
type of user, we invited both male and female users
ranging from ages 18 to 37.
According to Wohlin et al. (2000), the external
validity is concerned with the generalization of the
results. As for the first issue, regular people acting as
users, we can argue that since the application was
developed for users who bought or browsed products
on the internet, regular people could be a valid and
representative population to recruit from. Also,
although users did not actually experience the
application in a real search and comparison of
products, they did simulate their interaction with the
“Similar Products” Web application through a
navigable PDF created with the Balsamiq Mockups
tool, resembling the usage of a real application.
The conclusion validity is concerned with the
relationship between the treatment and the results
(Wohlin et al., 2000). In this study, we should
consider the statistical power. Although, the
descriptive statistics in Subsection 4.2.1 pointed out
that users preferred 3E over EmoCards, but the latter
allowed users to point out more problems; since the
number of users was low, the data extracted from
this study can only be considered indicators and not
conclusive. However, even with a small sample
used, the results from this study are relevant for
explaining the reasons why users preferred one of
the evaluated UX methods over the other.
Finally, the construct validity is concerned with
the relationship between the theory and the
observation (Wohlin et al., 2000). Thus, the criteria
applied to evaluate the users’ preference of the UX
methods can be considered a threat if not properly
chosen. Nonetheless, although the Smileyometer is
part of a UX evaluation method itself, it can be
employed to measure the overall judgment of an
experience (Read and MacFarlane, 2006). By
employing the smileyometer, we did not intend to
provide a complete judgment of all the aspects of the
compared UX evaluation methods, but an idea of the
users’ opinion regarding their experience when
applying them. Also, the analyzed reported users’
difficulties and ease of use when applying the UX
evaluation methods are important features to be
considered in order to provide a better understanding
of the contexts in which they would be suitable
(Vermeeren et al., 2010; Tähti and Niemelä, 2006).
6 CONCLUSIONS
We compared two UX evaluation methods in terms
of the number of identified problems and preference
from the point of view of users. Our results showed
that users managed to point out more problems when
applying the EmoCards. However, a combination of
both methods is strongly suggested, as each one of
them has its strengths. For instance, the 3E method
was more suitable for users who preferred freedom
when reporting their experience. Nonetheless, users
who employed EmoCards felt more encouraged to
report UX problems (portrayed by the cards). Also,
by having predefined answers, users were able to
think more easily of the different aspects of the
application that affected their experience. This was
not possible with the 3E method, since users were
trying to report their experience on their own. On the
other hand, the 3E method could be able to capture
opinions that users might hide from the evaluators,
or mixed feelings about the evaluated software.
When comparing these methods to the ones
presented in Section 2, we can see that the main
advantage is that both 3E and EmoCards allow
ICEIS2015-17thInternationalConferenceonEnterpriseInformationSystems
94

capturing both problems and their causes, while
being as cheap, easy to use and quick as SAM and
the Visual Aesthetics Scale. Furthermore, these
methods allow users to reflect on their experiences
without getting them tired as the Affective Diary.
Finally, although 3E and EmoCards are enjoyable,
they do not allow gathering objective measures the
same way as Psychophysiological Techniques.
Among the improvement opportunities, the users
suggested providing predefined faces that they could
paste over the human body of the 3E template to
express their emotions. Also, they suggested
providing descriptions of the balloons in the
template itself, so they would not forget what to
write on them. Moreover, regarding the EmoCards,
users suggested arranging the cards in a sequence or
subgroups to facilitate the choosing process. Finally,
other users suggested improving the cards’ faces by
making them less exaggerated.
As future work, we intend to repeat this study,
however increasing the number of users to improve
its conclusion validity and gather further data on
features that make users prefer one method over the
other. We hope that our findings provide
practitioners with an example on how to apply UX
evaluation methods in the development process
lifecycle, and researchers with improvement ideas
for future research in the evaluation of UX.
ACKNOWLEDGEMENTS
We thank the scholarship granted by CNPq to the
first author of this paper. Also, we thank the
financial support granted by CAPES process AEX
10932/14-3 and FAPEAM through processes nº:
062.00600/2014; 062.00578/2014; and 01135/2011.
REFERENCES
Bargas-Avila, J., Hornbæk, K.: “Old wine in new bottles
or novel challenges: a critical analysis of empirical
studies of user experience”. Proc. SIGCHI Conference
on Human Factors in Computing Systems, 2011.
Basili, V., Rombach, H.: “The tame project: towards
improvement-oriented software environments”. IEEE
Transactions on Software Engineering, vol. 14, 1988.
Bradley, M. Lang, P.: “Measuring emotion: the self-
assessment manikin and the semantic differential”.
Journal of behavior therapy and experimental
psychiatry, 25(1), 1994.
Desmet, P., Overbeeke, K., Tax, S.: “Designing Products
with Added Emotional Value: Development and
Application of an Approach for Research Through
Design”. The design journal, 4(1), 2001.
Fernandez, A., Insfran, E., Abrahão, S.: “Usability
evaluation methods for the web: A systematic
mapping study”. Information and Software
Technology, 53(8), 2011.
Hassenzahl, M.: “The thing and I: understanding the
relationship between user and product”. In Funology,
Springer Netherlands, 2005.
Isbister, K., Höök, K., Sharp, M., Laaksolahti, J.: “The
sensual evaluation instrument: developing an affective
evaluation tool”. In Proc. of the SIGCHI conference
on Human Factors in computing systems, 2006.
ISO DIS 9241-210:2010.: “Ergonomics of human system
interaction - Part 210: Human-centered design for
interactive systems”. International Standardization
Organization (ISO), 2010.
Lavie, T., Tractinsky, N.: “Assessing dimensions of
perceived visual aesthetics of web sites”. International
journal of human-computer studies, 60(3), 2004.
Mandryk, R., Inkpen, K., Calvert, T.: “Using
psychophysiological techniques to measure user
experience with entertainment technologies”. Journal
of Behaviour & Information Technology, 25(2), 2006.
Read, J., MacFarlane, S.: “Using the fun toolkit and other
survey methods to gather opinions in child computer
interaction”. In Proc. of the 2006 conference on
Interaction design and children, 2006.
Rivero, L., Conte, T.: “Employment of 3E and EmoCards
in the Evaluation of a Web Application” Technical
Report USES TR-USES-2015-0002, 2015. Available
at: http://uses.icomp.ufam.edu.br/index. php/ publica-
coes#5-relat%C3%B3rios-t%C3%A9cnicos.
Shapiro, S., Wilk, M.: “An analysis of variance test for
normality (complete samples).” Biometrika, 1965.
Ståhl, A., Höök, K., Svensson, M., Taylor, A., Combetto,
M.: “Experiencing the affective diary”. Personal and
Ubiquitous Computing, 13(5), 2009.
Tähti, M., Niemelä, M.: “3E–expressing emotions and
experiences”. WP9 Workshop on Innovative
Approaches for Evaluating Affective Systems, 2006.
Vermeeren, A., Law, E., Roto, V., Obrist, M., Hoonhout,
J., Väänänen-Vainio-Mattila, K.: “User experience
evaluation methods: current state and development
needs”. In Proceedings of the 6th Nordic Conference
on Human-Computer Interaction
, 2010.
Wohlin, C., Runeson, P., Host, M., Ohlsson, M., Regnell
B., Wessl, A.: “Experimentation in software
engineering: an introduction,” (Book), Kluwer
Academic Publishers, 2000.
Yong, L.: “User experience evaluation methods for mobile
devices”. In Proc. of the III International Conference
on Innovative Computing Technology, 2013.
UsingaStudytoAssessUsereXperienceEvaluationMethodsfromthePointofViewofUsers
95
