
Managing and 3D Visualization of Real-time Big Geo-referenced Data
from Las Palmas Port through a Flexible Open Source Computer
Architecture
Jos
´
e P. Su
´
arez
1
, Agust
´
ın Trujillo
2
, Conrado Dom
´
ınguez
3
, Jos
´
e M. Santana
2
and Pablo Fern
´
andez
1
1
Division of Mathematics, Graphics and Computation (MAGiC), IUMA, Information and Communication Systems,
University of Las Palmas de Gran Canaria, Canary Islands, Spain
2
Imaging Technology Center (CTIM), University of Las Palmas de Gran Canaria, Canary Islands, Spain
3
Direcci
´
on de Pol
´
ıtica Inform
´
atica, University of Las Palmas de Gran Canaria, Canary Islands, Spain
{josepablo.suarez, atrujillo, gerente, josemiguel.santana, pablo.fernandez}@ulpgc.es
Keywords:
GIS, Port, SmartPort, FI-WARE, Glob3 Mobile, 3D Visualization, Big Data, Geo-referenced Data.
Abstract:
Nowadays, new technologies assist the capture and analysis of data for all kinds of organizations. A good
example of this trend are the seaports that generate data regarding the management of marine traffic and other
elements, as well as environmental conditions given by meteorological sensors and buoys. However, this
enormous amount of data, also known as “Big Data”, is useless without a proper system to visualize and
organize them. Governments are fully aware of this and promote the creation of visualization and control
systems that are useful to port authorities. In the line of management systems based on GIS, the SmartPort
project has been developed. SmartPort offers a rich-internet application that allows the user to visualize and
manage the different sources of information of a port environment. The “Big Data” management is based on
the FI-WARE tools and architecture, as well as “The Internet of Things” solutions for the data acquisition. At
the same time, the Glob3 Mobile SDK for the development of map apps will support the 3D visualization of
the port’s scenery and its data sources.
1 INTRODUCTION
A port is an environment that combines natural
and human elements, that is extremely complex
and dynamic and of great economic and social
importance for coastal areas. Numerous activities
of diverse nature take place in it, such as goods
and travellers transportation or fishing as well as
maintenance operations, rescue and protection of the
natural surroundings.
The port authority is the body entrusted with
the decision-making within the boundaries of the
port, regarding all its activities and available
resources. Therefore, it is of vital importance
for this organization to have a system that allows
the management, visualization and analysis of the
elements present at the port just like all the natural
ambient factors. Other examples of this kind of
visualization platforms can be found, for instance,
in other papers like (Georgas and Blumberg, 2010),
regarding the data analysis of New York’s Harbor
and the environmental control of the Gdansk seaport
conducted by (Kaminski et al., 2009). There are also
books in the bibliography about this specific subject
such as (Claramunt et al., 2007) which lists several
related projects and (Wright and Yoon, 2007) that
presents a survey of many data types and their specific
treatments.
In a general way, there are numerous sources
of available data within a port area. They can
be subdivided into two groups, depending on their
nature. Human made resources and port activities.
This group includes all the human elements within
the port. These elements are important for the port
authority that has to manage them and for the users of
the port that could make use of them.
• Port infrastructure, buildings and maritime
signals.
• Vessel’s activities and positions. Routes and
schedules.
• Available piers.
• Transported goods and passengers.
• Nearby locations of interest: Transportations,
hospitals. . .
72
P. Suárez J., Trujillo A., Domínguez C., M. Santana J. and Fernández P..
Managing and 3D Visualization of Real-time Big Geo-referenced Data from Las Palmas Port through a Flexible Open Source Computer Architecture.
DOI: 10.5220/0005371700720082
In Proceedings of the 1st International Conference on Geographical Information Systems Theory, Applications and Management (GISTAM-2015), pages
72-82
ISBN: 978-989-758-099-4
Copyright
c
2015 SCITEPRESS (Science and Technology Publications, Lda.)

• Possible oil/trash spills.
• Emergency management assets.
• Road traffic within the seaport.
Natural environment. This second group includes
both static and dynamic parameters of the natural
surroundings.
• Surrounding topography and model of terrain.
• Bathymetric model and composition of the
seabed.
• Water levels and tides.
• Ocean currents.
• Water salinity.
• Wave movements. Direction, frequency and
height.
• Marine biosphere (presence of fish, cetaceans,
seaweed...).
• Protected natural spaces.
• Meteorological measurements.
Personnel and rest of users will report the human
activity, as well as vessel’s sensors gather it. However,
the natural data could be recorded in many ways as
direct observation, field studies and mainly through
sensors located on the port’s surroundings.
The amount and variety of the recollected data
makes necessary the use of “Big Data” techniques.
“Big Data” is a quite new concept that involves
the analysis of an organization data to leverage its
intrinsic knowledge. This data should respond to
the comprehensive definition given by the categories
Volume, Velocity and Variety. Due to its scalable
nature as well as the variety of its data sources, the
SmartPort project fulfils the requirements to belong to
this field. Regarding support systems for “Big Data”
analysis other works on the area (Zhang et al., 2012)
can be of great interest. In particular, the visualization
of environmental data extracted of maritime areas
has been the target of other studies (McCann, 2004)
as there are many tools used in the bibliography
(Talukder and Panangadan, 2009).
There are likewise a great number of possible
roles for the users of the proposed application, such
as sailors, port authorities, emergency management
personnel, search and rescue teams, coastal engineers,
or coastal scientists and oceanographers. For
instance, sailors could be interested in tides, currents
and maximum ship drafts while fisherman could need
to know zones where fishing is allowed. The changing
needs of any particular user make essential that an
integral solution should be customizable.
The present project is named SmartPort and
develops a visualization and management system for
the data of Las Palmas de Gran Canaria’s Port.
This seaport, also known as “Puerto de la Luz”, is
one of the main ports of Spain and the first of the
geographical area of West Africa. With more than
16 km. of docks this port serves as the crossroads
between Europe, Africa and America.
The main idea is to display the current state of
all the sensors available on the port’s surroundings
(nowcast) as well as their historical evolution. In
addition, the system will show the geographical
location of all the resources available to the port
authority and the rest of users of the port and the
routes of the nearby ships. Finally, SmartPort will
support control tasks, through an alert management
that monitors the value of many sensors.
Therefore, the first fundamental pillar of this
project is the Future Internet platform of the European
Community (FI-WARE) architecture (FI-WARE,
2014), a platform that allows the validation of new
concepts, technologies, business models, applications
and IF services in big scale. The University
of Las Palmas de Gran Canaria as a partner of
the FI-WARE project has the goal of developing
innovative projects using this new technology. This
platform belongs to the Program Future Internet
Public Private Partnership (FI- PPP), which is a
program of public-private cooperation in the field of
Future Internet technologies funded by the European
Commission involving more than 152 European
companies and organizations (Villase
˜
nor and Estrada,
2014).
The other pillar of SmartPort is the Glob3 Mobile
virtual globe viewer developed by the IGO Software
Company and the University of Las Palmas de Gran
Canaria (Trujillo et al., 2013). This viewer provides
all the drawing functionalities that our web user
interface requires.
The main goal of this paper is not only to give an
overview of the whole SmartPort project, but instead
to be a guide for the development of any similar
management system. We start with the functional
requirements and data acquisition system established
by the port authority of Las Palmas de Gran Canaria.
From there, we outline the more relevant features
and main modules of what we consider is a seaport
management system that can be extrapolated to most
seaport cases.
Section 2 of the present document explains
the architecture and individual components of the
SmartPort’s back-end. Section 3 is an introduction
to the User Interface and the project’s front-end,
specially the 3D viewer of the port. Finally, Section 4
state the achievements and final remarks of the project
as well as some approaches to future work.
Managingand3DVisualizationofReal-timeBigGeo-referencedDatafromLasPalmasPortthroughaFlexibleOpen
SourceComputerArchitecture
73

2 MANAGING REAL TIME
GEO-BIG DATA THROUGH A
OPEN SOURCE FLEXIBLE
COMPUTER ARCHITECTURE
The SmartPort project was defined by a collaboration
agreement between Las Palmas de Gran Canaria
University and the port authority of Gran Canaria’s
Puerto de la Luz (Spain).
At that time, it was needed to gather data
generated from physical sensors installed in the
infrastructure of the Gran Canaria, Fuerteventura and
Lanzarote seaports. The port sensors are connected to
the Internet, a concept known as the Internet of Things
(IoT). There are two types of sensors: the sea gauges
and the meteorological stations, which generate big
volumes of data.
Initial requirements focused on:
• Collecting the generated data.
• Analysing and processing the measurements.
• Visualize these data in a three-dimensional
geospatial environment.
Apart from visualizing data geographically, a set
of requirements was established. Some of those
requirements were the visualization of the vessel’s
arrivals and departures and the alert management,
which provides the possibility to create warnings
when any sensor’s measurements reach a determined
value.
As a result of these requirements, SmartPort was
developed. It is intended to be a web application,
which back-end is implemented with FI-WARE, a
group of back-end solutions.
The FI-WARE platform is based on utility
modules, also known as Generic Enablers, that
provide solutions of ‘Big Data’ analysis among
others. The available data will be recollected and
processed using ‘Big Data’ technologies, such as
Hadoop. The data will be aggregated over time
for their use in visualizations offered by the web
front-end. This user interface will be based on a
virtual globe, named Glob3 Mobile, displaying the
seaport surroundings. All the data sources and other
elements of importance will be placed within this 3D
scene. The use of 3D on a web application makes this
front-end a real Rich-Internet-Application (RIA) as
some other examples on the bibliography (Kim et al.,
2012).
2.1 Data Context
Starting with the data captured from the sensors,
the Gran Canaria’s Puerto de la Luz port authority
allowed us to access to its database, where the latest
values of the sensors can be read. The sensor’s
average update time is ten minutes.
Currently the Gran Canaria’s Puerto de la Luz port
provides the following data from Aandela Instruments
series 3791-3798 series water level sensor and
Geonica Datamar 2000C radar 26GHz sea level
mareographmeter:
1. Significant wave height spectral moment of order
zero. (meters)
2. Average height of the highest third of waves
(meters)
3. Average height of 10% of maximum wave
(meters)
4. Maximum wave height (seconds)
5. Average period of all waves (seconds)
6. Peak wave period (seconds)
7. Average pitch period by the upward zero
(seconds)
8. Mean direction at the peak wave direction
(clockwise arc degres)
9. Scattering of wave direction at peak power
(clockwise arc degrees)
10. Average direction from which the waves
(clockwise arc degrees)
11. Directionality index (custom indicator)
12. Pressure of the water column above the sensor
AWAC (decibars)
13. Orbital speed about AWAC sensor surface (meters
per second)
14. Current direction on AWAC surface sensor
(clockwise arc degrees)
15. Energy density spectrum for time series (spectral
band)
The seaport also has meteorological sensors such
as Geonica 41001 for temperature and air humidity,
Geonica 05106 for wind speed and Geonica 52203
for rain gauge.
Once the sensors read the latest values, they
are sent to the Orion Context Broker. Orion is
an implementation of the Publish/Subscribe Context
Broker GE, providing the NGSI9 and NGSI10
interfaces. Using these interfaces, clients can do
several operations:
• Registering context producer applications, e.g. a
temperature sensor within a room.
• Updating context information, e.g. send updates
of temperature.
GISTAM2015-1stInternationalConferenceonGeographicalInformationSystemsTheory,ApplicationsandManagement
74
• Being notified when changes on context
information take place (e.g. the temperature
has changed) or with a given frequency (e.g. get
the temperature each minute).
• Querying context information. The Orion Context
Broker stores context information updated from
applications, so queries are resolved based on that
information.
Several Python scripts were set up to perform
these operations. They take advantage of the
Requests library, to simplify the HTTP (Hypertext
Transfer Protocol) transactions. Thanks to this utility
SmartPort is able to get a real time visualization of the
port’s situation.
Once data were available, it was developed a web
application which shows the geo-referenced sensors
in a three dimensional map.
It is important to mention that, in order to
give the application a dynamic interaction with the
data sources, the communication between client and
server was developed making use of AJAX web
techniques (Asynchronous JavaScript And XML).
Thus, the front-end development was basically done
in JavaScript.
Due to certain application components are
available as “iframes” and they have the necessity
to exchange information between them, an API
(Application Programming Interface) that allows easy
messaging exchange between “iframes” was created.
In order to find an agile development, instead of
making direct requests to the Publish/Subscribe Orion
architecture, an abstraction layer has been created to
access the sensors information by GET requests to
our servers. This intermediate layer enables us to
preprocess the data so it can be sent in a friendlier
and more compact format. In addition, they also help
developers to withdraw from specific Orion aspects.
For instance, to get all the vessels data this query
is generated:
http://<<IP>>:<<Port>>/orion/query.html?
sensorType=ship&sensorID=.&pattern=true
Another example is to get the meteorological sensors
temperature with id 2001:
http://<<IP>>:<<Port>>/orion/query.html?
sensorType=meteo&sensorID=2001
&attributes=[temperature]
Another advantage of this new abstraction layer is the
potential to take more restricted user control, making
use of sessions and avoiding the well known stateless
of the REST (Representational State Transfer) API’s.
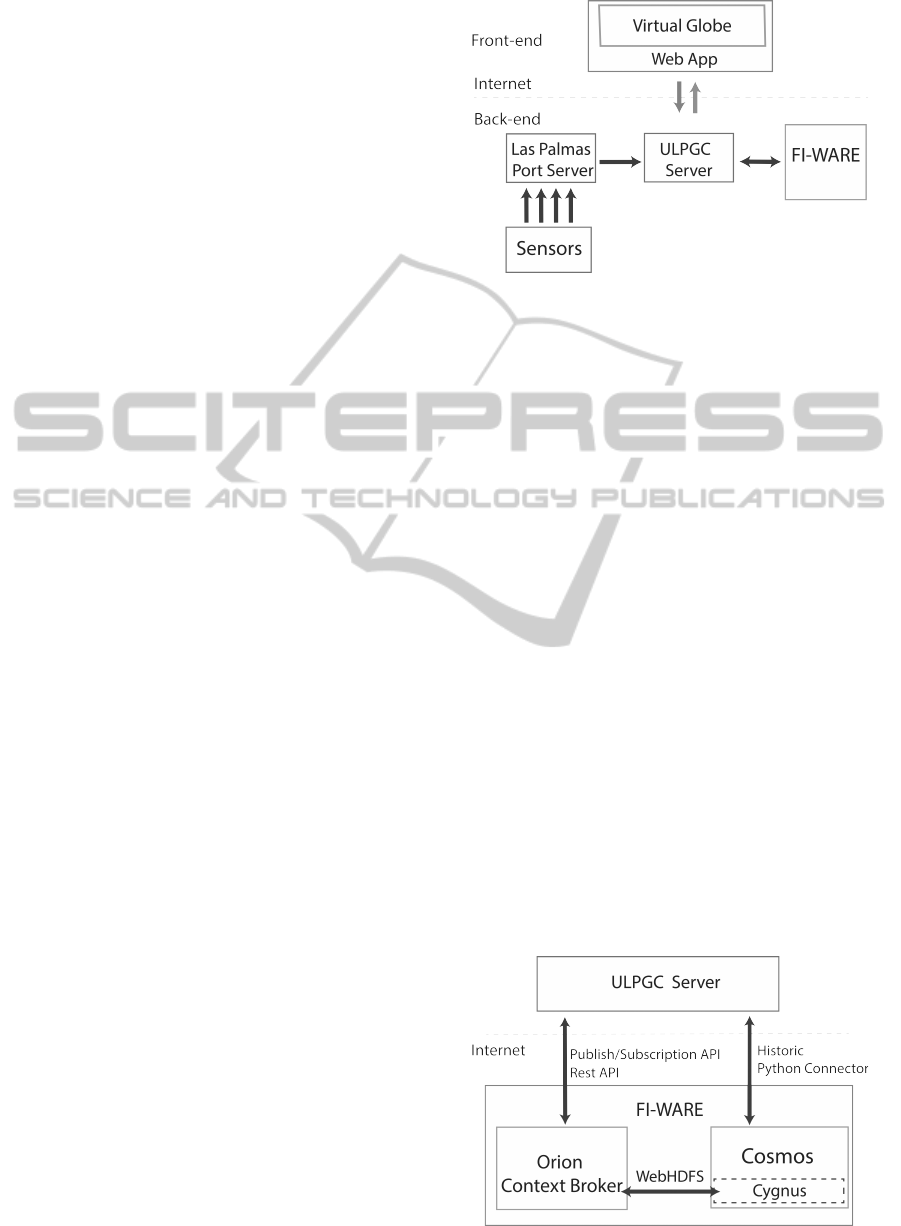
The architecture proposed for managing the
recollection of the data is shown in Figure 1.
Figure 1: General architecture proposed.
2.2 Analysis of Big Data in SmartPort
The next request functionality to be undertaken was
the possibility to display the time evolution of the
sensors data and even make an analysis on a given
dataset.
For this purpose, it was decided to make use
of the Big Data Analysis Cosmos. Cosmos is an
implementation of the Big Data GE, allowing the
deployment of private computing clusters based on
Hadoop ecosystem. Current version of Cosmos
allows users to:
• I/O operations regarding Infinity, a persistent
storage cluster based on Hadoop Distributed File
System (HDFS).
• Creation, usage and deletion of private computing
clusters based on MapReduce and SQL-like
querying systems such as Hive or Pig.
• Manage the platform, in many aspects such as
services, users, clusters, etc, from the Cosmos
API or the Cosmos CLI.
There is also a component called Cygnus in charge
of receiving context data from Orion (Context Broker
GE implementation) and storing it in a HDFS. This
can be seen in Figure 2.
Figure 2: Proposed general architecture.
Managingand3DVisualizationofReal-timeBigGeo-referencedDatafromLasPalmasPortthroughaFlexibleOpen
SourceComputerArchitecture
75
Firstly, Orion needed to be connected with
Cosmos by Cygnus, that creates the connection with
Cosmos and manages the data queue to be stored.
At this point, the historical data has not been yet
stored. Orion works with a MongoDB database. For
this reason, uploading all the data in chronological
order to Orion and relying on Cygnus for sending the
data to Cosmos, showed a poor performance.
The solution that was implemented consists in
adding data to Cosmos using the WebHDFS API.
In the application front-end, for security reasons,
the Cosmos instance was only accessible from some
machines. For this cause, making requests directly
from the client was dismissed. Thus, another
abstraction layer was necessary.
The technologies and techniques used to process
and store the data allow to achieve high data
availability and ensure that the whole system is
scalable. However, some technologies like Hive or
Hadoop imply a performance trade off, as seen in
Table 1. The proposed architecture minimizes the
impact of these modules by integrating intermediate
layers. This way the data transactions achieve the
speed that the interactive user interface demands.
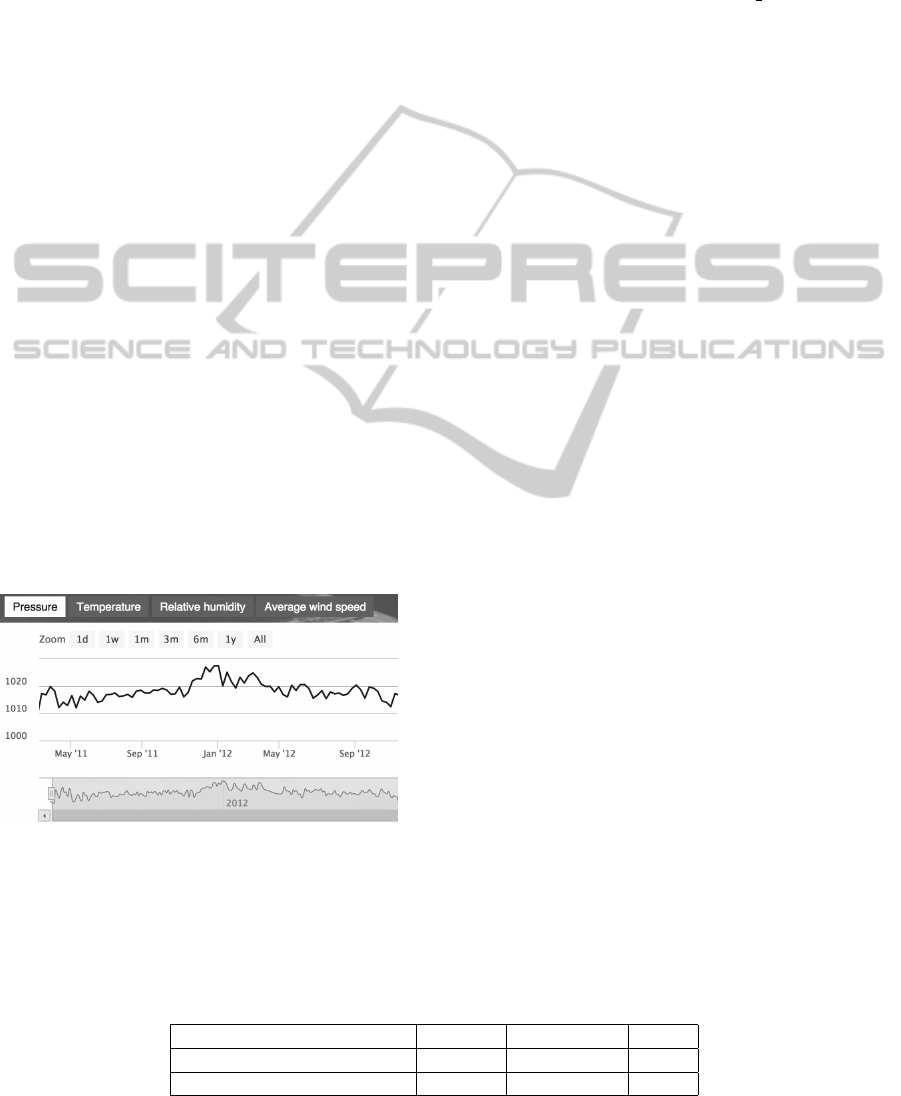
For the time series visualization, there is a wide
range of web technologies and components available.
It was decided to make use of the Highcharts
library, developed by Highsoft AS, which covered our
necessities. Specifically, the component stockCharts,
seen in Figure 3, was used since these charts
are perfectly adapted to our timing representation
necessities.
Figure 3: Historic chart showing pressure evolution over
time.
It has been developed a set of intermediate
layers that improve the performance of data analysis
and retrieving. This enhancement allows creating
on-the-fly sets of charts to show our historical data.
These charts will be split into tabs showing all the
data gathered by a specific sensor. A final business
layer implements the logic that decides the sensor to
be shown according to messages of other modules.
The requests are made by a Python connector that
sends HIVE requests, using the hive utils library, in
a server with access to the Cosmos global instance.
Once this connector is enabled, the requests are
analogous to the ones that would be made to a
MySQL database. From the front-end’s point of view,
the request is reduced to ask for a specific sensors
data. An example is the following request that asks
for all meteorological sensor data with id 2001.
http://<<IP>>:<<Port>>/historic.html?
sensorType=meteo&sensorID=2001
The data are provided in a JSON format
(Javascript Object Notation). This format is almost
ready to be used by the charts present in the front-end.
2.3 Enabling Data Alert Notifications
In addition, due to the huge volume of data to
be considered, a system of alerts is a desirable
functionality. This system must inform the user than
certain values have reached given thresholds. For
example, the emergency management system could
use these alerts to take quick decisions on reliable and
up-to-date data.
The Orion’s API Pub/Sub covered all the needed
functionalities to implement this system. A
subscription for each sensor to be watched is created.
Thus, whenever an alert is created, it is checked if a
subscription to that sensor attribute already exists and
it is made if needed. On the other hand, every alert
with its activation conditions is stored in a database.
Finally, there is a service that receives the Cosmos
subscriptions notifications. The front-ends shows a
relation of the current alerts and gives the possibility
to activate or deactivate them, as seen in Figure 4.
In the next section, it is described how all this
data extracted from the seaport is displayed in 3D.
With this purpose, the Glob3 Mobile map application
platform allows us to create an interactive seaport
scene, providing a rich and inmersive experience to
the final user.
Table 1: Costs of a single record retrieval in microseconds.
Time (µs) MySQL PostgreSQL Hive
All meteorological data 3,03 4,99 59,51
One attribute sorted by date 1,55 2,53 74,83
GISTAM2015-1stInternationalConferenceonGeographicalInformationSystemsTheory,ApplicationsandManagement
76
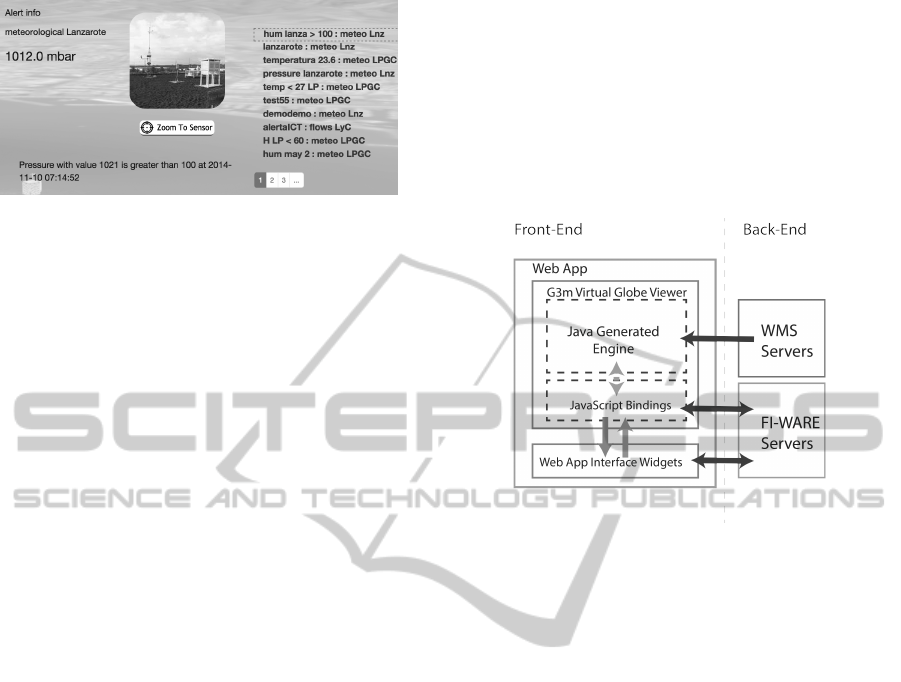
Figure 4: Notifications and alert center showed when data
reaches a prescribed margin.
3 VISUALIZATION OF
GEOREFERENCED DATA
Modern web technologies allow us to develop rich 3D
environments to display our georeferenced data.
Since the SmartPort Project was defined it was
clear that the front-end of the application needs a
viewer for the available georeferenced data. In a
resource management system like SmartPort, it is
important for the final user to spatially locate the
existing items and data sources. This makes the
application much easier for users that already know
the port, and richer in content for those who don’t.
Thus, the main element of the user interface is
a virtual globe viewer. This element displays a 3D
scene that represents the natural environment and the
human-made resources of the port area. Within this
scene, the application will locate three-dimensional
and two-dimensional representations of the elements
of interest.
The Glob3 Mobile framework (Pedriza et al.,
2012), also known as G3m, was chosen to develop
our virtual globe viewer, as it provides all the features
demanded by the SmartPort’s. G3m is a development
API for map applications oriented to mobile platforms
and the web. It is a project developed by the
IGO Software Company in collaboration with the
University of Las Palmas de Gran Canaria.
3.1 G3m Integration Architecture
The web-based version of G3m can be embedded as
a web widget in our front-end. This element can be
generated from a WebApp project, based on GWT
and written in Java. This WebApp allows two main
ways of interaction with the developer and the rest of
the interface elements.
The G3m API and source-codes are available in
Java. Therefore, the virtual globe is fully configurable
from the initialization parameters of the WebApp
code, setting different options as the desired imagery,
the navigation controls or the initial position of the
camera.
It is possible as well to develop all the
functionality required for our viewer in Java and to
make it accessible to the browser through Javascript
bindings. This allows dynamic behaviours of our
virtual globe controlled by other elements present in
the user interface. The G3m widget break down and
interactions are shown in Figure 5.
Figure 5: Main interactions between G3m, the rest of the
UI and the back-end of SmartPort.
The main difference of G3m inside the
open-source 3D maps community is its multiplatform
approach. At this moment, the deployment
methodology allows us to add new capabilities
to the main engine programming in C++. These
changes will be directly applied to all the platforms,
meaning iOS, Android and Web.
Despite the current SmartPort user interface is
built on Web, support of mobile platforms such as
Android and iOS is a key step on future developments.
Besides, G3m focus on mobile platforms implies a
native support for multitouch interaction. Therefore,
that multitouch interaction is integrated on our
web front-end and can be used from devices with
capacitive screens.
3.2 Online Terrain Imagery
From a functional point of view, the G3m engine
should provide certain features to support the
operational requirements of the SmartPort’s user
interface.
One key feature is displaying different layers of
imagery over the terrain depending on the particular
interest of the user. There are many ways that
the georeferenced images could be fetched. In our
case, it was decided to utilize the Web Map Service
(WMS) protocol developed by the Open Geospatial
Managingand3DVisualizationofReal-timeBigGeo-referencedDatafromLasPalmasPortthroughaFlexibleOpen
SourceComputerArchitecture
77
Consortium community. Using this protocol based on
HTTP, it is possible to obtain imagery to cover our
representation of the globe’s surface. These images
can be synthetic such as street maps, political maps,
LiDAR (Laser Imaging Detection and Ranging)
visualization or aerospatial photographies as satellite
imagery.
In our case, the SmartPort viewer uses as general
imagery source the Virtual Earth project. This image
set is provided by Microsoft and covers the whole
planet with high-resolution aerial photographies.
However, an application aimed to represent the
elements present in a port environment requires an
even higher image resolution.
These images will be used as textures to cover the
terrain tiles, composed by RTIN of 16x16 triangles
(Su
´
arez and Plaza, 2009). The tiling algortihm that
determines the terrain representation given a certain
camera position has been discussed on previous
publications (Trujillo et al., 2015).
The surroundings of the Gran Canaria’s port
will be drawn using images fetched from a local
WMS service. In this case, SmartPort uses images
from GrafCan, a public company responsible for the
maintenance of the geographical data of the Canary
Islands. These two layers will form the default base
image set that defines the appearance of the terrain on
the viewer.
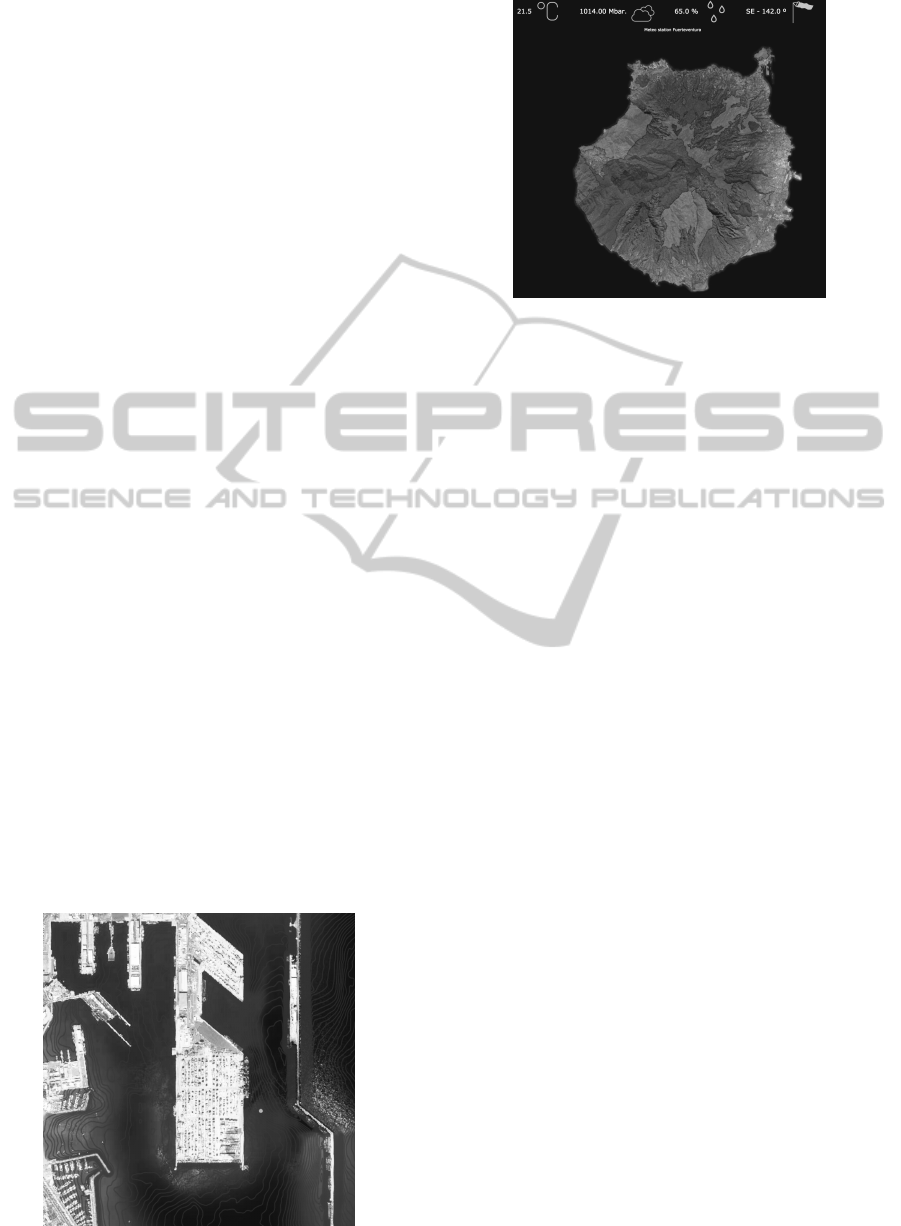
In addition to this base layers, the G3m system
allows to merge these base images with other
semi-transparent layers to enrich the information
content. A WMS server can provide these added
images as well. In this case, the SmartPort project
allows the user to merge information from bathymetry
maps, as is shown in Figure 6. These maps make easy
for the final user to make well-informed decisions
concerning routes or maximum draft of ships.
In addition, the system also provides by default
a layer of natural spaces. These images can be
Figure 6: Bathymetry layer.
Figure 7: Natural spaces of Gran Canaria layer.
overlaid on the base imagery, showing important
natural spaces in the surroundings of the port (see
Figure 7).
The SmartPort project also allows the final user to
fetch his own WMS services. The interface provides
an easy-to-use dialog in which the user indicates the
URL of the server and, automatically, the system
gives him the whole list of maps that server provides.
The selected layers will be from then on available
as thematic layers. These thematic layers can be
merged on the base layers with a selectable degree
of transparency.
3.3 Digital Elevation Model for 3D
Earth Representation
An elevation model could seem not very relevant
on a port control system. However, ports are often
surrounded by mountains and other terrain features
that make easy for their user to locate themselves and
the nearby elements. This effect is remarkable in a
mountainous landscape as Gran Canaria. Besides,
the inclusion of an elevation model makes the viewer
easier to use and much more visually attractive, as
seen in Figure 8.
Using data extracted from LiDAR scanning, the
terrain features surrounding the seaport is represented
in an accurate way. That makes easier for the user
to orientate himself within the 3D view and makes it
more immersive.
In the case of Gran Canaria, it has been used
a regular elevations map of 1000x1000 values to
shape the island. This map is preloaded during the
initialization of the user interface as a single file in
Band Interleaved by Line (BIL) image format. This
enables the system to be independent of any online
elevation data server, which makes the changes on the
terrain faster to perform.
GISTAM2015-1stInternationalConferenceonGeographicalInformationSystemsTheory,ApplicationsandManagement
78
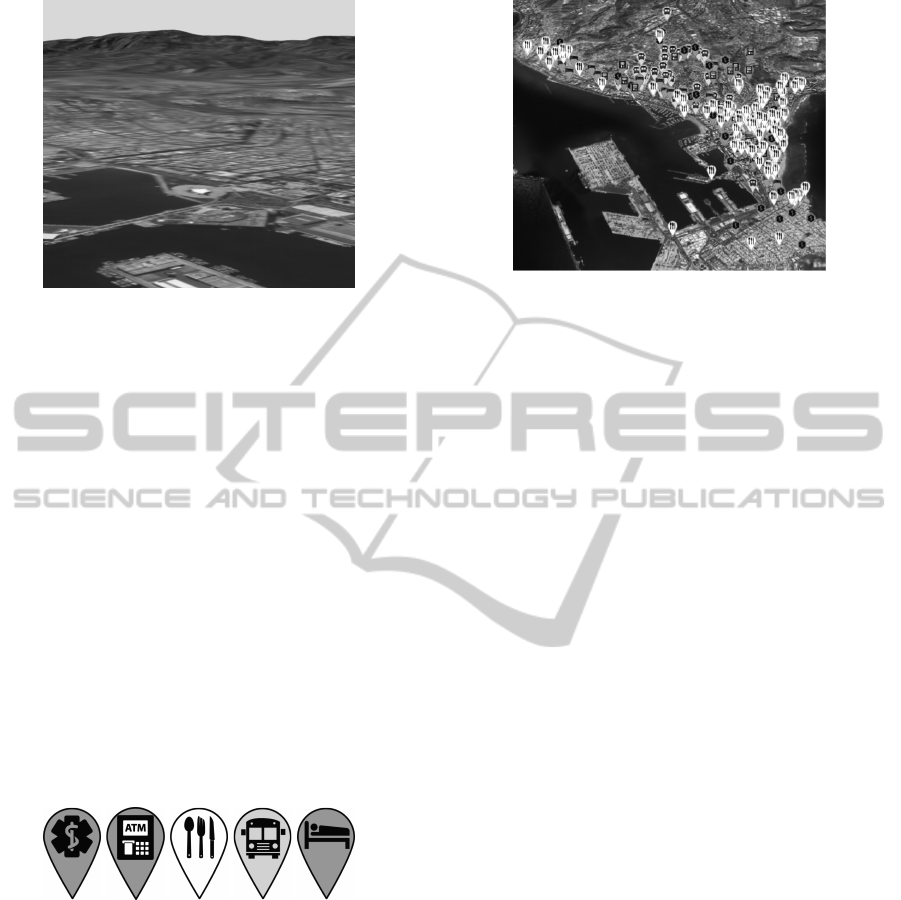
Figure 8: Horizon landscape of Gran Canaria with an
elevation model.
The G3m system allows the use of multiple
sources of elevation data at different resolutions.
Therefore, the developer can use highly detailed
elevations files only on zones of interest and use
broader approximations on other areas. Furthermore,
plain areas, such as the sea can be displayed without
the need of loading any elevation data.
3.4 Plotting Thematic Information
using Map Markers
Despite the 3D nature of the G3m environment,
sometimes the clearest way to show an item’s location
within the scene is simply to use a 2D icon, or mark,
located on a fixed 3D position. The reason to prefer a
2D marker can be that the element to represent is too
complex or it is just a location to be pointed. Some
examples of markers can be found in Figure 9.
Figure 9: The application uses different icons to point
places of interest.
One of the functionalities of The SmartPort
project is to show several points of interest that are
located near the port. These points of interest are
locations that the user may want to find on the map, so
there is no physical representation for them. Besides,
in a typical use there could be a significant number
of markers on the scene, as seen in Figure 10, which
need to be rapidly drawn.
The G3m rendering pipeline permits drawing
thousands of markers at a suitable frame rate. It
uses a billboarding technique (Wolff, 2011, Ch. 6, p.
192) based on the programmable pipeline of mobile
Figure 10: Aerial view showing most of the markers that
the application can show.
GPU’s that avoids the need of maintaining a 3D model
for each mark. In addition, the G3m SDK adds an
abstraction layer that prevents the user from dealing
with GPU’s programming (Trujillo et al., 2014). This
way, rendering numerous markers does not increase
considerably the frame drawing time.
Respecting the generation of icons for the
markers, the G3m project provides a multiplatform
canvas API for the creation of these images. This API
enables us to generate “on the fly” icons combining
different images or even add text to them. Finally,
G3m supports marker user interaction. This way the
system is capable of determining whether the user is
touching a given mark. Whenever a marker is touched
the system alerts the rest of the system so it performs
the corresponding action. In this case, the system
shows a web informative dialog, describing the nature
of the entity represented by the mark.
3.5 Three-dimensional Models
SmartPort also uses 3D models to represent important
assets within the port area. These entities are the
buoys and maritime sensors. The users can easily
recognize these elements by their position and shape.
In the Gran Canaria example, they have been
located five buoys in the vicinity of the port. Each
one of them is represented by its own 3D model. The
G3m engine allows the developer to use color models,
as the model shown on Figure 12, or textured models
and render them using light and shading effects, as
seen in Figure 11.
As happens with the markers, it is of high interest
that all 3D objects of the scene are selectable so it is
possible to perform actions and display information as
the user interacts with them. In the case of SmartPort
for web, this interaction could be through using the
mouse device or multitouch screens.
The implementation of this selection criterion
Managingand3DVisualizationofReal-timeBigGeo-referencedDatafromLasPalmasPortthroughaFlexibleOpen
SourceComputerArchitecture
79
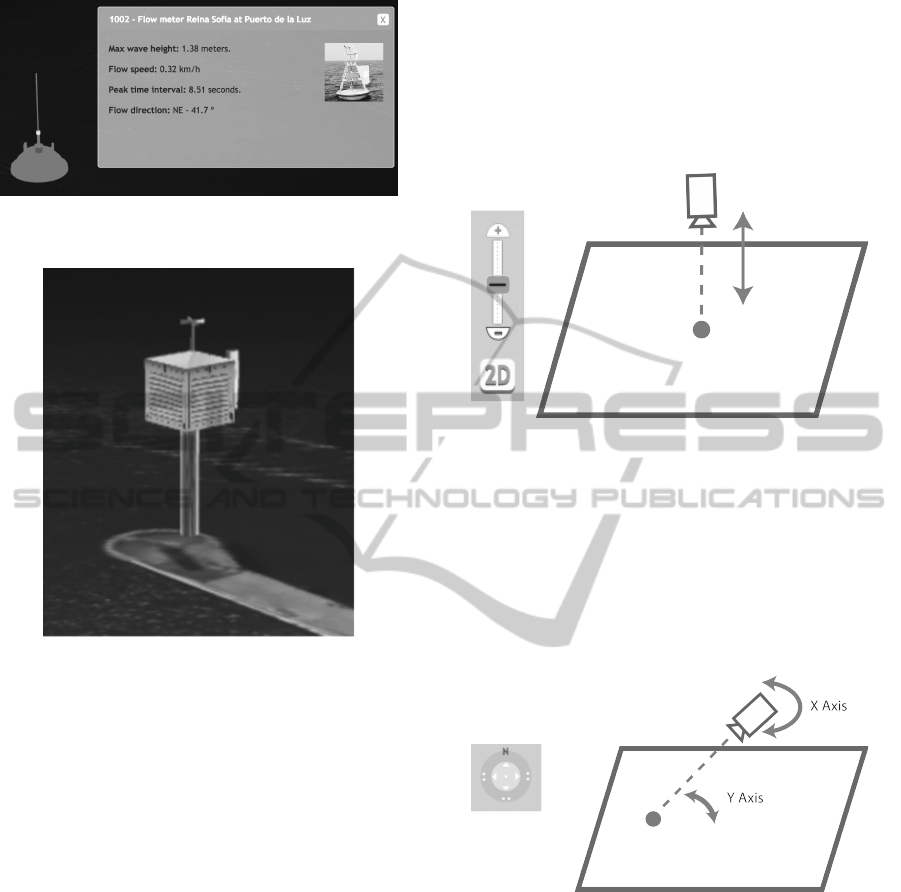
Figure 11: Image of a model representing a buoy and
associated information.
Figure 12: Image of a model representing a meteorological
station.
is based on bounding box hierarchies that allow
computing efficiently the intersection problem. Once
the object has been selected, a message to the rest of
the system is sent. This way a certain action could be
performed, as could be displaying data collected by
the selected sensor.
3.6 Heads-up Display Interaction
As has been previously stated, the G3m engine allows
multitouch camera control as well as mouse/keyboard
navigation. These control mechanism are enough
for positioning the camera in any suitable location
that the user may want to visualize. This camera
position is configured by its geographical location
(latitude and longitude), its elevation over the terrain
and the heading and pitch of the view direction over
the terrain.
However, the mouse/keyboard control system
could be unfamiliar to the user. In this case, G3m
allows us to display 2D interactive widgets on top of
the 3D view that allow the user to control the camera.
The SmartPort front-end has added two on-screen
controllers that allow the user to manage the height
of the camera, its heading and the pitch of the view.
The first one is a vertical scrollbar that makes easy
to take the camera up and down through the planet
vertical direction. From a zenith perspective, this
scrollbar can be used as a zoom controller, as seen
in Figure 13.
Figure 13: HUD Scrollbar camera interaction.
The second one is a dragging-ball widget that
permits moving the camera direction in the same
direction as the centre of the widget is dragged. The
dragging direction has two components: X, which
alters the heading of the camera, and Y, which affects
the pitch of the current view. Figure 14 shows how
this control allows the user to explore the scene from
a static location.
Figure 14: HUD Scrollbar camera interaction.
4 DISCUSSION AND
CONCLUSION
The enormous amount of data generated by a regular
seaport infrastructure is generally poorly used and
often displayed through many channels. Due to
this situation, most port authorities obtain a lesser
benefit from their quite complex and expensive sensor
networks. However, for the first time, it is now
possible to process, store and show these Big Data
environments so they can offer a truly added value.
GISTAM2015-1stInternationalConferenceonGeographicalInformationSystemsTheory,ApplicationsandManagement
80

SmartPort reveals itself as an integral tool to
assist the analysis and control of all the data sources
available for the Las Palmas Port Authority. The
analysis offers a geospatial and temporal view of the
recollected data, while the control is based on the alert
management system. Despite there are some other
ad-hoc solutions to the marine traffic and data analysis
in port environments, our project adds a novel 3D
experience in which the data displaying responds to
the camera movements. Besides, SmartPort seeks
to be an open project, offering and scalable and
reliable back-end, a mutable data model and a highly
customizable web user interface.
At the time this paper is written, the SmartPort
project has been a successful development and it is
about to be delivered to a real environment to play an
important role in the decision-making process of the
port authority.
At the domain study stage, we have fully
examined the seaport’s infrastructure to obtain a
data model useful for the management of the port’s
resources. The biggest challenge however, was to
offer a reliable, scalable and fast data treatment to
support the user interface. In this sense, the Generic
Enablers provided by FI-WARE offered us all the
‘Big Data’ needed resources.
On the other hand, Glob3 Mobile was a key
element in the development of the front-end. Using
latest WebGL technologies, it allows us to tailor a 3D
user experience that was at the same time, interactive
and customizable. This way the user is able to display
the data he is really interested into and navigate
through a representation of Las Palmas seaport. In a
similar manner, the rest of the interface elements have
been thought to offer the best user experience in terms
of intuitive use and fast data visualization.
The main line of future work is the migration
of the SmartPort to truly be supported on mobile
handheld devices as smartphones and tablets, where
Glob3 Mobile virtual globe has been proved and
tested so far. Some other upcoming tasks are to keep
improving the data transfer rates and usability of the
user interface. Finally, some other features could be
added based on the current available data, such as
forecasting and automatic control systems.
ACKNOWLEDGEMENTS
The fourth author wants to thank Agencia Canaria
de Investigaci
´
on, Innovaci
´
on y Sociedad de la
Informaci
´
on, for the grant “Formaci
´
on del Personal
Investigador-2012 of Gobierno de Canarias”.
We would also like to thank the port authority
general director, Salvador Capella, for supporting the
access to the data of Puerto de La Luz.
REFERENCES
Claramunt, C., Devogele, T., Fournier, S., Noyon, V.,
Petit, M., and Ray, C. (2007). Maritime gis: from
monitoring to simulation systems. In Information
Fusion and Geographic Information Systems, pages
34–44. Springer.
Georgas, N. and Blumberg, A. F. (2010). Establishing
confidence in marine forecast systems: The design
and skill assessment of the new york harbor
observation and prediction system, version 3 (nyhops
v3). In 11th International Conference in Estuarine
and Coastal Modeling (ECM11). Spalding, ML,
Ph. D., PE, American Society of Civil Engineers,
Washington, pages 660–685.
Kaminski, L., Kulawiak, M., Cizmowski, W., Chybicki, A.,
Stepnowski, A., and Orlowski, A. (2009). Web-based
gis dedicated for marine environment surveillance and
monitoring. In OCEANS 2009-EUROPE, pages 1–7.
IEEE.
Kim, S. A., Shin, D., Choe, Y., Seibert, T., and
Walz, S. P. (2012). Integrated energy monitoring
and visualization system for smart green city
development: Designing a spatial information
integrated energy monitoring model in the context of
massive data management on a web based platform.
Automation in Construction, 22:51–59.
McCann, M. P. (2004). Using geovrml for 3d
oceanographic data visualizations. In Proceedings
of the ninth international conference on 3D Web
technology, pages 15–21. ACM.
Pedriza, A., Citores, M., de la Calle, M., G
´
omez-Deck,
D., Trujillo, A., Santana, J., Perdomo, K., and
Su
´
arez, J. (2012). Glob3 mobile: Sistemas de
informaci
´
on geogr
´
aficos 3d en entornos de movilidad.
In III Jornadas Ib
´
ericas de Infraestructura de Datos
Espaciales, Madrid, Spain.
Su
´
arez, J. and Plaza, A. (2009). Four-triangles adaptive
algorithms for rtin terrain meshes. Mathematical and
Computer Modelling, 49(5):1012–1020.
Talukder, A. and Panangadan, A. (2009). Online
visualization of adaptive distributed sensor webs. In
Aerospace conference, 2009 IEEE, pages 1–8. IEEE.
Trujillo, A., G
´
omez-Deck, D., de la Calle, M., Su
´
arez, J.,
Pedriza, A., and Santana, J. (2013). Glob3 mobile: An
open source framework for designing virtual globes
on ios and android mobile devices. In Progress and
New Trends in 3D Geoinformation Sciences, pages
211–229. Springer.
Trujillo, A., Su
´
arez, J., Santana, J., de la Calle, M., and
G
´
omez-Deck, D. (2014). An efficient architecture for
automatic shaders management on virtual globes. In
Computing for Geospatial Research and Application
(COM. Geo), 2014 Fifth International Conference on,
pages 38–42. IEEE.
Managingand3DVisualizationofReal-timeBigGeo-referencedDatafromLasPalmasPortthroughaFlexibleOpen
SourceComputerArchitecture
81
Trujillo, A., Su
´
arez, J., Santana, J., de la Calle, M.,
and G
´
omez-Deck, D. (2015). An efficient terrain
level of detail implementation for mobile devices and
performance study. Computers, Environment and
Urban Systems, page To Appear.
Villase
˜
nor, E. and Estrada, H. (2014). Informetric mapping
of big data in fi-ware. In Proceedings of the
15th Annual International Conference on Digital
Government Research, pages 348–349. ACM.
Wolff, D. (2011). OpenGL 4.0 shading language cookbook.
Packt Publishing Ltd.
Wright, N. R. and Yoon, J. (2007). Application of
GIS technologies in port facilities and operations
management. ASCE Publications.
Zhang, L., Stoffel, A., Behrisch, M., Mittelstadt, S.,
Schreck, T., Pompl, R., Weber, S., Last, H., and Keim,
D. (2012). Visual analytics for the big data era—a
comparative review of state-of-the-art commercial
systems. In Visual Analytics Science and Technology
(VAST), 2012 IEEE Conference on, pages 173–182.
IEEE.
APPENDIX
Table 2: Index of Back-End technologies.
Name Company - Author Reference
Hadoop Apache Software Foundation http://hadoop.apache.org/
Requests Python Library Kenneth Reitz http://docs.python-requests.org/
en/latest/
Hadoop Distributed File System Apache Software Foundation http://hadoop.apache.org/docs/
r1.2.1/hdfs user guide.html
Hive Apache Software Foundation https://hive.apache.org/
Pig Apache Software Foundation http://pig.apache.org/
MongoDB MongoDB, Inc. http://www.mongodb.org/
Hive Utils Eventbrite and Contributors https://pypi.python.org/
pypi/hive utils/0.0.1
Table 3: Index of Front-End technologies.
Name Company - Author Reference
HighCharts Highsoft AS http://www.highcharts.com/
Glob3 Mobile IGO Software - ULPGC http://www.glob3mobile.com/
Web Map Service Open Geospatial Consortium http://www.opengeospatial.org/standards/wms
WebGL Khronos Group https://www.khronos.org/webgl/
GISTAM2015-1stInternationalConferenceonGeographicalInformationSystemsTheory,ApplicationsandManagement
82
