
Testing the Validity of Lamberts Law for Micro-scale Photometric
Stereo Applied to Paper Substrates
Faisal Azhar
1
, Khemraj Emrith
2
, Stephen Pollard
1
, Melvyn Smith
2
, Guy Adams
1
and Steve Simske
3
1
Hewlett Packard Laboratories, Bristol, U.K.
2
Centre for Machine Vision, University of West of England, Bristol, U.K.
3
Hewlett Packard Laboratories, Ft Collins, U.S.A.
Keywords: Micro-scale Photometric Stereo, Lambert Reflectance Model, Paper and Surface Normals.
Abstract: This paper presents an empirical study to investigate the use of photometric stereo (PS) for micro-scale 3D
measurement of paper samples. PS estimates per-pixel surface orientation from images of a surface captured
from the same viewpoint but under different illumination directions. Specifically, we investigate the surface
properties of paper to test whether they are sufficiently well approximated by a Lambertian reflectance
model to allow veridical surface reconstruction under PS and explore the range of conditions for which this
model is valid. We present an empirical setup that is used to conduct a series of experiments in order to
analyse the applicability of PS at the micro-scale. In addition, we determine the best 4, 6, and 8 light source
tilt (illumination) angles with respect to multi-source micro-scale PS. Furthermore, an intensity based image
registration method is used to test the accuracy of the recovery of surface normals. The results demonstrate
that at the micro-scale: (a) Lambert model represents well the data sets with low root mean square (RMS)
error between the original and reconstructed image, (b) increasing the light sources from 4 to 8 reduces
RMS error, and (c) PS can be used to extract veridical surface normals.
1 INTRODUCTION
Photometric stereo (PS) has been widely used at
macro-scale to recover local surface orientation and
reflectance properties of a surface by using various
reflectance models such as Lambertian, Phong,
Torrance-Sparrow, Cook-Torrance, Oren-Nayar etc.
(Matsushita and Ikeuchi, 2012; McGunnigle et al.,
2012; Yang and Ahuja, 2012). The local surface
orientation obtained at each pixel can be integrated
to create a detailed 3D surface reconstruction (Li
and Li, 2011). The PS method is simple and uses per
pixel surface reconstruction with time efficacy and
has the advantage, over conventional stereo vision,
that it does not require solving a correspondence
problem (Angelopoulou and Petrou, 2013; Gorpas et
al., 2013; Li and Li, 2011). The applications include
surface inspection, fault detection, shape recovery,
recognition, biometrics, quality assurance, auditing,
charge allowance etc. (Bringier et al., 2012; Li and
Li, 2011). There have been limited applications of
photometric stereo at the micro scale (Gorpas et al.,
2013; Johnson et al., 2011; Li and Li, 2011). This is
because at micro-scale the general assumptions of
the standard PS are violated, i.e., light sources are
close to the surface, light is not uniformly distributed
and the surface reflectance may not be approximated
by Lambert’s law.
We investigate whether the surface of paper is
sufficiently well described as Lambertian at the
micro-scale. We are surrounded by paper from
routine and private documents to bank notes, flyers,
posters, tickets, etc. The frequent and numerous
routine usage of paper makes its surface topography
inspection vital for the paper and printing industry.
The surface topography of paper can be used to
assess paper and print characteristics such as ink
transfer, ink distribution, and surface gloss, it can
also be used to authenticate the paper itself etc.
(Chinga-carrasco, 2012; Clarkson et al., 2009;
Kuparinen et al., 2007; Pino and Pladellorens, 2009).
In this context, we apply multi-source PS based on
Lambertian model to three paper types, i.e.,
embossed, gloss and matte, to verify whether
Lambert’s model fits well at the micro-scale. Data
sets are obtained by using an optical microscope
with a 5MP digital camera to image paper samples
on a platform suspended above a rotating white light
246
Azhar F., Emrith K., Pollard S., Smith M., Adams G. and Simske S..
Testing the Validity of Lamberts Law for Micro-scale Photometric Stereo Applied to Paper Substrates.
DOI: 10.5220/0005359302460253
In Proceedings of the 10th International Conference on Computer Vision Theory and Applications (VISAPP-2015), pages 246-253
ISBN: 978-989-758-089-5
Copyright
c
2015 SCITEPRESS (Science and Technology Publications, Lda.)
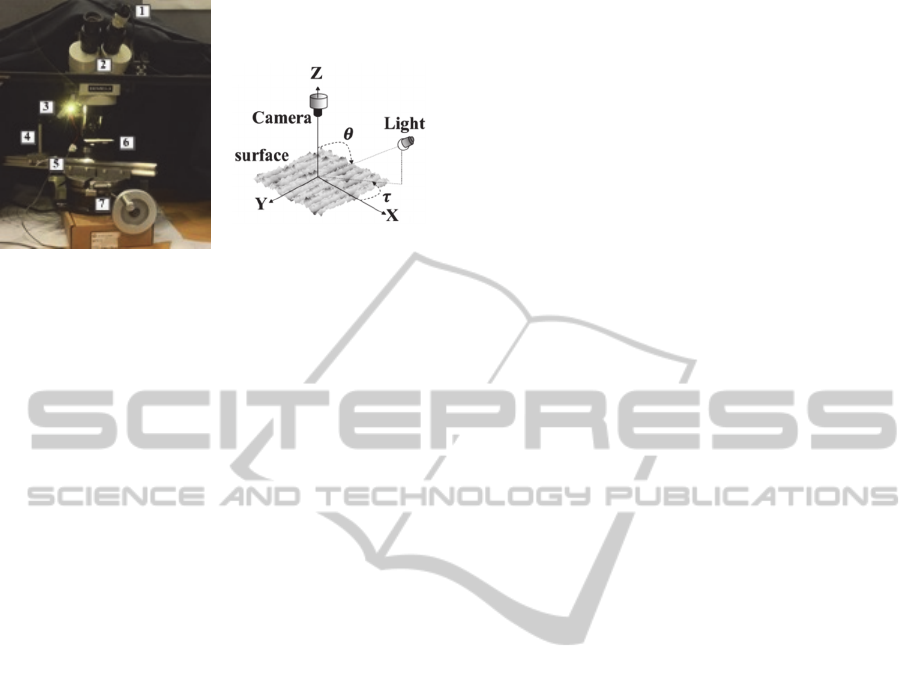
Figure 1: Experimental setup on left with numbered (1)
5MP digital camera, (2) an optical microscope, (3) LED
light source, (4) and (5) vertical and horizontal adjustment
of LED from paper sample placed on a platform (6), and
(7) turntable to rotate the LED. The corresponding setup
on the right represent photometric stereo image capture.
source as shown in Figure 1. The datasets provide
photometric images captured at different light source
tilt angles (labelled τ in Figure 1) for each paper type
together with variations in the horizontal and vertical
distances of the light sources from the paper sample
(which affect its slant angle θ). Through this setup
we investigate whether paper is well approximated
by a Lambertian reflectance model at the micro-
scale. Next, we investigate the use of 4, 6 and 8 light
source PS for micro-scale recovery of local surface
orientation. To the authors knowledge this is the first
work to determine optimal illumination positions
from more than three PS (Drbohlav and Chantler,
2005 does it for 3 PS), i.e., 4, 6 and 8 light sources,
by comparing each choice with “reference data” that
is obtained by applying PS to the complete set of 49
and 55 photometric images. Finally, we investigate
whether PS can provide robust veridical surface
normals from micro-scale paper images. We utilize
an intensity based image registration to align PS
images for a paper rotated in the x-y plane through
roughly 45 degrees and directly compare the
recovered surface gradients/normals.
The major contributions of this study are as
follows: (a) implementation of a Sine curve model
fit for local (per-pixel) and global (image) data to
establish whether paper is Lambertian at the micro-
scale, (b) design of a procedure to determine best tilt
angles for 4, 6, and 8 light source micro-scale PS,
and (c) utilisation of an intensity based image
registration method to verify the geometrical
accuracy of the recovered surface normals. This
paper is organized as follows. Section II reviews the
literature. Section III briefly describes the PS
method. Section IV presents experimental
investigation, results and discussions. Section V
concludes the paper.
2 LITERATURE REVIEW
2.1 Macro-scale PS
Macro-scale PS methods can be divided into two
categories based on the understanding whether the
non-Lambertian reflections are considered as
outliers for removal, or as inliers within a non-linear
reflectance model (Ikehata et al., 2014; McGunnigle
et al., 2012; Yang and Ahuja, 2012).
The first category assumes a Lambertian
reflectance model and incorporates an outlier
detection algorithm for handling non-Lambertian
pixels or regions in an image (Woodham, 1980),
(Barsky et al., 2003; Coleman and Jain, 1982; Sun et
al., 2007). Traditional PS methods based on
Lambert’s law require at least three images of a
surface taken from the same viewpoint but with
different illumination. Coleman and Jain, 1982,
extend Woodham, 1980, original approach by
employing a fourth light source. They recover
surface normals using the image triplets that produce
the lowest albedos assuming that triplets with higher
albedos must be affected by the specular reflection
and that the specular reflections in different images
do not intersect. This method fails to recover the
surface normals accurately in the presence of
shadows and highlights. Barsky et al., 2003,
addressed this limitation by using colour projection
and detecting both specular reflections and shadows.
Sun et al., 2007, simplified the method of Barsky et
al., 2003, by detecting and eliminating specular
(highest intensity value) and shadow (lowest
intensity value) pixels from six photometric images
to recover surface normals. These methods are
computationally expensive due to the per-pixel
computations required to choose from the
increasingly large sets of photometric images used
(Wu and Tang, 2010; Yang and Ahuja, 2012).
The second category considers non-Lambertian
reflections as inliers and defines reflectance models
e.g., Phong, Torrance-Sparrow, Cook-Torrance etc.
Phong reflectance model is a linear combination of
diffuse (Lambertian), specular, and ambient
components (Argyriou, Vasileios and Petrou, 2008).
The Torrance-Sparrow and Cook-Torrance models
consider surface micro-facets as a combination of
‘‘V-shaped” cavities (Cook and Torrance, 1982;
Torrance and Sparrow, 1967). While they are
designed for specular surfaces they are also able to
represent rough materials whose surface properties
TestingtheValidityofLambertsLawforMicro-scalePhotometricStereoAppliedtoPaperSubstrates
247

are different from the Lambertian model. However,
these methods suffer from the effects of shadows
and numerical instabilities derived from the complex
non-linear optimization required for their solution
(Ikehata et al., 2014). McGunnigle et al. (2012), use
Oren-Nayar reflectance model, which also considers
a surface as a combination of micro-facets, to model
the behaviour of matte surfaces that violate
Lambert’s Law. The authors compute intensity
contributed from all the individual facets of the
surface and present a qualitative model which works
well provided the surface roughness is <0.3. More
recently the use of general reflectance properties
such as monotonicity, visibility, and isotropy, that
are common among reflections from diverse
materials, has been suggested in order to apply PS to
a wide range of materials (Higo et al., 2010).
However, even this method is not able to deal with
the reflectance function whose specular component
is composed of two or more lobes.
2.2 Micro-scale PS
Johnson et al., 2011, developed an elastomeric
sensor and applied PS that uses six LEDs to capture
microscopic structure of surface materials
independent of their surface properties. However,
besides being expensive, bulky and slow, the sensor
is also not appropriate for non-rigid surfaces and
does not recover the albedo or other surface
properties of the material. Li and Li, 2011, claim to
be the first to apply uncalibrated PS for
microstructure 3D measurement. They use
generalized bas-relief to resolve the inherent shape
or light ambiguity of uncalibrated PS. They use a
Markov Random Field based graph cuts energy
minimization model to refine the recovered surface
normals. Their method has been shown to work well
on synthetic data and real images (640 x 480 pixels
and 1024 x 768 pixels). However, the computational
complexity of this method is not presented. Hence, it
is not known if this method is suitable for real-time
and real-world application. Recently, a miniature PS
system (Gorpas et al., 2013) has been proposed for
textile surface reconstruction. It uses a low-cost
camera (640 x 480 pixels) with eight LED light
sources and describes hardware specifications, e.g.,
a cylindrical enclosure to address the ambient light
and a Fresnel lens to collimate the LED illumination,
in order to apply PS at the micro-scale. Furthermore,
in order to ensure uniform illumination it proposes a
flat-fielding procedure that normalizes the input
images with images of a Lambertian surface (e.g.,
white paper card), with known albedo and under the
same LED illumination direction. This system has
been shown to recover the surfaces of textile fabrics
and bank notes. However, they do not investigate
whether the textile fabrics or bank notes are well
approximated by the Lambertian model at the micro-
scale. In fact only qualitative results were presented
and neither the method nor the advantage of using 8
LED PS to reduce surface reconstruction error were
explored quantitatively.
3 PHOTOMETRIC STEREO
According to Lambert’s law a perfectly diffuse
surface illuminated by a single distant light source
appears equally bright from all viewing direction
(Bringier et al., 2012). In this case, the reflected light
intensity from the surface is considered as the dot
product of surface normal and the light source
illumination directions (Argyriou, Vasileios and
Petrou, 2008; Barsky et al., 2003).
∙ (1)
Let us consider that
...
and
...
are the stack of pixel intensity and
illumination vectors respectively. Here, represents
the number of illumination directions, is the
albedo (surface reflectance) and
,
,
are the x, y, z components of the normal at each
pixel. The illumination directions is found by
computing the illumination vectors as
sin
cos
,sin
sin
,cos
. (2)
Where is the slant angle between the illumination
vector and the z-axis, and is the tilt angle between
the x-axis and the projection of the illumination
vector onto the x-y plane as shown in Figure 1 right.
The pseudo-inverse of the illumination direction,
i.e.,
L
, is multiplied with the reflected intensity
in order to calculate as
.
(3)
Where
,
,
is used to recover the
albedo by calculating the length of as
. (4)
Here, “ ” is element-wise product. This allows us to
compute the surface normals as /. The
surface gradients, i.e., (x-direction) and (y-
direction) are determined using
/
and
/
respectively. Finally, the Frankot and
Chellappa, 1988 algorithm can be used to integrate
the surface gradients for 3D surface reconstruction.
VISAPP2015-InternationalConferenceonComputerVisionTheoryandApplications
248

4 METHODOLOGY
4.1 Experimental Setup
An optical microscope with a 5MP digital camera
fitted in its eye piece is used to image paper on a
platform suspended above a turntable that rotates the
white LED light source at different tilt angles as
shown in Figure 1. The horizontal (H) and vertical
(V) distances of the light source from the centre of
the paper sample (which affect its slant angle) and
the light source intensity are adjustable. This setup is
surrounded by a blackout cloth to avoid ambient
light during the acquisition of images. Three
different paper types, i.e., embossed, glossy and
matte, are captured at (1280 x 960) resolution of size
4mm (width) and 3mm (height) in the experiments.
Two multi-source PS datasets of 55 and 49
images respectively, and one four source PS data set
of the three paper types with different variations of
light source configuration are collected. The first
data set has two variations per paper type, i.e.,
(0.2A, H=5cm, V=6cm) and (0.3A, H=8cm,
V=6cm). It contains images captured at 55 different
tilt angles (from 135° to 405°) for each paper type.
The second data set has three variations per paper
type, i.e., (0.1A, H=2cm, V=6cm), (0.05A, H=2cm,
V=4cm) and (0.05A, H=2cm, V=2cm) with images
captured at 49 different tilt angles (from 140° to
380°). The specific range of tilt angles are used due
to physical limitation of the experimental setup. The
intensity of the light source is regulated using a
current range of 0.05A to 0.40 A. The third data set
has two rotation (Rot) variations of the paper
sample, i.e., (0.01A, H=7cm, V=7cm, Rot=0°) and
(0.01A, H=7cm, V=7cm, Rot=45°), for each paper
type. It consists of photometric images taken at 4
different tilt angles (135°, 225°, 315°, and 405°).
4.2 Surface Reflectance
We present a modified Sine curve function
(sinusoidal behaviour) (Saito et al., 1999) to
characterise the intensity profile of paper
illuminated from different tilt angles. Two multi-
source data sets are used to determine whether local
(individual pixels) and global (entire image) data of
paper at the micro-scale is well approximated by a
Lambertian reflectance model.
If the pixel intensity value at each tilt angle,
,
satisfies the Lambert model Equation (1) then the
value must fit the Sine curve Equation (5) (Saito et
al., 1999). The Sine curve fitting procedure is
implemented locally and globally as follows. First,
we measure how the pixel intensity values of paper
surface vary with respect to different tilt angles,
.
Next, the surface normals , and the surface
reflectance , of each pixel are estimated using PS
based on Lambert’s law. The Sine curve is
determined by computing the intensity of each pixel,
i.e.,
, at different tilt angles as
sin
. (5)
The amplitude is derived as follows.
sin
. (6)
is the orientation of the surface normal in x-y
direction, and it represents the phase shift in the
sinusoidal behaviour. A modification from (Saito et
al., 1999) that includes
is used to calculate
as
sin
. (7)
is computed using
cos
(8)
Assuming that the paper surface is Lambertian at the
micro-scale then we expect the Sine curve to fit well
the reference data, i.e., recorded pixel intensity
values, at the corresponding tilt angles. In addition,
we can compare the reference (Original) image and
the reconstructed global (entire image) data for all
pixels obtained using (5) at different tilt angles, τ
,
to determine how well Lambert’s model represents
the paper surface at the micro-scale.
4.3 Light Source
We present a procedure to empirically determine the
best 4, 6, and 8 tilt angles with respect to the
reference multi-source, micro-scale PS. We use PS
method in Equation (1-3) on the two multi-source
PS data sets to create the reference gradients and
in the x and y direction respectively. Let the vector
1,2,…k. A combinatorial logic is used to
determine a matrix that contains all possible non-
repetitive combinations of the elements of vector
taken at a time. Here, is the number of selected
light sources, i.e., 4, 6 and 8. Next, we select from
those combinations in which the light sources are
sufficiently far apart (but not necessarily equally
spaced) from each other by using
τ
τ
(9)
∀1,2…1. The lower
and upper
limits of difference in tilt angles between two PS
TestingtheValidityofLambertsLawforMicro-scalePhotometricStereoAppliedtoPaperSubstrates
249

images are set as 60° and 90°, 30° and 90°, and 20°
and 90° respectively to select limited combinations
for 4,6 and 8. PS is applied to each subset to
compute the gradients
and
from light
sources. These gradients are then compared with the
reference gradients and obtained from multi-
source (all 49/55 images) PS to quantitatively
determine the effect of the number and position of
the light sources on the quality of PS recovery.
4.4 Intensity based Image Registration
We use an intensity based image registration method
that aligns the PS images of a paper rotated in the x-
y plane through 45 degrees in order to determine the
geometrical accuracy of recovered surface normals
by using the third data set (4-source PS).
Intensity based gradient descent, minimising the
sum square difference, is used to align the raw
image data. We experimented with using albedo or
recovered gradient based registration but
surprisingly the image based approach was equally
effective despite the difference in the illumination
directions used to capture the images. For simplicity
we use an affine transformation model
′
′
1
001
1
. (10)
or simply
. The transformation matrix, , is
used to map the points () in one space to the
points (′′) in another. H contains the rotation,
scale and skew parameters
and
translation in horizontal
and vertical
directions.
Subsequently, the transformation matrix
is applied
to the and gradients recovered for the rotated
image data. These gradients must themselves be
corrected for the rotation before they can be
compared against the gradients/normals of the
original images.
Let , , and be the reference gradients and
surface normals obtained from original photometric
images. Also,
,
and
represent the gradients
and surface normals of the registered PS data.
Gradients are corrected for the rotation as follows.
̂
(11)
(12)
Leading to the corrected surface normal.
̂
,
,1
̂
1
(13)
The corrected and reference gradients and surface
normals are then compared to determine whether at
the micro-scale PS can be used to extract veridical
surface normals.
5 RESULTS AND DISCUSSION
5.1 Accuracy of Sine Curve Fitting
For each paper type, we select random pixels to
model using the approach outlined in Section 4.2.
Figure 2 shows the result of the Sine curve fitting on
random pixels of the two multi-source data sets. The
top row (left-to-right) shows paper types, i.e.,
embossed (P1), specular (P2) and matte (P3). The
middle and bottom rows show the Sine curves
(corresponding to each paper type) fitted to
individual random pixel of each of the two multi-
source data sets of 55 and 49 images respectively.
We observe that the Sine curve fits well the intensity
profile at the micro-scale. In this experiment we
found that the vast majority of individual pixels are
well represented by a Lambertian model.
The residuals, i.e., the difference between the
measured (original) pixel intensity values and
the estimated values based on Lambert’s model are
also computed. For this purpose, we compute the
root mean square error (RMS) of the reference
(Original) image and the image reconstructed (using
the simple PS method in Section 3 for all 49 or 55
samples), at different tilt angles, τ
. The RMS error
results obtained on the 55-source and 49-source data
sets, are shown in Figure 3 left and right
respectively. It can be observed from the results that
a low RMS error relative to the 8 bit intensity range
is obtained, i.e., most pixels are well represented by
a Lambertian model. In general across both data sets
we find that steeper slant angles, e.g., H=2cm and
V=6cm, and H=5cm and V=6cm, give lower RMS.
5.2 Impact of Light Configuration
The procedure described in section 4.3 is applied on
the two multi-source data sets in order to compute
the root mean square (RMS) error of the gradients
obtained from multi-source PS, and the gradients
from 4,6,8 light sources at different subsets
(size>100) of the tilt angles. In Figure 4, the RMS
errors of the configurations that gave the lowest
value in each case, with respect to 49-source PS, of
and gradients are shown to demonstrate the
impact of using more light sources on PS. As in
previous experiments, the light source configuration
H=2cm and V=6cm produces the least RMS error of
VISAPP2015-InternationalConferenceonComputerVisionTheoryandApplications
250
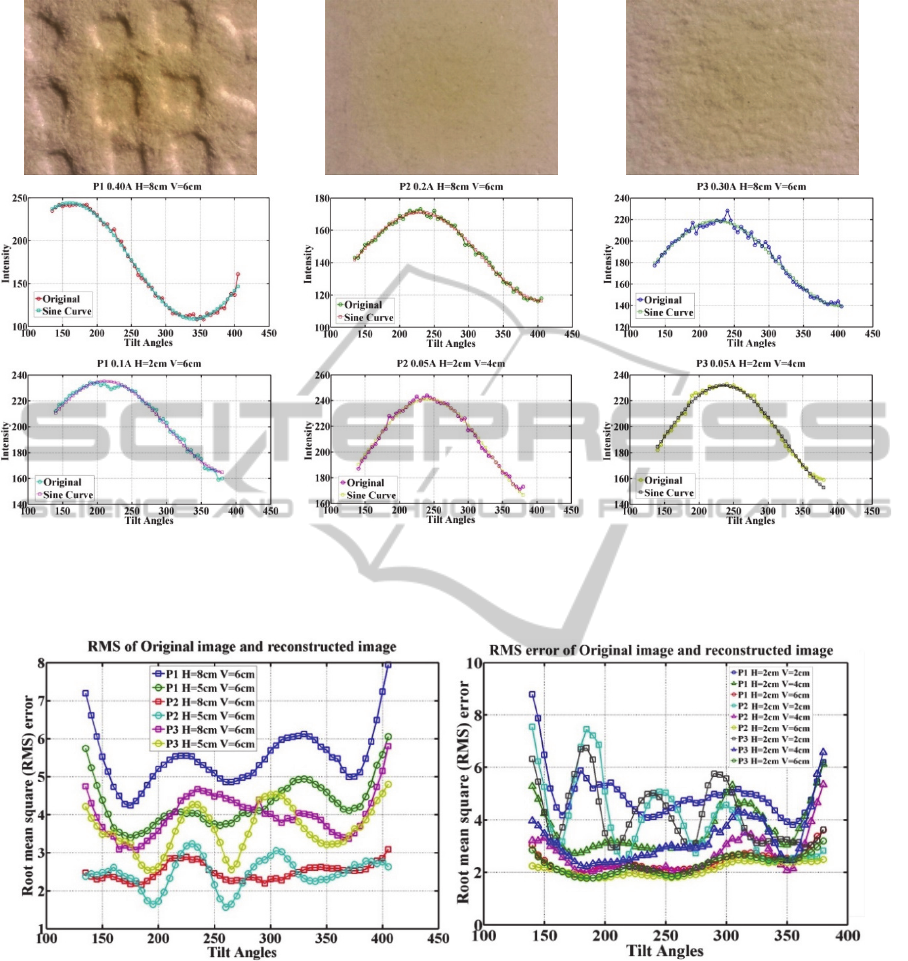
Figure 2: Sine curve fitted to the Original pixel intensity value/profile of paper illuminated from different tilt angles. Paper
types, i.e., embossed (P1), specular (P2) and matte (P3), are shown in top row (left-to-right). The middle and bottom rows
respectively show the corresponding Sine curves fitted to random pixels using the 55 and 49 photometric images of the two
multi-source data sets. H and V are the horizontal and vertical distance of the light source from the centre of paper.
Figure 3: Root mean square (RMS) error relative to the 8 bit intensity range of the original image and reconstructed image
using a Lambertian model at different light source tilt angles on 55-source and 49-source data sets in left and right
respectively. H and V are the horizontal and vertical distance of the light source from the paper.
gradients for different variations of tilt angles
irrespective of the number of light sources used. The
number of light sources is less significant than their
location with moderate improvements moving from
4 to 6 sources and a further small improvement
moving on to 8 sources.
As expected configurations where the tilt angles
are more evenly spread over the range of possible
values tended to give lower RMS error. For 55
photometric image data set the best tilt angles in
degree are [165 245 310 400], [155 210 250 295 345
395] and [150 200 220 255 290 340 375 395] for the
4, 6 and 8 light source situations with least RMS
error of gradients 0.0112, 0.0101 and 0.0088
respectively. Interestingly however, the tilt angles
[135 225 315 405] that are 90° degree apart could
only give 0.0159.
TestingtheValidityofLambertsLawforMicro-scalePhotometricStereoAppliedtoPaperSubstrates
251
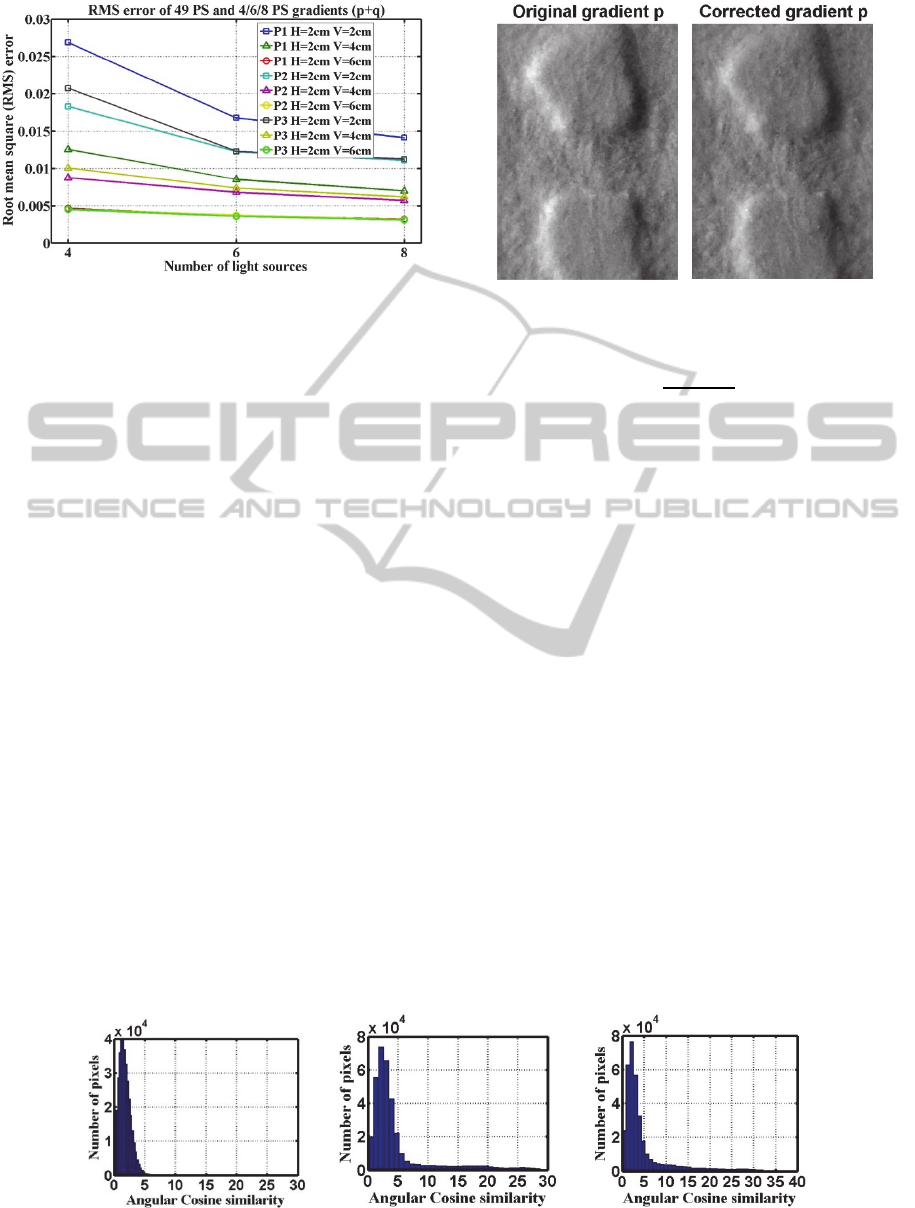
Figure 4: Root mean square (RMS) error of p and q values
from best 4, 6 and 8 image PS with respect to 49 image
based PS used as reference data for various illumination
positions (H and V).
As expected configurations where the tilt angles are
more evenly spread over the range of possible values
tended to give lower RMS error. For 55 photometric
image data set the best tilt angles in degree are [165
245 310 400], [155 210 250 295 345 395] and [150
200 220 255 290 340 375 395] for the 4, 6 and 8
light source situations with least RMS error of
gradients 0.0112, 0.0101 and 0.0088 respectively.
Interestingly however, the tilt angles [135 225 315
405] that are 90° degree apart could only give
0.0159.
5.3 Geometric Accuracy of Surface
Normals
We determine whether micro-scale PS can be used
to extract veridical surface normal using the
procedure explained in section 4.4. The reference
gradients and obtained from the centre region
701 x 501 pixels of the four original photometric
images are compared with the gradients acquired
from the registered photometric images as shown in
Figure 5 (for gradients).
For a quantitative evaluation of the reference
normal and the corrected normal
we employ
the angular Cosine similarity metric ,
Figure 5: Reference (original) and corrected gradients
from the registered PS images for embossed paper.
cos
∙
‖
‖
(14)
i.e., the angular difference between the reference and
corrected normal at each pixel. In Figure 6 angular
similarity of reference normals and corrected
normals are shown as histograms over the centre
region of the embossed (left), specular (middle) and
matte (right) paper. From the small range of angles,
it can be seen that PS extracts veridical surface
normals in each case.
6 CONCLUSIONS
The empirical investigations in this paper show that
photometric stereo (PS) based on Lambert’s law
represents well the paper at the micro-scale. Also,
while an increase in the number of light sources
resulted in a small improvement in the recovered
surface gradients, the position of the light sources
proved far more significant. Furthermore, PS has
been shown to provide robust veridical surface
normals from micro-scale paper images. These
insights on the use of PS for micro-scale 3D
measurement of paper will allow us in future to
employ it for surface inspection, quality assurance,
biometrics, shape recovery and recognition.
Figure 6: Angular Cosine similarity of reference normal and corrected normal on embossed, specular and matte paper left to
right respectively.
VISAPP2015-InternationalConferenceonComputerVisionTheoryandApplications
252

REFERENCES
Angelopoulou, M.E., Petrou, M., 2013. Evaluating the
effect of diffuse light on photometric stereo
reconstruction. Mach. Vis. Appl. 25, 199–210.
Argyriou, Vasileios and Petrou, M., 2008. Photometric
stereo: an overview. Adv. Imaging Electron Phys. 156,
1–54.
Barsky, S., Petrou, M., Sciences, P., 2003. The 4-source
photometric stereo technique for 3-dimensional
surfaces in the presence of highlights and shadows.
IEEE Trans. Pattern Anal. Mach. Intell. 25, 1239 –
1252.
Bringier, B., Bony, A., Khoudeir, M., 2012. Specularity
and shadow detection for the multisource photometric
reconstruction of a textured surface. J. Opt. Soc. Am.
A. Opt. Image Sci. Vis. 29, 11–21.
Chinga-carrasco, G., 2012. Complementary microscopy
techniques for surface characterisation of uncoated and
mineral pigment coated paper. In: Current Microscopy
Contributions to Advances in Science and Technology.
pp. 1448–1455.
Clarkson, W., Weyrich, T., Finkelstein, A., Heninger, N.,
Halderman, J.A., Felten, E.W., 2009. Fingerprinting
Blank Paper Using Commodity Scanners. 30th IEEE
Symp. Secur. Priv. 301–314.
Coleman, J., Jain, R.J., 1982. Obtaining 3-Dimensional
Shape of Textured and Specular Surfaces Using Four-
Source Photometry ’. Comput. Graph. IMAGE
Process. 18, 309–328.
Cook, R.L., Torrance, K.E., 1982. A Reflectance Model
for Computer Graphics. ACM Transanctions Graph. 1,
7–24.
Drbohlav, O., Chantler, M., 2005. On Optimal Light
Configurations in Photometric Stereo. IEEE Int. Conf.
Comput. Vis. 2, 1707–1712.
Frankot, R.T., Chellappa, R., 1988. A method for
enforcing integrability in shape from shading
algorithms. IEEE Trans. Pattern Anal. Mach. Intell.
10, 439–451.
Gorpas, D., Kampouris, C., Malassiotis, S., 2013.
Miniature photometric stereo system for textile surface
structure reconstruction. Videometrics, Range
Imaging, Appl. XII; Autom. Vis. Insp. 8791, 879117–
12.
Higo, T., Matsushita, Y., Ikeuchi, K., 2010. Consensus
photometric stereo. IEEE Conf. Comput. Vis. Pattern
Recognit. 1157–1164.
Ikehata, S., Member, S., Wipf, D., 2014. Photometric
Stereo Using Sparse Bayesian Regression for General
Diffuse Surfaces. IEEE Trans. Pattern Anal. Mach.
Intell. 36, 1816–1831.
Johnson, M.K., Cole, F., Raj, A., Adelson, E.H., 2011.
Microgeometry capture using an elastomeric sensor.
ACM Transanctions Graph. 30, 46:1–46:8.
Kuparinen, T., Kyrki, V., Mielikainen, J., Toivanen, P.,
2007. Paper Surface Topography Using Three-light
Photometric Stereo. Conf. Mach. Vis. Appl. 1–4.
Li, Z., Li, Y.F., 2011. Microscopic Photometric Stereo: A
Dense Microstructure 3D Measurement Method. IEEE
Int. Conf. Robot. Autom. 6009–6014.
Matsushita, Y., Ikeuchi, K., 2012. A biquadratic
reflectance model for radiometric image analysis.
IEEE Conf. Comput. Vis. Pattern Recognit. 230–237.
McGunnigle, G., Dong, J., Wang, X., 2012. Photometric
stereo applied to diffuse surfaces that violate
Lambert’s law. J. Opt. Soc. Am. A. Opt. Image Sci.
Vis. 29, 627–36.
Pino, A., Pladellorens, J., 2009. Measure of roughness of
paper using speckle. Proceeding SPIE 7432, 74320E–
74320E–9.
Saito, H., Omata, K., Ozawa, S., 1999. Recovery of Shape
and Surface Re ectance of Specular Object from
Rotation of Light Source. Second Int. Conf. 3-D Digit.
Imaging Model. 526–535.
Sun, J., Smith, M., Smith, L., Midha, S., Bamber, J., 2007.
Object surface recovery using a multi-light
photometric stereo technique for non-Lambertian
surfaces subject to shadows and specularities. Image
Vis. Comput. 25, 1050–1057.
Torrance, K.E., Sparrow, E.M., 1967. Theory for Off-
Specular Reflection from Roughened Surfaces. J. Opt.
Soc. Am. 57, 1105–1114.
Woodham, R.J., 1980. Photometric method for
determining surface orientation from multiple images.
Opt. Eng. 19, 139–144.
Wu, T., Tang, C., 2010. Photometric Stereo via
Expectation Maximization. IEEE Trans. Pattern Anal.
Mach. Intell. 32, 546–560.
Yang, Q., Ahuja, N., 2012. Surface reflectance and normal
estimation from photometric stereo. Comput. Vis.
Image Underst. 116, 793–802.
TestingtheValidityofLambertsLawforMicro-scalePhotometricStereoAppliedtoPaperSubstrates
253
