
Launch These Manhunts! Shaping the Synergy Maps for Multi-camera
Detection
Muhammad Owais Mehmood
1
, Sebastien Ambellouis
1
and Catherine Achard
2
1
LEOST, French Institute of Science and Technology for Transport, Spatial Planning, Development and Networks,
Villeneuve D’Ascq, France
2
Sorbonne Universites, UPMC Univ. Paris 06 and CNRS UMR 7222, ISIR, F-75005, Paris, France
Keywords:
People Localization, Ghost Pruning, Multi-camera Surveillance, Shape Representations, Pattern Recognition.
Abstract:
We present a method for multi-camera people detection based on the multi-view geometry. We propose to
create a synergy map by the projection of foreground masks across all camera views on the ground plane and
the planes parallel to the ground. This leads to significant values on locations where people are present, and
also to a particular shape around these values. Moreover, a well-known ghost phenomena appears i.e. when
these shapes corresponding to different persons are fused then the false detections are also generated. In this
article, the first improvement is the robust detection of the candidate detection locations, namely keypoints,
from the synergy map based on a watershed transform. Then, in order to reduce the false positives, mainly due
to the ghost phenomena, we check if the particular shape, for an ideal person, is present or not. This shape,
that is different for each location of the synergy map, is generated for each keypoint, assuming the presence
of a person, and with the knowledge of the scene geometry. Finally, the real shape and the synthetic one are
compared using a similarity measure that is similar to correlation. Another improvement proposed in this article
is the use of unsupervised clustering, performed on the measures obtained at all the keypoints. It allows to
automatically find the optimal threshold on the measure, and thus to decide about people detection. We have
compared our method to the recent state-of-the-art techniques on a publicly available dataset and have shown
that it reduces the detection errors.
1 INTRODUCTION
People detection is a well-studied issue in computer vi-
sion with applications such as in the video surveillance
systems. The challenges pertaining to people detection
include the involvement of human articulations, scale
and appearance based variations, occlusion, density,
and environment clutter. Extensive research has been
performed on the single camera human detection al-
gorithms; however, these systems remain limited in
their ability to handle occlusions, dense and cluttered
environments (Doll
´
ar et al., 2012).
Recently, researchers have focused on the multi-
view algorithms as a possible solution to overcome the
limitations of the single camera detection techniques.
Khan and Shah (Khan and Shah, 2009) present a ho-
mographic occupancy constraint and apply it across
multiple planes and camera views to obtain wrapped
foreground occupancies. They further introduce syn-
ergy map which is the fusion of the wrapped fore-
ground occupancies. This synergy map, however, suf-
fers from several false positives called ghosts. Eshel
and Moses (Eshel and Moses, 2010) perform people
detection and tracking in multiple camera systems in-
stalled at the top/head level elevations. The head de-
tection occurs by applying intensity correlation across
the head level planes that are aligned by the planar
homography constraint. This method demonstrates
increased performances but remains limited to head
level configuration.
Besides the two earlier geometric methods, the
method in (Fleuret et al., 2008) defines a Probabilistic
Occupancy Map (POM) that performs people detection
assuming rectangles of average human size placed at
a discretized ground plane. However, this method
suffers from high false positive rate and has a high
computational cost. In (Utasi and Benedek, 2011;
Utasi and Benedek, 2013), the authors improve the
localization accuracy by performing an optimization
process that fits a cylinder, modeling a person, on the
multi-planar features.
All previous methods suffer from ghosts but pro-
528
Owais Mehmood M., Ambellouis S. and Achard C..
Launch These Manhunts! Shaping the Synergy Maps for Multi-camera Detection.
DOI: 10.5220/0005355805280535
In Proceedings of the 10th International Conference on Computer Vision Theory and Applications (VISAPP-2015), pages 528-535
ISBN: 978-989-758-090-1
Copyright
c
2015 SCITEPRESS (Science and Technology Publications, Lda.)
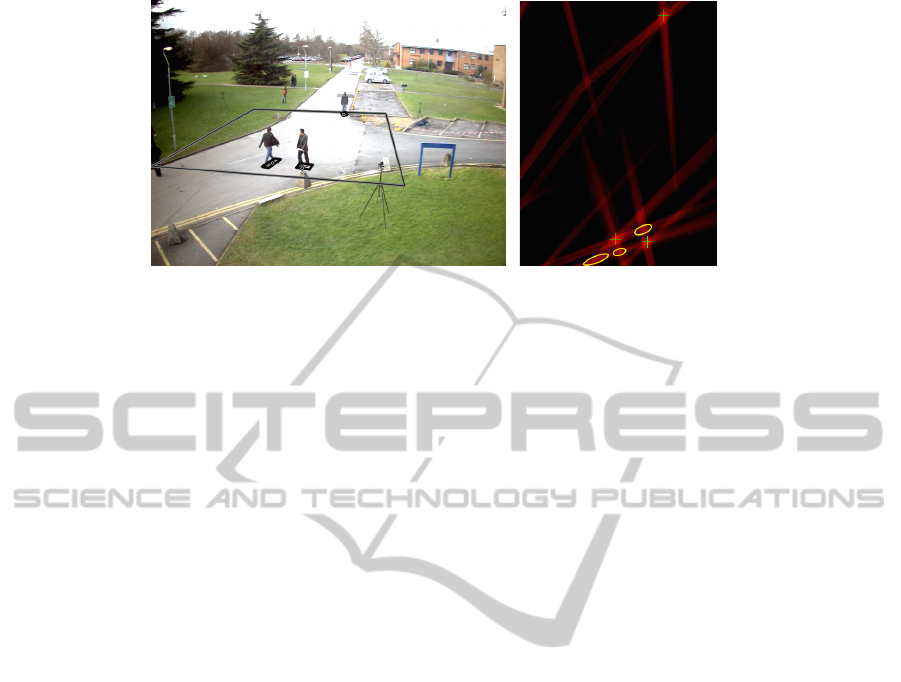
(a) Camera View 2 (b) Synergy Map
Figure 1: Synergy map generated for an area monitored in the frame 593 of PETS 2009 dataset. Brighter red indicates higher
detection probability. The positive green symbols indicate the positions of the three persons (white circles in the camera view).
The yellow ellipses correspond to the false detections. The outer rectangle represents the monitored area, and rectangles around
the people are obtained from the ground truth.
vide no explicit solution for it. For the geometric,
multi-planar or homographic techniques, fusion of the
projections corresponding to different people in the
synergy map could generate false detections, these de-
tections of non-corresponding regions in the projected
space are referred to as the ghosts. Color features have
been used to remove the incorrect correspondences
across the two camera views (Ren et al., 2012). These
features require a certain degree of color consistency
across the views. Similar to color features, background
occupancy map has been proposed in (Mehmood et al.,
2014), but the method is not robust to significant per-
spective effects. Probability of the presence of a ghost
based on the relative position of the objects from the
cameras has been explored in (Evans et al., 2012). This
method requires temporal information in order to re-
move the false detections.
We propose a novel method for people detection
across multiple synchronized views based on coher-
ence analysis. We have observed that it is possible
to generate a shape model in the synergy map based
on the location of an object in the scene. We refer to
this shape as the Synergy Shape Model (SSM). This
shape model is a map created by modeling the person
as the axis of a cylinder, at a given 3D location, fol-
lowed by the fusion of the multiplanar projections of
its synthetic images. We apply this model for ghost
pruning using a similarity measure between the SSM
and the real synergy map. The 3D locations, at which
our model is processed, are obtained by the application
of local maxima and a modified watershed transform
on the real synergy map. Thus, our algorithm is based
on the knowledge of the multi-view scene geometry.
Finally, we perform cluster analysis on the similarity
measures to automatically define the decision bound-
ary for people detection.
Our contributions include the introduction of a
technique for robust candidate detection in synergy
map, the generation of its corresponding shape model
using the knowledge of the scene geometry, and the
use of unsupervised clustering for automated optimal
threshold calculation over shape similarity measures
for multi-view people detection. Compared to the
state-of-the-art, our method, for ghost pruning, utilizes
all the camera views, including those with significant
perspective effects ignored in (Mehmood et al., 2014),
in order to achieve multi-view reasoning. The pro-
posed algorithm does not require the use of color (Ren
et al., 2012) or temporal information (Evans et al.,
2012) but analyzes the multi-view geometry. More-
over, our proposed algorithm is not limited to only one
top level camera configuration, as in (Eshel and Moses,
2010). Finally, we propose a quantitative analysis with
the state-of-the-art (Fleuret et al., 2008; Mehmood
et al., 2014; Utasi and Benedek, 2013) to demonstrate
the efficiency of our technique on a popular public
dataset (PETS, 2009). Compared to the recent state-of-
the-art (Utasi and Benedek, 2011; Utasi and Benedek,
2013), our method also requires less input parameters.
The rest of the paper is structured as follows. The
proposed approach is presented in Section 2. In Sec-
tion 3, we present the evaluation of our method, the
quantitative analysis and insights into the efficiency of
our approach. The paper concludes in Section 4.
2 PROPOSED METHOD
The proposed method makes use of the foreground
masks obtained for each image of the calibrated multi-
view systems. In the present implementation, we use
the background subtraction method proposed in (Yao
LaunchTheseManhuntsShapingtheSynergyMapsforMulti-cameraDetection
529
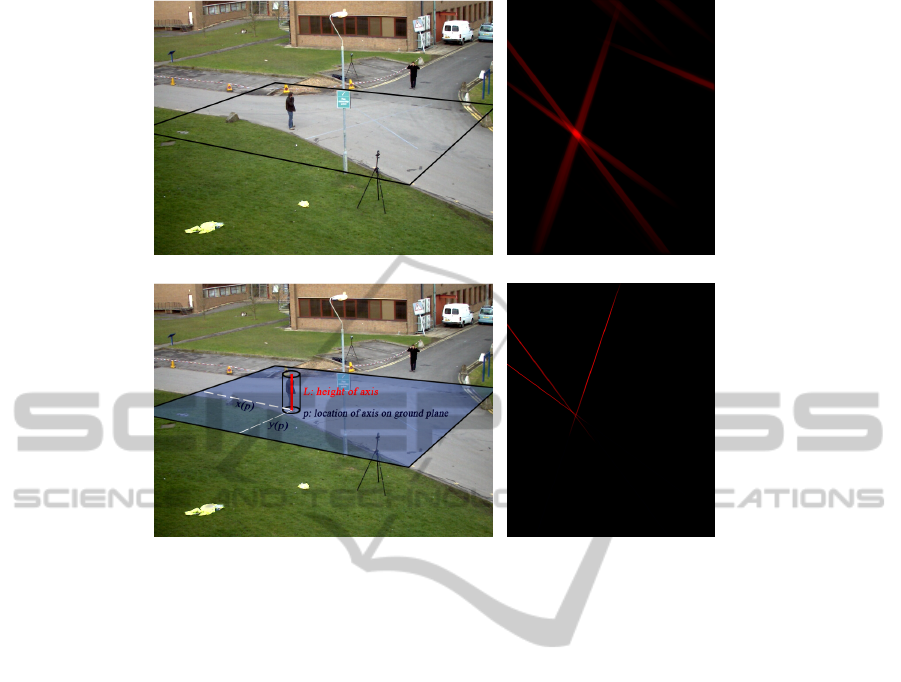
(a) Camera View 1 (b) Synergy Map
(c) Synthetic View (d) Synergy Shape Model
Figure 2: Our proposed method generates (b) a synergy map, and (d) a synthetic Synergy Shape Model against the multi-view
observations. The person visible in the Area of Interest (AOI) is modeled by the longitudinal axis of the cylinder (red). The
height of this axis is denoted by L.
and Odobez, 2007), and the camera calibration tech-
nique proposed by Tsai (Tsai, 1992). The algorithm
proceeds with the generation of foreground silhou-
ettes in each camera view. The silhouettes are pro-
jected across multiple planes parallel to the ground
plane, with heights between zero and the average hu-
man height. These projections are then merged to
produce the synergy map that has significant values at
the locations corresponding to people or ghost. As the
local shape of the synergy map is not the same in these
two cases, therefore the synthetic synergy maps corre-
sponding to an ideal person is generated and compared
to the real synergy maps using a similarity measure.
Finally, we perform cluster analysis of these similarity
measures to differentiate between the human and the
ghosts.
2.1 Multi-planar Projections & Synergy
Map
Foreground silhouette maps are projected on the planes
from the ground i.e.
P
0
to the plane
P
z
parallel to the
ground plane at height z, as shown in Fig. 3. As we
don’t have the real height of the people therefore z
takes values in the range of the typical human heights.
The projection on the ground plane i.e.
P
0
is obtained
using the camera calibration (Tsai, 1992). The projec-
tions on the parallel planes can be efficiently computed
from P
0
by using the following equations:
x
z
= x
0
− (x
0
− x
c
)z/h
c
, (1)
y
z
= y
0
− (y
0
− y
c
)z/h
c
, (2)
where
(x
c
,y
c
)
represents the arbitrary position of a
camera located at height
h
c
.
(x
z
,y
z
)
is the projection of
a point projected to the plane
P
z
and whose coordinates
are
(x
0
,y
0
)
at
P
0
(Utasi and Benedek, 2013). In case
the calibration information is not available then the
multi-planar projections can be generated using the
homography based technique as proposed in (Khan
and Shah, 2009).
Following this, a synergy map is computed by sum-
ming all the planes, and all the camera views. Fig. 1
shows an illustration of a synergy map which was
generated using three camera views and 211 differ-
ent planes between 0 and 210 cm. It is possible that
the foreground masks of a particular camera may be
missing information, for example, due to occlusion,
clutter, or inconsistencies in the generation of the fore-
grounds (Cristani et al., 2010). The fusion of the in-
formation present across all the camera views and in-
VISAPP2015-InternationalConferenceonComputerVisionTheoryandApplications
530
cluding multiple heights introduces robustness to such
corruption, which may arise in an individual camera
view or at a particular planar height. As specified be-
fore, significant values in the synergy map correspond
to the people or ghosts. These values are produced by
a chance alignment of projections coming from sev-
eral people, as it can be seen in Fig. 1. Our algorithm
proceeds by extracting the locations of the synergy
map with the significant values namely the keypoint
extraction.
2.2 Keypoint Extraction
Keypoints are extracted as the local maxima in the
synergy map
R
calculated using 8
×
8 pixel blocks. In
order to reduce multiple detections due to intensity
variations and noise, we use a modified version of
the watershed transform with markers (Beucher and
Meyer, 1993). This keeps the pedestrian population
tractable and results in a compact description of the
global scenario that can be further analyzed.
We sort the local maxima in descending order and
invert them to define our markers. The general water-
shed algorithm defines catchment basins or watershed
regions, which are separated by the watershed lines.
The watershed lines in our case are defined relative
to the local maxima, that is, we introduce a tolerance
threshold
τ
such that a local maxima is a keypoint if
and only if the pixels in the catchment basin — pixels
greater than the difference of the maxima and toler-
ance — around the local maxima are less than itself.
This can also be understood as that the local maximum
is accepted only if its topographical prominence is
greater than the tolerance threshold. Further, if there
exist multiple similar local maxima in one catchment
basin then we define the keypoint at their geometric
center. We have shown a 1D illustration of this process
in Fig. 4. Finally, we obtain a set
P = {p
n
},n = 1 ...N
,
of N keypoints that can correspond to people or ghost.
h
c
(x
c
,y
c
)
(x
0
,y
0
)
z
(x
z
,y
z
)
L
Figure 3: Projection of the cylindrical axis of height L
(green), corresponding to a person, to the ground (blue)
and a parallel plane at height z (red).
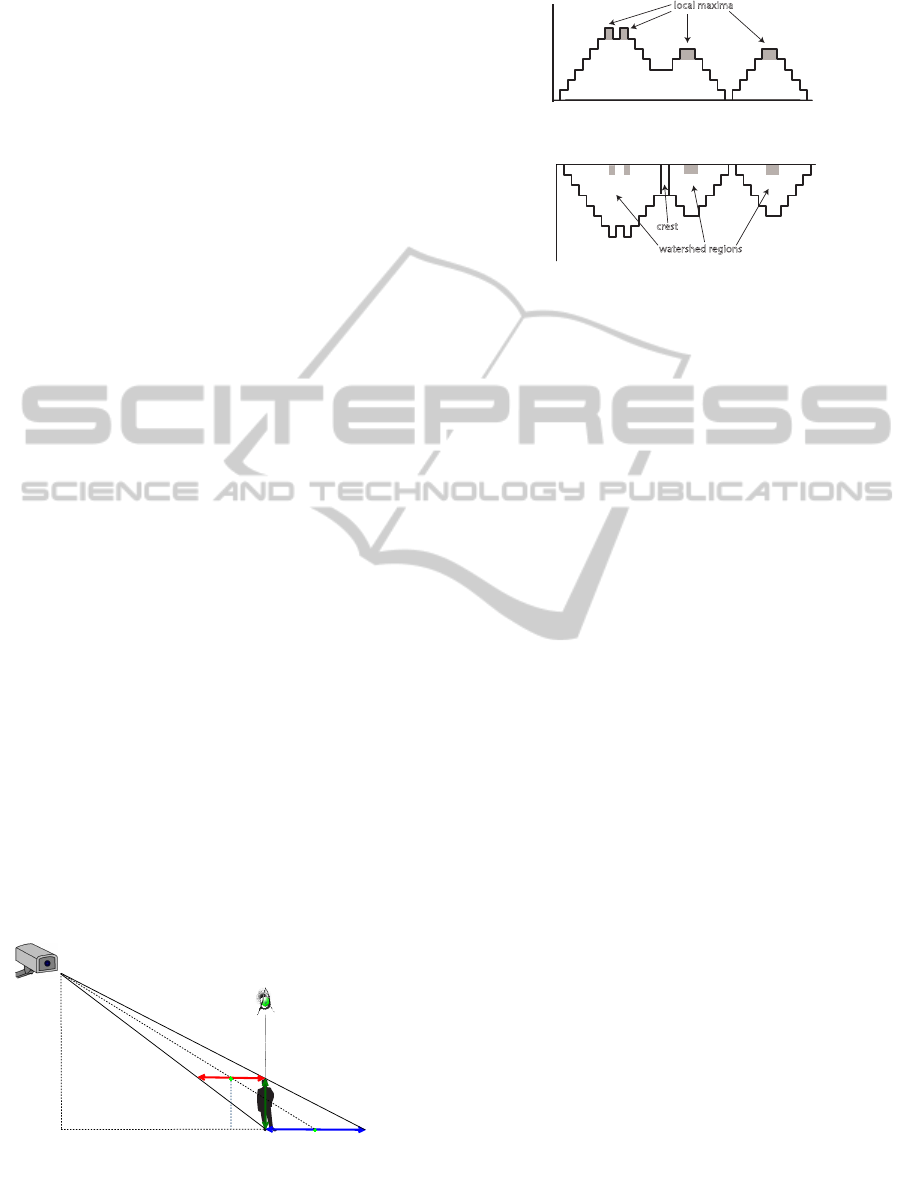
D
x
local maxima
(a)
watershed regions
crest
1
2
3
x x x
D
x
(b)
Figure 4: One-dimensional illustration of the keypoint ex-
traction based on the watershed transform applied to the
local maxima. (a) Local maxima are extracted on an arbi-
trary distance field D. (b) Inverted local maxima are treated
as markers on which the marker based watershed transform
is applied. The crest here acts as the watershed line and
is defined by the
τ
parameter. The local maxima must be
the greatest value in its region. In case of multiple similar
local maxima, the geometric center is taken as the keypoint
location.
2.3 Ghost Pruning
Some false positives or ghosts appear in the set of key-
points obtained (see Fig. 1). Several methods have
already been proposed in the literature to remove them.
Evans et al. (Evans et al., 2012) found that the ghost
detections are probable along the lines from the camera
center to the center of the objects of interest, intuited
as “star” shape at the object, having “streaked legs”
corresponding to the lines (see Fig. 2(d)). In this work,
we propose a novel model that plays a role in ghost
pruning using the shape cues defined around these
“star” shapes and “streaked legs”. Liu et al. (Liu et al.,
2013), for robust auto-calibration, models the pedes-
trian blobs using two end points of the axes of the
ellipses, represented by the vanishing point and esti-
mating the 3D blob heights resembling the real world
distribution of human heights.
Following this, we define a shape for each person,
represented by the longitudinal axis of a cylinder in the
3D coordinate system of the scene. Let us assume that
the people are standing on a flat ground. We monitor
a rectangular Area of Interest (AOI) in the
P
0
ground
plane, and we attempt to model the shape of each
possible pedestrian in
P
. Thus, the free parameters
of the given longitudinal axis of the cylinder are its
p = (x,y)
coordinate in the ground plane and the length
L. This is illustrated in Fig. 2.
We employ a discrete space of objects in the ground
plane of the AOI, consisting of
S
W
× S
H
locations. For
each keypoint
p
n
detected in this space, synthesized
LaunchTheseManhuntsShapingtheSynergyMapsforMulti-cameraDetection
531
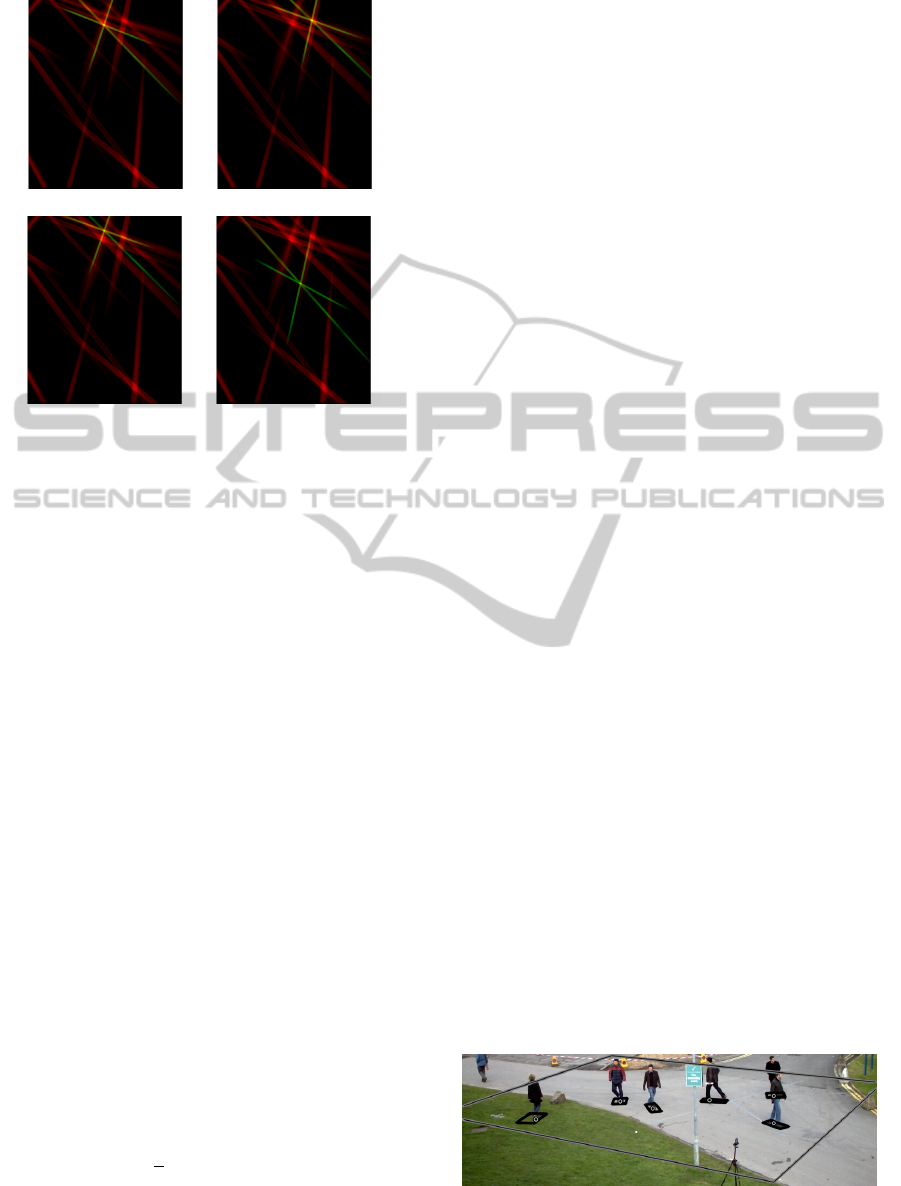
(a) Person (b) Person
(c) Ghost (d) Ghost
Figure 5: Illustration of the proposed method on frame 593
of the PETS 2009 dataset. The Synergy Shape Model is
represented by the green colour whereas the synergy maps
are red. It can be observed that the overlap between two is
higher for the persons (a),(b), versus the ghosts (c),(d).
camera view
I
n,c
, corresponding to its approximated
cylindrical axis, are generated using the camera cal-
ibration matrices i.e. in this case for the cth camera.
Let
I
n
denote the set of synthetic images created for
the keypoint p
n
:
I
n
= {I
n,c
}, c = 1 . . .C. (3)
In this paper, we use the fact that a person generates
not only a significant value in the synergy map but also
a particular shape around this point — a shape that is
not present in case of a ghost (see Fig. 5). This shape
is given by the geometry of the cameras and is always
the same for a point in the ground plane. Thus, a way
to decide if the keypoint is a people or a ghost is to
analyze this shape. Therefore, for each keypoint
p
n
,
we generate a synthetic synergy map
S
n
, the SSM,
that corresponds to the synergy map to be observed
if a person is present at the location
p
n
: the person
is modelled by a vertical line, the axis of a cylinder,
with height L (see Fig. 2). The synthetic images
I
n
corresponding to this line are then fused to create the
synthetic synergy map. By comparing
S
n
to the real
synergy map
R
, we can conclude on the similarity
between the shapes and thus, on the detection:
D(R ,S
n
) =
1
γ
∑
p
[min(R (p),S
n
(p))], (4)
here
γ
is the sum of
S
n
(p)
over all pixel locations
of the synergy map. This can be understood as confi-
dence of the hypothesis that a person is present at the
keypoint p
n
.
2.4 People Detection
Given the similarity measures distribution over all
dataset, we can proceed towards univariate cluster
analysis to group the similarity measures into class
intervals corresponding to people and ghosts. Due
to cluster analysis, the decision threshold for a key-
point
p
n
, to be a person or a ghost, is automatically
computed. Most clustering or vector quantization algo-
rithms can be classified into partitional or hierarchical
algorithms. Hierarchical clustering algorithms do not
require pre-specification of the number of clusters, are
primarily deterministic, but computationally expen-
sive. Partitional or flat clustering algorithms define a
set of disjoint clusters and are suited for large datasets
where computational efficiency is important. How-
ever, as no consensus is present on this issue (Manning
et al., 2008), therefore, we use both partitional and
hierarchical methods.
For hierarchical clustering, we use the Unweighted
Pair Group Method with Arithmetic Mean (UPGMA)
agglomerative clustering method (Sokal and Michener,
1958). We use Euclidean distance for the generation
of the distance matrix. Hierarchical clustering is more
suited to our univariate data because it doesn’t have
enough structure, relative to multi-dimensional data,
and the computational costs are not important. We se-
lect UPGMA clustering because it provides a suitable
trade-off between the complete-link method’s sensitiv-
ity to outliers and that of single-link to form dendo-
gram chains longer than the intuitive notion of com-
pact, spherical clusters. The work in (Li et al., 2008)
also selects agglomerative clustering technique for hu-
man detection in 3D space.
For partitional clustering, we use univariate Kernel
Density Estimation with Epanechnikov kernel (Scott,
1992) and Mixture of Gaussians Expectation Maxi-
mization (MoG-EM) method (univariate, unequal vari-
ance) (Fraley and Raftery, 2007). For KDE, we use
the local minimum to separate the clusters. In case
of MoG-EM algorithm, we assume as a priori that
the number of real objects exceed ghosts, hence we
Figure 6: Estimated locations of the people localized, repre-
sented by the white circles surrounded by the ground truth
rectangles.
VISAPP2015-InternationalConferenceonComputerVisionTheoryandApplications
532
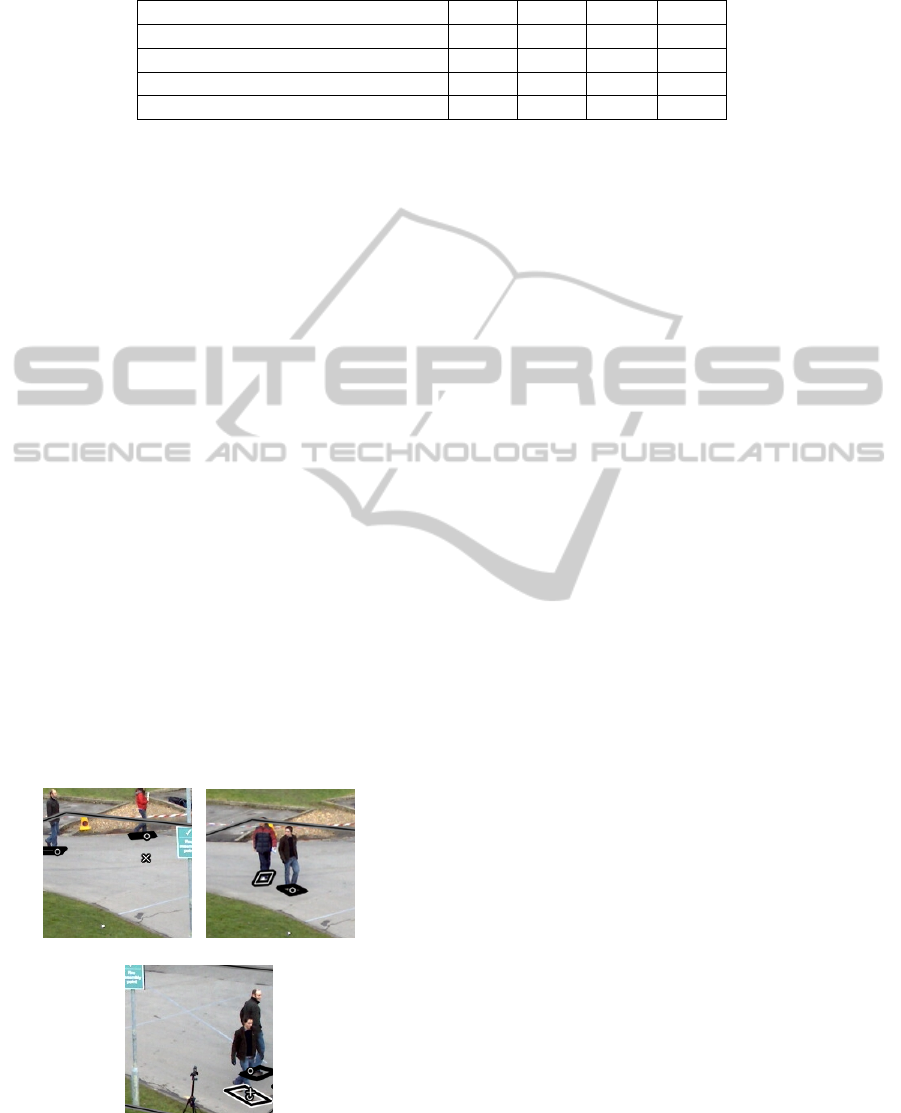
Table 1: Comparison of proposed SSM with other techniques using the best parameters to minimize TER. Parameters:
τ
= 31
pixels, L = 175 cm.
Method TER FDR MDR MIR
POM (Fleuret et al., 2008) 0.252 0.179 0.073 0.000
BOM (Mehmood et al., 2014) 0.123 0.029 0.094 0.000
3DMPP (Utasi and Benedek, 2013) 0.122 0.020 0.096 0.006
Prop. SSM 0.076 0.025 0.051 0.000
can have a distribution for ghosts with lower variance,
centred around a mean corresponding to the lower
measure of similarity.
In terms of parameters, hierarchical clustering is
the most suited because KDE requires a bandwidth
specification, while a prior has been defined in the
case of MoG-EM method. For all three methods, we
know that the data must be divided into two classes or
clusters. We present the three algorithms as a more fair
means of demonstrating the application of clustering
on our univariate data.
3 EXPERIMENTS
We have compared our method to the state-of-the-art
techniques: POM (Fleuret et al., 2008), 3D Marked
Point Process (3DMPP) model (Utasi and Benedek,
2013), and Back-projected Occupancy Map (BOM)
(Mehmood et al., 2014). For the evaluation of these
methods we have used a subset of City center se-
quence from PETS 2009 dataset (PETS, 2009) as de-
fined in (Utasi and Benedek, 2011; Utasi and Benedek,
2013). The evaluation sequence contains 400 outdoor
scene images obtained from three camera views. The
dataset defines an overlapping AOI of size 12.2 m
×
14.9 m, for which the ground truth annotations are
(a) False Detection (b) Missed Detection
(c) Multiple Instances
Figure 7: Examples of detection errors. (a) false detection
(white cross), (b) missed detection (white rectangle), and (c)
multiple detections (white circle and positive symbol).
also provided. Camera calibration and time synchro-
nization errors are present in the dataset (PETS, 2009;
Utasi and Benedek, 2013) which explains the non-
convergence of the three lines to one point, for exam-
ple, in Fig. 2(d). The maximum number of people
simultaneously monitored in the AOI is 8. For POM,
we report the best results from (Utasi and Benedek,
2013).
For numerical comparison, we use the projected
position error metrics as defined in (Utasi and Benedek,
2013). False detections (FDs) is the count of de-
tections not corresponding to the ground truth (see
Fig. 7(a)). Missed detections (MDs) is the count of
ground truths not detected (see Fig. 7(b)). Multiple
instances (MIs) is the count of multiple estimates as-
signed to the ground truths (see Fig. 7(c)). Total error
(TE) is the sum of FDs, MDs, and MIs.
FDs, MDs, MIs, and TE are expressed in the per-
cent of the number of objects thus the false detections
rate (FDR), missed detections rate (MDR), multiple
instances rate (MIR), and the total error rate (TER).
Here, MDR
≤
1 and MIR
≤ 1
, but FDR and hence
TER may exceed 1.
Proposed Method.
The foreground masks are gener-
ated using the default parameters as defined in (Yao
and Odobez, 2007). For visualization, the results are
back projected to all of the camera views, for exam-
ple, the first camera view in Fig. 6. Multi-planar pro-
jections are generated at a constant 2 cm resolution.
For similarity with (Fleuret et al., 2008; Utasi and
Benedek, 2011; Utasi and Benedek, 2013), we fix
the height L to 175 cm, and the SSM is generated
for 56 different planes between 155 and 210 cm (see
Fig. 2(d)). The proposed method has two main pa-
rameters: tolerance threshold
τ
and height L of the
cylindrical axis. Compared to the evaluation of sev-
eral parameters in (Utasi and Benedek, 2011; Utasi
and Benedek, 2013), we have reduced our algorithm
to only one parameter. Therefore, our evaluation of
the proposed algorithm is limited to
τ
. For the cluster
analysis, hierarchical clustering is sufficient (Li et al.,
2008) but we also present the results of other methods.
Similarly, we also show the effect of assigning a value
other than 175 cm to L.
Quantitative Comparison.
We report the evaluation
results for our algorithm in Tab. 1. Considering TER,
LaunchTheseManhuntsShapingtheSynergyMapsforMulti-cameraDetection
533
20 21 22 23 24 25 26 27 28 29 30 31 32 33 34 35 36 37 38 39 40
8
10
12
14
16
18
20
22
24
26
28
τ (pixels)
TER (%)
L=165 cm
L=175 cm
L=185 cm
(a)
40 50 60 70 80 90 100
90
92
94
96
98
100
Recall
Precision
L=165 cm
L=175 cm
L=185 cm
τ=31 pixels
(b)
0 0.1 0.2 0.3 0.4 0.5 0.6 0.7 0.8 0.9 1
0
0.2
0.4
0.6
0.8
1
False positive rate
True positive rate
L=165 cm
L=175 cm
L=185 cm
τ=31 pixels
(c)
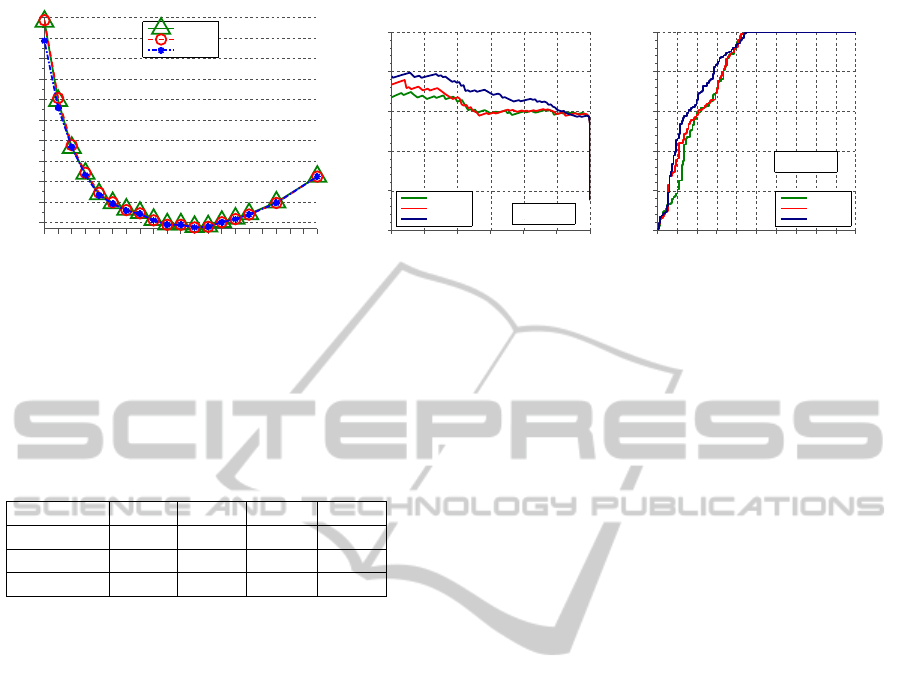
Figure 8: Evaluation of the proposed Synergy Shape Model with different parameter settings. (a) Total Error Rate (TER) as a
function of the
τ
and L parameters. (b) Precision/Recall curves and (c) Receiver Operating Characteristic (ROC) curves in
function of L.
Table 2: Comparison of the different clustering techniques.
The best parameters for minimum TER are used. Parameters:
τ
= 31 pixels, L = 175 cm, and for KDE, the bandwidth of
the kernel is 0.04.
Method TER FDR MDR MIR
KDE 0.077 0.026 0.051 0.000
MoG-EM 0.076 0.025 0.051 0.000
UPGMA 0.076 0.025 0.051 0.000
we observe a 4.6% improvement versus 3DMPP, 4.7%
versus BOM, and 12.9% versus POM. It can be ob-
served from Tab. 2 that the results remain consistent
in spite of the clustering technique used.
For the proposed SSM model, Fig. 8(a) shows TER
plotted as a function of
τ
and L parameters. We ob-
serve that the TER depends mainly on
τ
parameter.
Higher values of
τ
tend to merge all the keypoints, and
the lower values tend to introduce multiple keypoints
for one “star” shape. We also observe that our method
provides improved robustness to MIR, for example,
negligible MIs for the different parameter combina-
tions used, which is not the case with the radius of
cylinder used in (Utasi and Benedek, 2011; Utasi and
Benedek, 2013).
Fig. 8(b) demonstrates the Precision/Recall curves
for different L values. One of the intuitions of the
SSM is the reasonable reduction of FDR, therefore
we present the ROC curves in Fig. 8(c). It should be
noted that the number of primitives, including those
missed, vary for each value of
τ
. Therefore, the Preci-
sion/Recall and ROC curves demonstrate the overall
performance of the shape matching, demonstrated by
fixing the primitives and varying the decision bound-
aries whereas the Tab. 1 and Fig. 8(a) present the over-
all performance of our system.
4 CONCLUSION
We have presented a multi-camera system to robustly
detect people using the knowledge of the scene geom-
etry. We employ a well-known technique that projects
and merges all the views on the ground plane and
the planes parallel to it, called the synergy map. The
moving objects produce significant values in the syn-
ergy map, and also a particular shape around it. The
popular solution to threshold the synergy map has a
drawback: ghosts are detected at locations where sev-
eral shapes induced by different people overlap. This
article proposes a solution to avoid this drawback, so
at each candidate detection, we verify if the particular
shape for an ideal person is present. This idea has
been implemented, and we focus on the two tasks in
this article: (i) how to find the points corresponding
to potential candidates; (ii) which tolerance can be ac-
cepted when studying the shape around the candidate
detection. Quantitative results on a challenging dataset
demonstrate the performance of this approach, includ-
ing a comparison with the state-of-the-art techniques.
In the future, we propose to extend this approach by
performing 3D modelization of the shape produced by
a moving person.
ACKNOWLEDGEMENTS
The research leading to these results has received fund-
ing from the French FUI framework DeGIV.
VISAPP2015-InternationalConferenceonComputerVisionTheoryandApplications
534

REFERENCES
Beucher, S. and Meyer, F. (1993). The morphological ap-
proach to segmentation: the watershed transformation.
Mathematical morphology in image processing. Opti-
cal Engineering, 34:433–481.
Cristani, M., Farenzena, M., Bloisi, D., and Murino,
V. (2010). Background subtraction for automated
multisensor surveillance: A comprehensive review.
EURASIP Journal on Advances in Signal Processing,
2010(1):343057.
Doll
´
ar, P., Wojek, C., Schiele, B., and Perona, P. (2012).
Pedestrian detection: An evaluation of the state of the
art. PAMI, 34.
Eshel, R. and Moses, Y. (2010). Tracking in a dense crowd
using multiple cameras. International Journal of Com-
puter Vision, 88(1):129–143.
Evans, M., Li, L., and Ferryman, J. (2012). Suppression of
detection ghosts in homography based pedestrian detec-
tion. In Advanced Video and Signal-Based Surveillance
(AVSS), 2012 IEEE Ninth International Conference on,
pages 31–36.
Fleuret, F., Berclaz, J., Lengagne, R., and Fua, P. (2008).
Multicamera people tracking with a probabilistic occu-
pancy map. Pattern Analysis and Machine Intelligence,
IEEE Transactions on, 30(2):267–282.
Fraley, C. and Raftery, A. E. (2007). Bayesian regulariza-
tion for normal mixture estimation and model-based
clustering. J. Classif., 24(2):155–181.
Khan, S. and Shah, M. (2009). Tracking multiple occluding
people by localizing on multiple scene planes. Pattern
Analysis and Machine Intelligence, IEEE Transactions
on, 31(3):505–519.
Li, Y., Wu, B., and Nevatia, R. (2008). Human detection by
searching in 3d space using camera and scene knowl-
edge. In Pattern Recognition, 2008. ICPR 2008. 19th
International Conference on, pages 1–5.
Liu, J., Collins, R. T., and Liu, Y. (2013). Robust auto-
calibration for a surveillance camera network. IEEE
Winter Conference on Applications of Computer Vision,
0:433–440.
Manning, C. D., Raghavan, P., and Sch
¨
utze, H. (2008). In-
troduction to Information Retrieval. Cambridge Uni-
versity Press, New York, NY, USA.
Mehmood, M. O., Ambellouis, S., and Achard, C. (2014).
Ghost pruning for people localization in overlapping
multicamera systems. In VISAPP (2), pages 632–639.
PETS (2009). Pets dataset: Performance
evaluation of tracking and surveillance.
http://www.cvg.rdg.ac.uk/PETS2009/a.html. [Online].
Ren, J., Xu, M., and Smith, J. (2012). Pruning phantom de-
tections from multiview foreground intersection. In Im-
age Processing (ICIP), 2012 19th IEEE International
Conference on, pages 1025–1028.
Scott, D. W. (1992). Multivariate Density Estimation: The-
ory, Practice, and Visualization. Wiley, 1 edition.
Sokal, R. R. and Michener, C. D. (1958). A statistical method
for evaluating systematic relationships. University of
Kansas Scientific Bulletin, 28:1409–1438.
Tsai, R. Y. (1992). Radiometry. chapter A Versatile Camera
Calibration Technique for High-accuracy 3D Machine
Vision Metrology Using Off-the-shelf TV Cameras and
Lenses, pages 221–244. Jones and Bartlett Publishers,
Inc., USA.
Utasi, A. and Benedek, C. (2011). A 3-d marked point pro-
cess model for multi-view people detection. In Com-
puter Vision and Pattern Recognition (CVPR), 2011
IEEE Conference on, pages 3385–3392.
Utasi, A. and Benedek, C. (2013). A bayesian approach on
people localization in multicamera systems. Circuits
and Systems for Video Technology, IEEE Transactions
on, 23(1):105–115.
Yao, J. and Odobez, J. (2007). Multi-layer background
subtraction based on color and texture. In Computer
Vision and Pattern Recognition, 2007. CVPR ’07. IEEE
Conference on, pages 1–8.
LaunchTheseManhuntsShapingtheSynergyMapsforMulti-cameraDetection
535
