
Managing Service Quality of Self-Service Technologies to Enhance
e-Satisfaction in Digital Banking Context
The Roles of Technology Readiness and Perceived Value
Sakun Boon-itt
Department of Operations Management, Thammasat Business School, Bangkok, Thailand
Keywords: Service Quality, e-Commerce, Self-Service Technology, Digital Banking, Service Operations.
Abstract: Perceived service quality, value, and customer satisfaction have long been regarded as the most important
research topics in services marketing and service operations literature. Although the self-service technologies
(SSTs) are deliberately designed to improve quality and contain necessary information to serve customer
needs, service quality of SSTs (SQ-SSTs) has not yet been well achieved up to standards of performance. By
integrating the self-service technology adoption and technology acceptance models, this study address SQ-
SSTs by empirically testing a comprehensive model that capture the comprehensive model of SQ-SSTs to
predict e-satisfaction in the context of digital banking in Thailand. The results show that technology readiness
(TR) has the influence on SQ-SSTs, which in turn improve e-satisfaction. The study also found that even
though SQ-SSTs can positively influence e-satisfaction, perceived value partial mediates the link between
SQ-SSTs and e-satisfaction. The findings contribute to the literature in information system and service
marketing by highlighting a key mechanism through which firms can enhance service quality of self-service
technologies (SQ-SSTs) and e-satisfaction. Managers may therefore particularly wish to consider technology
readiness and customers’ perceived value when trying to offer SSTs.
1 INTRODUCTION
Perceived service quality, value, and customer
satisfaction have long been regarded as the most
important research topics in services marketing and
service operations literature (Cronin et al., 2000).
This development does not only have an effect on
brick and mortar stores, but also in an electronic
commerce (e-commerce) context. Most often,
although the self-service technologies (SSTs) are
deliberately designed to improve quality and contain
necessary information to serve customer needs,
service quality of SSTs (SQ-SSTs) has not yet been
well achieved up to standards of performance. As a
consequence, a lack of SQ-SSTs, which in sequence
negatively affects customer satisfaction in an e-
commerce business (i.e., e-satisfaction), ultimately
leads to unfavourable economic performance. While
many firms invested heavily in SSTs, most have also
failed to reap the anticipated SQ-SSTs and e-
satisfaction (Colla and Lapoule, 2012).
These findings have sparked interest in how
firms can successfully and effectively increase SQ-
SSTs in order to enhance e-satisfaction and maximize
benefits in e-commerce activities (Mohammadi,
2015). The goal of this study is to expand the
understanding of how managers can effectively
develop and manage SSTs to enhance customer e-
satisfaction, particularly in the digital banking
context. This study defines digital banking as “an
internet portal to both online and mobile banking,
through which customers can use different kinds of
banking services”. It mainly focuses on SSTs in the
banking industry whereby customers fulfil their
transactions without any interaction with, or
assistance from, bank employees. For example,
customers in the banking industry can check their
account balance on their mobile phone or PDA, make
a loan payment at an ATM, and open a new account
at a self-service terminal. Banking SSTs can help
customers to produce and consume services from the
banks without direct personal contact with any
representatives (Meuter et al., 2000; Martins et al.,
2014). This study initially develops a theoretical
model and then constructs the hypotheses. A report of
the empirical study follows this and the paper
602
Boon-itt S..
Managing Service Quality of Self-Service Technologies to Enhance e-Satisfaction in Digital Banking Context - The Roles of Technology Readiness and
Perceived Value.
DOI: 10.5220/0005351306020609
In Proceedings of the 17th International Conference on Enterprise Information Systems (ICEIS-2015), pages 602-609
ISBN: 978-989-758-097-0
Copyright
c
2015 SCITEPRESS (Science and Technology Publications, Lda.)

concludes with a discussion of the implications of the
findings and future research.
2 THEORETICAL
BACKGROUND AND
RESEARCH HYPOTHESES
The theoretical model of this research has established
on both SST adoption model and some specific
applications of technology acceptance model (TAM).
The application of TAM model establishes the
theoretical background to explain the effects of
technology readiness (TR), service quality of self-
service technologies (SQ-SSTs), and perceived value
on e-satisfaction. In addition, the SST adoption model
is used to capture the antecedents and consequences
of service quality to predict e-satisfaction in the self-
service technology context. This study argues that TR
is the driver that can enhance SQ-SSTs. Some SSTs
do not successfully gain adoption with an acceptable
service quality because service providers do not take
into consideration that customer participation through
TR is involved, according to the SST adoption model.
Furthermore, while the direct impacts of SQ-
SSTs on e-satisfaction have been previously studied
(Lin and Hsieh, 2006), the indirect effect is currently
less understood. Baron and Kenny (1986) recommend
the introduction of a mediator when such a strong
relationship between the predictor and criterion
variable exists. With regard to the importance of
perceived value and service quality in the context of
SSTs, it might be reasonable to analyse the possibility
that perceived value intervenes between SQ-SSTs
and e-satisfaction to gain deeper insights into how the
mediating effect exists. The hypothetical
relationships illustrated in the model are further
explained in the next sections.
2.1 Technology Readiness as an
Antecedent to Service Quality of
SSTs
Technology readiness (TR) identifies the ability of
each person to adopt the new technologies to achieve
goals in life. Technology can create both a positive
and negative impact because of an effect of TR on
belief and behavior of both customers’ direct and
indirect technology usage. Parasuraman (2000)
indicates that there are four dimensions of TR,
including both positive and negative feelings of
technology usage. Optimism is a positive relationship
to technology. The customer believes that the
technology can be controlled and is flexible to use,
convenient, and effective (Parasuraman, 2000).
Innovativeness is also a positive factor that represents
the willingness of a person to use new technology.
Discomfort is described as the perceived lack of
control and a feeling of being overwhelmed by
technology. Finally, insecurity is the result of a lack
of trust in technology and its ability to work properly
(Parasuraman, 2000). A customer with optimism and
innovativeness and little discomfort and insecurity is
more likely to use a new technology, including SSTs.
According to Lin and Hsieh (2006), TR is an
important driver of SQ-SSTs. That is to say, the
higher the technology readiness, the higher the
perceptions of service quality will be when using
SSTs. Chen et al. (2009) also pinpoints that SST
service providers should stimulate the positive drivers
of TR in order to attain business goals for satisfying
customers and increasing benefits. TR is able to
lessen the difficulty of service delivery by mitigating
the difficulty in evaluating outcomes. In addition,
Vize et al. (2013) found a significant role played by
TR in customers’ perceptions about the level of SQ-
SSTs (i.e., web-based solutions). So it can be
expected that higher levels of TR will lead to the
customer viewing the quality of the services received
from the SSTs as higher. This study may surmise that
when customers use SSTs, the TR (i.e., negative or
positive feeling) will influence service quality of
SSTs with the encounter. This suggests that:
H1: Technology readiness positively influences
service quality of SSTs
2.2 Service Quality of SSTs
and e-Satisfaction
According to Anderson and Srinivasan (2003),
satisfaction is the overall subsequent psychological
state following the appraisal of the consumer
experience against prior expectations. In the e-
commerce context, Wang et al. (2001) propose a
construct called, “customer information satisfaction”
(CIS) for web sites that market digital products and
services. They define CIS as a summary affective
response of varying intensity that follows
consumption, and is stimulated by focal aspects of
sales activities, information systems (websites),
digital products/services, customer support, after-
sales service, and company culture. Similarly,
Anderson and Srinivasan (2003) defines e-
satisfaction as consumers’ judgment of their internet
retail experience compared to their experience with
other online or traditional retail stores.
Drawing on insights from the literature on
ManagingServiceQualityofSelf-ServiceTechnologiestoEnhancee-SatisfactioninDigitalBankingContext-TheRoles
ofTechnologyReadinessandPerceivedValue
603

determinants and consequences of SST use (Chen et
al., 2009), this study further suggests investigating the
SQ-SSTs as a determinant of e-satisfaction. This is
further supported by research on service quality, in
particular online service quality (Lee and Yang,
2013). The preceding studies support the notion that
favourable service quality leads to high customer
satisfaction. The justification of this relationship is
that satisfaction is an affective reaction. Hence,
satisfaction is a post consumption experience, which
compares perceived quality with expected quality.
Similar to the previous literature cited above, this
study views service quality of SSTs as an antecedent
to e-satisfaction. Thus, in keeping with the above
argument, this hypothesis was developed:
H2: Service quality of SSTs is positively associated
with e-satisfaction.
2.3 Effects of Perceived Value
on e-Satisfaction
In the online service quality literature, empirical
evidence shows that customer perceived value leads
to e-satisfaction (Hsu et al., 2013). Customers’
perception of service value is closely related to their
awareness of the exceptional value they have received
from a service exchange with a service provider, and
how customer e-satisfaction reflects the customer’s
overall feeling derived from that value. In a customer-
technology interaction context, these are the
consequences of the perception of customer value
received from the SSTs. Prior studies have shown that
perceived value has a significant effect on user
satisfaction in the context of e-commerce (Chiu et al.,
2009). Shamdasani et al. (2008) also confirmed that
perceived value plays a particularly important role in
influencing satisfaction in the context of self-service
internet technologies. The hypothesis is thus derived
as follows.
H3: Perceived value is positively associated with e-
satisfaction.
2.4 Effects of Service Quality of SSTs
on Perceived Value
The previous literature suggests that customers
generally acknowledge service value through a
desired purpose or goal achieved. Holbrook (2006)
define customer perceived value as an interactive
relativistic preference experience that involves an
interaction between an object and a subject.
According to Chang and Wildt (1994), customer
perceived value is a critical factor influencing
customer retention and purchase intention.
SSTs mean a technology interface that enables
customers to access a service independently of direct
service employee involvement. The service providers
can offer SSTs to enrich customers’ experience,
reduce employee related expenses, and keep up with
technological advancement. SQ-SSTs can impact on
perceived value. For example, Ho and Ko (2008)
found that SQ-SSTs have a strong relationship with
perceived value. Perceived value increases when an
SST can enrich customers’ experience (e.g.
functionality, convenience, enjoyment, security,
design, customization, and assurance) of using SSTs.
Customers perceive a value of using SSTs through a
learning curve associated with a satisfying encounter
with the technology. The benefits the customers enjoy
include ease of using the SSTs, avoiding interaction
with service employees, time and cost savings, the
capability of SSTs to immediately solve problems,
and how SSTs live up to the customers’ expectations.
If customers agree with the benefits and advantages
from their perceived service quality of a SST, they
will develop a favourable attitude and will be likely
to perceive a higher level of value evaluation.
Therefore, the following hypothesis is suggested.
H4: Service quality of SSTs is positively associated
with perceived value.
2.5 The Relationship between Service
Quality of SSTs, Perceived Value
and e-satisfaction
Prior literature suggests that SQ-SSTs do not
necessary lead to performance in the form of e-
satisfaction; many firms that have invested heavily in
SSTs have failed to experience the benefits. This
study therefore argues that SQ-SSTs influence e-
satisfaction when customers perceive the value
evaluation of the SSTs. Lin et al. (2006) identified a
direct relationship between SQ-SSTs and e-
satisfaction. However, it is found that the indirect
effect is currently less understood. Without taking
perceived value into account, the predictive power of
SQ-SSTs on e-satisfaction is questionable. SQ-SSTs
are expected to explain both perceived value and e-
satisfaction directly; in addition to its influence on e-
satisfaction through perceived value as a mediator.
Note that this evidence supports the argument of the
importance of the measurement of perceived value in
conjunction with the measurement of satisfaction by
Oh (2000) and Chen (2008). Instead of the direct
effect, SQ-SSTs might have an indirect effect on e-
ICEIS2015-17thInternationalConferenceonEnterpriseInformationSystems
604
satisfaction through perceived value. Since previous
studies have not tested this indirect relationship
properly Therefore, the following hypothesis is
suggested.
H5: Perceived value mediates the relationship
between service quality of SSTs and e-satisfaction.
3 RESEARCH METHODOLOGY
AND ANALYSIS
3.1 Sample and Data Collection
An online survey was used to collect data using the
context of digital banking in Thailand. The people
who use digital banking are the targeted research
subjects. The respondents who have a complete
digital banking experience on both online and mobile
banking, not just interaction with the website were
selected using a convenience sampling method.
Therefore, all samples were expected to be collected
from the online survey and sought to generate 500
respondents. The survey was kept running
continuously for three weeks for the first round, and
for another two weeks for the second. Final figures
were 149 responses from the first batch of
questionnaire collection, and 73 additional responses
from the second. Finally, this study achieved a total
of 222 returned responses.
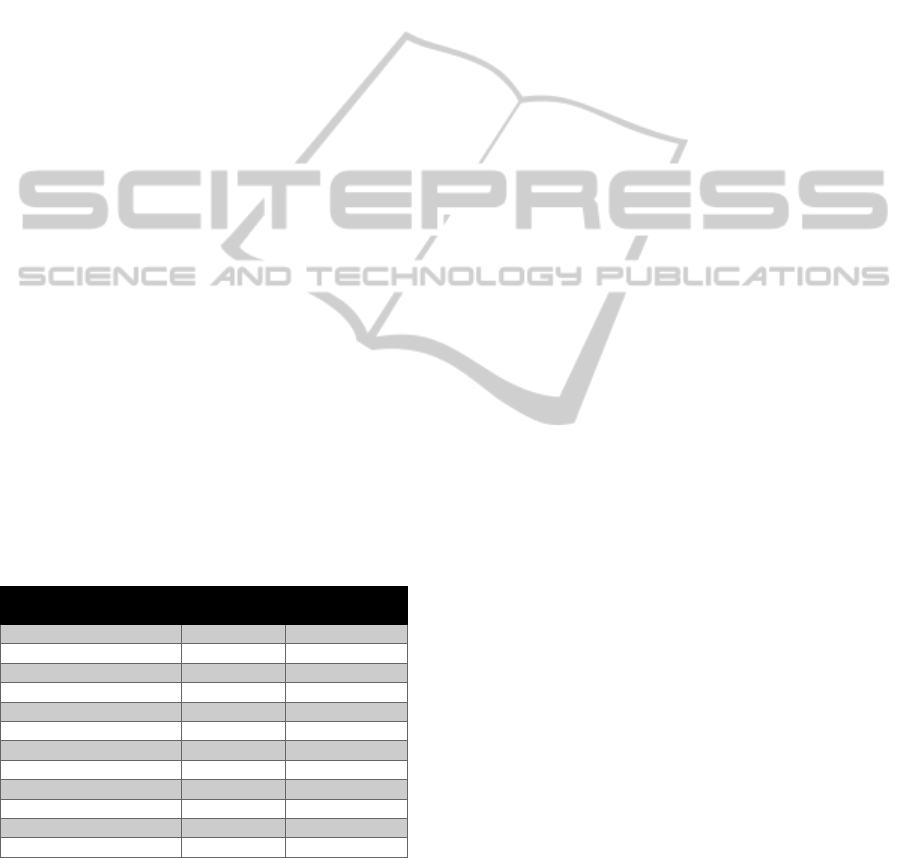
The demographic characteristics of the
respondents included in this research are shown in
Table 1.
Table 1: Respondent characteristics.
Respondent profile Number Percentage
(%)
Digital banking type
Internet banking
140 63
Mobile banking
82 37
Gender
Male
91 41
Female
131 59
Education level
Post graduate
76 34
Graduate
144 65
Other qualifications
2 1
A non-response bias test was conducted using the
extrapolation method suggested by Armstrong &
Overton (1977The t-test results show no significant
differences (p < 0.05) indicated no differences
between the early and late respondents Thus, the
sample appears to be free of non-response bias issues.
3.2 Measurement Validity and
Reliability
As depicted in Appendix A, all measures of key
constructs were adapted from existing literature.
Items were translated and formulated; measuring the
constructs in the conceptual model. In some cases, the
wording had to be modified slightly to suit the current
research context. The researcher also independently
back-translated the wording between English and
Thai to ensure a high translation quality.With the
intention of evaluating whether the dimensions of
SQ-SSTs are suitable for the particular context, this
researcher conducted interviews with five experts
(e.g., practitioners and academicians) who have
knowledge of SSTs in the digital banking
environment. Based on the experts’ opinions, the
constructs that are considered appropriate to measure
service quality of self-service technologies (SQ-
SSTs) were selected. This is to be composed of five
constructs: functionality (FUC) (Lin and Hsieh, 2006;
Lin and Chang, 2011), convenience (CON) (Lin and
Hsieh, 2006; and Lin and Chang, 2011), enjoyment
(ENJ) (Lin and Hsieh, 2006; Lin and Chang, 2011),
assurance (ASS) (Lin and Hsieh, 2006; Lin and
Hsieh, 2011), and security (SEC) (Lin and Hsieh,
2006; Lin and Chang, 2011).
To assess technology readiness (TR), the thirty six
items scale developed by Parasuraman (2000) was
reviewed, but a more parsimonious scale was further
adopted following Meuter et al. (2000) and Vize et al.
(2013) to measure TR relating to four first-order
constructs: optimism (OPT), innovativeness (INN),
insecurity (INS), and discomfort (DIS). Perceived
value and e-satisfaction are first-order constructs. The
item scales for perceived value were adapted from
Zeithaml et al. (2001) and Shamdasani et al. (2008),
and e-satisfaction adapted from Anderson and
Srinvasan (2003). All measures used a 5-point Likert-
type scale anchored on 1= very strongly disagree and
5 = very strong agree for all measurement items,
except insecurity and discomfort dimensions (reverse
scale).
The convergent validity of the scales were
assessed using the method suggested by Fornell &
Larcker (1981). Confirmatory factor analysis (CFA)
was performed to purify the measurement items. The
CFA results for all constructs showed that all of the
measurement models had acceptable fit indices, such
as comparative fix index (CFI), incremental fit index
(IFI), and the Tucker Lewis index (TLI). All fit
indices were well above the recommended value of
0.90, proving the unidimensionality of the constructs.
Furthermore, the standardized coefficients for all
ManagingServiceQualityofSelf-ServiceTechnologiestoEnhancee-SatisfactioninDigitalBankingContext-TheRoles
ofTechnologyReadinessandPerceivedValue
605

variables were large (≥ 0.5) and significant at p < 0.01
(all t-values are larger than 3). Therefore, all items
were significantly related to their underlying
theoretical constructs, providing further evidence of
convergent validity.
An analysis of second-order models for TR and
SQ-SSTs provided empirical justification for
combining constructs OPT, INN, INS, DIS, FUC,
ASS, CON, ENJ, and SEC into aggregates. Fit indices
for all two second-order models are satisfactory. All
measurement variables are significantly related to
constructs (p < 0.01) while the standardized loading
ranges from 0.60 to 0.68.
A composite reliability (CR) score and average
variance extracted (AVE) were calculated to test for
construct reliability (Fornell and Larcker, 1981) for
all measurement scales and constructs in the final
measurement model. Since the composite reliability
scores ranged from 0.74 to 0.89 for all variables and
were well above the cut-off values (above 0.7). The
same can be said for AVE where values for all latent
variables exceed 0.50. All exceed the cut-off value
(0.50). It is thus to be concluded that all theoretical
constructs exhibited acceptable psychometric
properties. The list of measurement items for all
constructs appears in Appendix A.
For each of the dependent and independent
variables, this study conducted discriminant validity
checks. The results confirmed discriminant validity
among the constructs because all three Chi-square
differences between the fixed and free solutions in
Chi-square were statistically significant at a level of
p ≤ 0.01, providing evidence of discriminant validity.
4 RESULTS
As shown in Table 2, the hypothesized model is tested
employing structural equation modelling (SEM)
using AMOS. The overall fit of the model is
acceptable (χ2 =118.78, df=69 (p-value=0.00),
χ2/df=1.72, GFI=0.93, AGFI=0.90, NFI=0.92,
CFI=0.96, RMSEA=0.057, RMR=0.022). An
analysis of second-order models for TR and SQ-SSTs
provided empirical justification for combining
constructs OPT, INN, INS, DIS, FUC, ASS, CON,
ENJ, and SEC into aggregates. All the hypothesized
paths are also supported. TR has a positive impact on
SQ-SSTs (β=0.83, p< .01), supporting H1. The effect
of SQ-SSTs on e-satisfaction (β=0.64, p<.01) is found
to be significantly positive as well (H2). The path
between perceived value and e-satisfaction (β=0.35,
p<.01) is found to be significant, supporting H3.
Supporting H4, SQ-SSTs has a positive effect on
perceived value (β=0.85, p<.01).
Table 2: Direct and indirect effect.
DV IV Standardized coefficient Hypothesis
Direct Indirect Total
SQ-
SSTs
TR
0.83** N/A 0.83 H1:
Supported
Per SQ-
SSTs
0.85** N/A 0.85 H2:
Supported
E-sat Per
0.35** N/A 0.35 H3:
Supported
SQ-
SSTs
0.64** 0.30** 0.94 H4:
Supported
** p < 0.01
Note: TR = Technology readiness; SQ-SSTs = Service quality of
self-service technologies; Per = Perceived value; E-sat = e-
satisfaction; DV = Dependent variable; IV = Independent variable
The relationship between SQ-SSTs and e-satisfaction
is assumed to be a mediation effect due to the effect
of perceived value, in addition to the direct effect.
SEM can be the method preferred for mediation
analysis (Frazier et al., 2004). The path coefficient
generated by SEM provides an indication of
relationships and can be used similarly to the
traditional regression coefficients (Gefen et al.,
2000). Recently, scholars indicated that the use of
SEM bootstrap method can enhance the stability of
the test results (Cheung and Lau, 2008). When using
the bootstrap method, the mediating effect exists if
the estimate of indirect effect reached statistical
significance and confidence interval does not contain
zero. The results shown in Table 2 reveal that the
estimate of indirect effect (0.30) reached the .01 level
of significance (i.e., 99% confidence interval ranged
between 0.13 and 0.64 does not contain zero). The
result indicates that perceived value demonstrated
mediation effect between SQ-SSTs and e-
satisfaction. In sum, a partial mediation has been
proven. Therefore, the result supports H5.
5 DISCUSSION
Despite the fact that a significant amount of research
in SQ-SSTs has been conducted in recent years,
understanding both the antecedent and the
consequence of SQ-SSTs within the same study
remains a challenge for researchers. Additionally,
studies to explain how TR facilitates SQ-SSTs and e-
satisfaction are rarely undertaken. This also holds
particularly true for e-satisfaction for SSTs in the
digital banking setting. To better understand the
relationship between SQ-SSTs and e-satisfaction, this
paper has tested the mediating mechanism of
ICEIS2015-17thInternationalConferenceonEnterpriseInformationSystems
606

perceived value. From a survey of digital banking
users in Thailand, evidence has been obtained to
support our hypotheses.
The findings contribute to the literature in three
important ways. First, this study confirms that TR can
enhance SQ-SSTs. Based on this aspect, the
phenomenon of how TR can increase the level of SQ-
SSTs in the digital banking context has been
investigated in Thailand. By studying the role of TR
on SQ-SSTs, this study helps to clarify how firms can
successfully and effectively increase SQ-SSTs and
maximize benefits of e-commerce activities through
TR. In support of previous research (Vize et al.,
2013), this study confirms the positive relationship
between TR and SQ-SSTs. Concurrent with the self-
service technology (SST) adoption model, the result
implies that the use of SSTs extends beyond the
availability of infrastructure. In fact, it is about the
willingness of customers to engage in online
transactions when they believe that the technology
can be controlled and is flexible and easy to use,
convenient, and effective.
Secondly, this study has deliberated the theory of
the self-service technology (SST) adoption model
proposed by Bitner et al. (2000). As an extension, this
study has particularly developed and tested a more
comprehensive theoretical model to highlight both
the antecedent and the consequence of SQ-SSTs and
contributes to the service marketing/operations as
well as information system research by empirically
illustrating how TR enables SQ-SSTs, which in turn
improves e-satisfaction. Specifically, on the one
hand, this study shows that TR can be an important
antecedent to SQ-SSTs. On the other hand, it also
demonstrates that e-satisfaction can be an important
consequence of the latter (Kassim and Abdullah,
2010). These results accord with a technology
acceptance model and service marketing literature.
To gain insights from the business, for example,
customers of Bangkok Bank Limited (BBL) faced
online banking service disorder, problems in using
the SMS banking service, leading to a low level of e-
service quality and satisfaction. As a result, BBL
realized there was a significant customer technology
readiness by educating customers how to use the
online service from the bank. BBL also created a
user-friendly and responsive online banking service
experience for the customers and provides training for
employees to increase customer’s e-satisfaction.
Third, in line with some specific applications of
the technology acceptance model (TAM) suggested
by Davis et al. (1989), the study suggests that SQ-
SSTs influence e-satisfaction when customers
perceive the value evaluation of the SSTs. The result
of the Sobel test supports the partial mediation effect
of perceived value on the link between SQ-SSTs and
e-satisfaction. By including perceived value as the
mediator, the effect of SQ-SSTs on e-satisfaction is
reduced, while the effect of the perceived value
remains significant. Even when firms increase the
level of TR, customers’ perceived value is still a
requirement to maximize e-satisfaction.
As a mediator, perceived value helps to explain
why many firms that have invested heavily in SSTs
have failed to fully experience the benefits of these
investments. Thus, a further conclusion is that SQ-
SSTs’ influence e-satisfaction when customers
perceive the value of the SSTs. As a result, firms need
to design ways for customers to capture the added
value of using SSTs so that they are able to agree with
the benefits and advantages from the perceived
service quality of a SST; then they will develop
favourable attitudes toward SSTs. This issue was well
articulate by one of the bank managers interviewed in
this study. The manager stated, “Generally, customers
will consider SSTs as an attractive alternative if it is
both perceived and believed to be easy to use. The
high share of both online and mobile banking users
indicate a high affinity toward technology, which
matches the appreciation of the SSTs and the positive
evaluation of its ease of use. Thus, the convenience
should be advertised to increase willingness in the
first-time user. In addition, customers will be satisfied
with internet banking when they perceive that it is
beneficial for them”. As discussed above, it provides
further insights on the mediating effect of perceived
value on the relationship between SQ-SSTs and e-
satisfaction. This finding also underscores the
importance of customers’ perceived value for
implementing SSTs.
The findings of this study also have implications
for business practitioners. First of all, our results
found that TR has a significantly positive effect on
SQ-SSTs and in turn can improve e-satisfaction. This
finding should encourage managers to increase TR
for SST implementation so as to enhance this aspect
of development. Second, this study found that
perceived value partially mediates the relationship
between SQ-SSTs and e-satisfaction. This can
highlight a key mechanism through which firms can
enhance e-satisfaction. Managers may therefore
particularly wish to consider customers’ perceived
value when trying to offer SSTs. Thus, the most
important influencing factor for the usage of such a
SST is the real value added that customers can
perceive. Moreover, care should be taken to facilitate
customers to believe that SSTs can be controlled and
are flexible to use, convenient, and effective. Thus,
ManagingServiceQualityofSelf-ServiceTechnologiestoEnhancee-SatisfactioninDigitalBankingContext-TheRoles
ofTechnologyReadinessandPerceivedValue
607

the findings offer insights to managers in e-commerce
service marketing on how to manage SST usage to
maximize the benefits accruing from customers’
perceived value.
6 LIMITATIONS AND FUTURE
RESEARCH
This empirical study has several limitations. First, the
research results were obtained from a single service
industry (digital banking). Thus, caution must be
exercised when generalizing the findings. Measuring
the role of TR plays in SQ-SSTs and e-satisfaction
across other service industries, building on the extant
technology acceptance model framework and its
extensions, could also yield valuable results. Second,
this study did not incorporate the effects of cultural
differences on e-satisfaction in the proposed model.
Further research should focus on developing a richer
model that incorporates additional constructs such as
cultural difference and their interaction as well as
where they fit into the model. Finally, this study
mainly discusses the influence of TR on customers’
perceptions. It focuses on SSTs in the banking
industry, where customers fulfill their transactions
without any interaction with, or assistance from, bank
employees.
Appendix A. Measurement Items
Optimism (OPT)
OPT1. Technologies (of SSTs) make you feel more efficient in business.
OPT2. You find you are doing more activities now with technologies (of
SSTs) than a couple of years ago.
OPT3. You like the idea of doing business via technologies (of SSTs)
because you are not limited to regular business hours.
Innovativeness (INN)
INN1. In general you are among the first of your friends to acquire new
technologies (SSTs) when it appears
INN2. You keep up with the latest technological (SSTs) developments in
your areas of interest.
INN3. You find you have fewer problem than your friends in making
technologies (SSTs) work for you.
Insecurity (INS)
INS1. You do not consider it safe giving out a credit card number over a
technology (SSTs).
INS2. You do not consider it safe to do any kind of financial business online
(SSTs)
INS3. You worry that information you send over the business online (SSTs)
will be seen by other people.
INS4. You do not feel confident doing business with a place that can only
be reached online (SSTs).
Discomfort (DIS)
DIS1. Technical support lines are not helpful because they don’t explain
things in terms you understand.
DIS2. The hassle of getting new technologies (SSTs) work for you usually
makes it not worthwhile.
DIS3. With new technologies (SSTs), you often risk paying a lot of money
for something that is not worth much.
DIS4. When you get technical support (of SSTs) from a provider of a
service, you sometimes feel as if you are being taken advantage of by
someone who knows more than you do.
Functionality (FUC)
FUC1. You can get your service done with the SSTs in a short time.
FUC2. Using the SSTs require little effort.
FUC3. The service process of the SSTs is clear.
Convenience (CON)
CON1. The SSTs has operating hours convenient to customers.
CON2. This site has customer service representatives available online (of
SSTs)
CON3. It is easy and convenient to reach the company’s SSTs
Enjoyment (ENJ)
ENJ1. The operation of the company’s SSTs is interesting.
ENJ2. You feel good being able to use the SSTs.
ENJ3. The company’s SSTs have interesting additional functions
ENJ4. The company’s SSTs provide you with all relevant information.
Assurance (ASS)
ASS1. The company providing the SSTs is well-known.
ASS2. The company providing the SSTs has a good reputation.
Security (SEC)
SEC1. You feel like your privacy is protected with the company’s SSTs.
SEC2. The company’s SSTs have adequate security features.
SEC3. You feel safe in your transactions with the company’s SSTs.
SEC4. It does not share your personal information with other company’s
database.
Perceived value (PER)
PER1. In general, the overall value you get from using this company’s SSTs
is worth your time and effort.
PER2. What you gained from company’s SSTs is more than what you have
to give up.
PER3. You value SSTs greatly.
E-satisfaction (E-sat)
E-SAT1. Based on all of your experiences with SSTs of this company, you
feel very satisfied.
E-SAT2. Your choice to use service in this company’s SST was a wise one.
E-SAT3. Overall, you are satisfied with your decision making to use the SST
service in this company.
REFERENCES
Anderson, R.E., Srinivasan, S.S., 2003. E-satisfaction and
e-royalty: A contingency framework. Psychology and
Marketing, Vol. 20, No.2, pp. 123-130.
Armstrong, J.S. and Overton, T.S., 1977. Estimate
nonresponse bias in mail survey, Journal of Marketing
Research, Vol. 14, pp. 396-402.
Baron, R.M., Kenny, D.A., 1986. The moderator-mediator
variable distinction in social psychological research:
conceptual, strategic, and statistical considerations.
Journal of Personality and Social Psychology, Vol. 51,
No.6, pp. 1173-1182.
Bitner, M.J., Brown, S.W., Meuter, M.L., 2000.
Technology infusion in service encounters. Journal of
Academy of Marketing Science, Vol. 28, No.1, pp. 138-
149.
Chen, C., 2008. Investigating structural relationships
between service quality, perceived value, satisfaction,
and behavioral intentions for air passengers: Evidence
from Taiwan. Transportation Research Part A, Vol. 42,
pp. 709-717.
Chen, S.C., Chen, H., Chen, M., 2009. Determinants of
satisfaction and continuance intention toward self-
service technologies. Industrial Management and Data
Systems, Vol. 109, No. 9, pp. 1248-1263.
ICEIS2015-17thInternationalConferenceonEnterpriseInformationSystems
608

Cheung, G.W., Lau, R.S., 2008. Testing mediation and
suppression effects of latent variables: Bootstrapping
with structural equation models. Organizational
Research Methods, Vol. 11, No.2, pp. 296-325.
Chiu, C., Chang, C., Cheng, H., Fang, Y., 2009.
Determinants of customer repurchase intention in
online shopping. Online Information Review, Vol. 33,
No. 4, pp. 761-784.
Colla, E., Lapoule, P., 2012. E-commerce: exploring the
critical success factors. International Journal of Retail
and Distribution Management, Vol. 41, No.11, pp. 842-
864.
Cronin, J.J., Brady, M.K., Hult, G.T., 2000. Assessing the
effects of quality, value, and customer satisfaction on
consumer behavioral intentions in service
environments. Journal of Retailing, Vol. 76, No. 2, pp.
193-218.
Davis, F.D., Bagozzi, R.P., Warshaw, P.R., 1989. User
acceptance of computer technology: a comparison of
two theoretical models. Management Science, Vol. 35,
No.8, pp. 982-1003.
Fornell, C., Larcker, D.F., 1981. Structural equation models
with unobservable variables and measurement error:
Algebra and statistics. Journal of Marketing Research,
Vol. 18, No.3, pp. 382-388.
Frazier, P.A., Tix, A.P., Barron, K.E., 2004. Testing
moderator and mediator effects in counseling
psychological research. Journal of Counseling
Psychology, Vol. 51, No.1, pp. 115-134.
Gefen, D., Straub, D., Boudreau, M.C., 2000. Structural
equation modeling and regression: guidelines for
research practice. Communications of the Association
for Information Systems, Vol. 4. No.7, pp. 1-77.
Ho, S., Ko, Y., 2008. Effects of self-service technology on
customer value and customer readiness: The case of
internet banking. Internet Research, Vol. 18, No. 4, pp.
427-446.
Holbrook, M.B., 2006. Consumption experience,
customer value, and subjective personal introspection:
An illustrative photographic essay. Journal of Business
Research, Vol. 59, No. 6, pp. 714-725.
Hsu, M.H., Chuang, L.W., Chiu, S.P., 2013. Perceived
quality, perceived value and repurchase decision in
online shopping context. Applied Mechanics and
Materials, Vol. 311, pp. 43-48.
Kassim, N. and Abdullah, N.A., 2010. The effect of
perceived service quality dimensions on customer
satisfaction, trust, and loyalty in e-commerce setting: a
cross cultural analysis. Asia Pacific Journal of
Marketing and Logistics, Vol. 22, No. 3, pp. 351-371.
Lee, H., Yang, K., 2013. Interpersonal service quality, self-
service technology (SST) service quality and retail
patronage. Journal of Retailing and Consumer Service,
Vol. 20, No. 1, pp. 51-57.
Lin, J.S., Chang, H, 2011. The role of technology readiness
in self-service technology acceptance. Managing
Service Quality, Vol. 21, No.4, pp. 424-444.
Lin, J.S., Hsieh, P. 2006. The role of technology readiness
in customers’ perception and adoption of self-service
technologies. International Journal of Service Industry
Management, Vol. 17, No.5, pp. 497-517.
MacKinnon, D.P., Lockwood, C.M., Hoffman, J.W., West,
S.G., Sheet, V., 2002. A comparison of methods to test
mediation and other intervening variable effects.
Psychological Methods, Vol. 7, pp, 83-104.
Martin, C., Oliveira, T., Popovic, A., 2014. Understanding
the internet banking adoption: A unified theory of
acceptance and use of technology and perceived risk
application. International Journal of Information
Management, Vol. 34, No.1, pp. 1-13.
Meuter, M.L., Ostrom, A.L., Roundtree, R.I., Bitner, M.J.,
2000. Self-service technologies: understanding
customer satisfaction with technology-based service
encounters. Journal of Marketing, Vol. 64, No. 3, pp.
50-64.
Mohammadi, H., 2015. A study of mobile banking loyalty
in Iran. Computer in Human Behavior, Vol. 44, No.1,
pp. 35-47.
Oh, H., 2000. Diner’s perceptions of quality, value and
satisfaction. Cornell Hotel and Restaurant
Administration Quality, Vol. 41, No.3, pp. 58-66.
Parasuraman, A., 2000. Technology readiness index (Tri):
A multiple-item scale to measure readiness to embrace
new technologies. Journal of Service Research, Vol.2,
No.4, pp. 307-320.
Shamdasani, P., Mukherjee, A., Malhotra, N., 2008.
Antecedents and consequences of service quality in
consumer evaluation of self-service internet
technologies. The Service Industry Journal, Vol. 28,
No.1, pp. 117-138.
Vize, R., Coughlan, J., Kenedy, A., Ellis-Chadwick, F.,
2013. Technology readiness in a B2B online retail
context: An examination of antecedents and outcomes.
Industrial Marketing Management, Vol. 42, pp. 909-
918.
Wang, Y., Tang, T. and Tang, J.E., 2001. An instrument for
measuring customer satisfaction toward web site that
market digital products and services. Journal of
Electronic Commerce Research, Vol. 2, No. 3, pp. 89-
102.
Zeithaml, V.A., Parasuraman, A., Malhotra, A., 2001.
Service quality delivery through web sites: A critical
review of extant knowledge. Journal of Academy of
Marketing Science, Vol. 30, No.4, pp.362-375.
ManagingServiceQualityofSelf-ServiceTechnologiestoEnhancee-SatisfactioninDigitalBankingContext-TheRoles
ofTechnologyReadinessandPerceivedValue
609
