Science on a Sphere
Ways of Adding Interactivity into the Unique Projection System
Jana Varnušková
1
and Josef Kohout
1,2
1
Department of Computer Science and Engineering, University of West Bohemia, Plzeň, Czech Republic
2
New Technologies for Information Society (NTIS), University of West Bohemia, Plzeň, Czech Republic
Keywords: Science on a Sphere, SOS, NOAA, Interactivity, Nintendo, Wii Remote, Client, Server, Game, Education.
Abstract: This paper describes applied research provided in cooperation of the Faculty of Applied Sciences and the
Techmania Science Centre. It presents the unique system Science on a Sphere, its features, control
mechanisms and limitations. The special visualization system brings a new approach of geographical data
presentation. On the other hand it offers just a minimal opportunity of user interaction. Interaction should
enable better participation of science centre in the learning process. The paper shows the ways how the
existing projection system Science on a Sphere has been extended for the interactive features.
1 INTRODUCTION
Science on a Sphere (SOS, 2014) is a science project
of the National Oceanic and Atmospheric
Administration (NOAA) agency (NOAA, 2014). It
was developed as an educational tool that should
enable better illustration and visualization of
geography, history or any atmospheric processes on
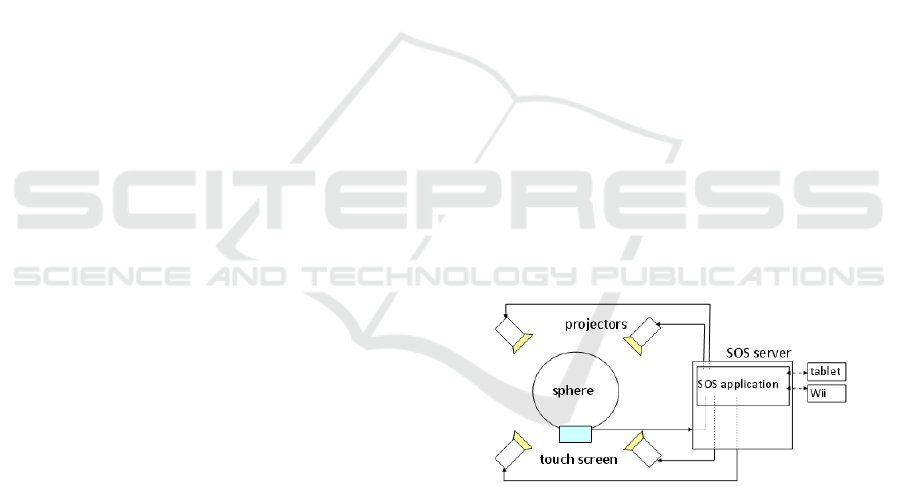
Earth and other planets. In fact, it is a large
visualization system composed of projection sphere
and four video projectors connected to the computer.
Projectors are placed sophistically around the sphere
and displaying animated data on the sphere surface
and so the system has an effect of luminary globe.
The simple scheme of the system can be seen in
Figure 1.
SOSs are mostly placed in science centres,
museums and universities. All of them can use over
400 datasets categorized in several groups. Datasets
are produced directly by the NOAA as a
visualization of data measured by several different
types of satellites, including geostationary and polar
orbiting satellites. Some datasets (e.g. temperature,
weather or wind speed) are real-time, they are
actualised online according to actually measured
data just with approximately one hour delay.
Moreover, not only official datasets can be
projected, users can produce their own visualizations
based on video or image data.
Over one hundred spheres are installed
worldwide, most of them are placed on the North
Figure 1: Scheme of SOS.
America Continent. In October 2013 the seventh
SOS in Europe was installed in the Czech Republic,
in Techmania Science Center in Pilsen (TSC, 2014).
The sphere has diameter 1,73m and is placed in a
separate dome of the planetarium building. This
equipment was used for development of the SOS
interactivity system described in this paper.
SOS is the unique equipment that is ideal for
visualization of geographically and planetary data
especially for educational, science communication
and visual analitics purposes. But because in its
original state it can be used only for replaying
prepared datasets, it has very limited usage. The
whole projection is controlled by the SOS server and
the system does not enable to change its function or
to access directly the visualization part. The user can
influence the view (the globe rotation and the
visualization stop and replay) from a remote device,
such as tablet application, touch screen or Wii
Remote. In our approach we have focused on design
of extension of the user interaction with SOS.
423
Varnušková J. and Kohout J..
Science on a Sphere - Ways of Adding Interactivity into the Unique Projection System.
DOI: 10.5220/0005271004230430
In Proceedings of the 10th International Conference on Computer Graphics Theory and Applications (GRAPP-2015), pages 423-430
ISBN: 978-989-758-087-1
Copyright
c
2015 SCITEPRESS (Science and Technology Publications, Lda.)

Suggested approach was demonstrated on the
implementation of the educational game.
Section 2 describes the ways how SOS can be
controlled, Section 3 deals with reasons why and
ways how to add interactivity into the existing
system and its usage in education game is shown in
Section 4. Finally, Section 5 concludes the paper and
outlines our possible plans into the future.
2 SCIENCE ON A SPHERE
The basic element of the SOS visualization is
a dataset, or we can call it a clip. Clips are combined
into playlists and among clips in the playlist users
can simple switch during the SOS viewing (as
described in Section 2.1). In dependence on the way
of SOS control that we use, we can manage more or
less limiting set of functions for the globe control.
2.1 SOS Control
There are several ways how to use the whole system.
The basic approach is to view the prepared datasets
downloaded directly from the NOAA (SOS, 2014).
Three examples can be seen in Figure 2.
a)
b)
c)
Figure 2: a) Blue Marble (23 degree tilt); b) Red Mars
(25 degree tilt); c) Surface Temperature.
The view control can be provided on the touch
screen that is placed directly next to the sphere.
Everybody can select any dataset from the prepared
list and start its playing. The viewed clip can be tilt,
paused and released again. Similar opportunities of
control (but in a more movable way) are offered by
the usage of Nintendo Wii Remote. The advantage is
that SOS can be controlled from any place in the
room and the operator can better view the globe,
walk around it and see anything he/she wants.
Much more advanced option of control is the
usage of tablet. User of the tablet application
connected to SOS can switch clips, rotate the globe
in any direction, zoom or use simple drawing to
highlight some interesting places. Also layers used
on the sphere can be explored, hidden and showed
again. This approach is used by the trained operator
of the SOS (most often the edutainer – guide in the
science centre).
The only possibility to influence the SOS system
completely is to send one or more of the predefined
commands to SOS server terminal via telnet
protocol. This approach is called automation (SOS –
automation, 2014). There are tens of commands that
can influence the globe (e.g. insert pictures, set its
size, position, style, name, add or remove layer, get
current state of the system and many others).
Because commands have to be entered in a proper
format and various settings should be observed, it is
not a user friendly way of SOS control for a
common user. But it is the most complex way.
To summarize it, the SOS offers various kinds of
datasets visualization, but for the non-trained user
(the visitor) there is absolutely no way how to
interact with the device except for switching and
replaying clips.
2.2 SOS Abilities
Base of any dataset can be composed from image or
video wrapped around the globe. Aspect ratio of the
base should be 2:1. SOS offers many features that
can be used for the dataset modification. The
original data can be overlaid by some additional
proper layer image, pictures in picture can be added
on a particular place on a globe, speed and angle of
rotation can be specified etc. We can work with
audio, sphere orientation, zoom and annotation, we
can switch datasets, etc. As mentioned above, some
features can be affected directly in the dataset
description or we can use automation control. For
our work we have selected a set of several important
functions, they are described in following sections.
2.2.1 Sphere Orientation
The orientation of the sphere is given in degrees as
the vector of three values [rot
x
, rot
y
, rot
z
]. But in
fact, there are two coordinates systems – the globe
and the room one. It is important to notify, which
SOS feature uses which coordinate system. When
the sphere orientation is set as [0, 0, 0], the way of
specifying a position on the sphere surface is
identical in both coordinate systems. If the globe
orientation is changed, the room coordinate system
remains in the original position, and the globe
coordinate system shifts around (SOS – sphere
orientation, 2014).
We can affect the speed of the sphere rotation
and we can also set the exact tilt of the globe.
Because the sphere rotation can be in the same time
GRAPP2015-InternationalConferenceonComputerGraphicsTheoryandApplications
424
changed from several independent devices (tablet,
Wii Remote or a touch screen), it is very important
to get the actual state each time before any action.
2.2.2 Actual State
If we need to know, in which state the SOS actually
occurs (what is the rotation of the globe, if it is
rotating or not, if the pointer is visible, what is its
position etc.), we can use the actual state automation
command get_state. It returns description in a text
form that can be further parsed. An example string
can be seen here:
{timestamp 111} {pointerimage mmm} {pointersize
0.0} {clip_state LOADED} {clip_number 0}
{animating 1} {pointer 11.0,218.3} {tilt{0.0 0.0
0.0}} {frame_rate {30.0 0 0}} {playlist_name
nnn.sos} {frame_count 3600} {frame_number 656}
2.2.3 Pointer
Pointer is a tool that can be controlled just with
tablet or automation commands. It is a point of a
defined size or the single point can be replaced by an
image. It can be hidden or shown and we can affect
its position on the globe. Officially it has only one
function in the tablet presentation – to specify the
user actual position in the room, than the sphere is
rotated relatively to him/her.
Very important is the fact, that if we move the
pointer for [latitude, longitude] delta, it moves in the
coordinate system of the room and so, if the globe is
rotated, movement of the pointer does not keep the
original direction of lines of latitude and longitude
on the globe. The pointer moves vertically or
horizontally on the globe, but according to the clip
base image unwrapped to the 2D map it moves in an
elliptical path.
2.2.4 Picture in Picture (PIP)
Picture in picture is a very useful feature, if we want
to put image anywhere on the globe. We can choose
from three styles of PIP – room (it is placed once on
the globe and keeps its position relatively to the
room even if the globe rotates), projector (each
projector has its own image, so it is shown four
times on the globe; images do not move when the
globe rotates) and globe. The last one is the most
useful type for our purpose. The picture is placed
once on the globe and while the globe rotates, it
keeps its position relatively to the sphere on the
same place.
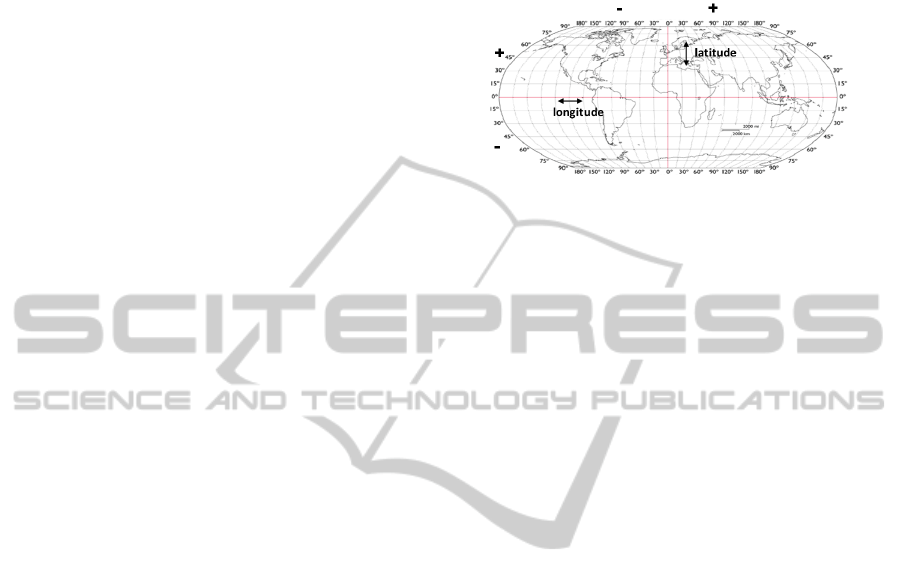
The orientation of PIP on the sphere is given by
longitude (going horizontally from -180 on the East
to 180 degrees on the West) and latitude (going
vertically from 90 degrees on the North to -90
degrees on the South Pole) – see Figure 3. Top
border of the image is situated always to the North
Pole of the globe.
Figure 3: Longitude and latitude visualization (image base
source: LatLon, 2014).
If we put the new PIP on the sphere, we can set
various properties, such as size, alpha, position or
style, we can change the source image or delete the
PIP. But once we add any next PIP, the precedent
one cannot be modified any more. To keep
opportunity to change the properties of each single
PIP also in the future, we have to set the PIP name
and later we can select the PIP according to its name
and continue in settings.
2.2.5 Layers
Layers are the second way of putting any image on
the globe. It is placed over the basic layer of
a dataset and should have the same aspect ratio as
basic data. Several layers can be placed over each
other and because they can use transparency, we can
use layers for adding some new information to the
basic content, for highlighting of some area or
adding labels. Each layer has its index and very
often its own name and can be shown or hidden via
automation comments or during tablet presentation.
The number of layers is not limited, but if we use
high number of layers, the whole system slows down
markedly.
2.2.6 Annotation
In Section 2.1 there was already mentioned, that
users of tablet application can use some kind of
drawing. System enables to choose the colour and
width of the line and to draw line segments between
two points, coordinates of the line segments end
points are set in degrees of latitude and longitude. If
we want to use annotation via automation, we need
only to build a command such as:
annotation drawline 90,0,-90,0,2,255,0,0
It will draw the Prime Meridian as the red line of
ScienceonaSphere-WaysofAddingInteractivityintotheUniqueProjectionSystem
425

width 2 from the North to the South Pole. If the line
segments are short enough, we can use them to
create curves, but because all line segments are
drawn subsequently, if many poly-lines should be
drawn, it needs more time.
3 INTERACTIVITY
All approaches described in Section 2.1 enable to
select any clip from the prepared datasets and view
it. Moreover, edutainers can use tablet to zoom to
some place on the globe or to draw simple on the
actually viewed dataset, to show some interesting
details. But there is no way how to interact with the
sphere more, or how to enable children to join any
game that will test their knowledge about the Earth,
planets or any other interesting topic. Our first aim
was to add to the SOS system a new feature which
would enable visitors of the science centre to affect
somehow what they see, to select any place and to
get more information and to learn more simply by
“clicking” on the sphere.
Because the SOS does not offer any tool, how to
impulse it and to launch any action we had to search
for another solution. SOS server is running online
and is able to react immediately on the command
sent via the telnet connection. It is the only way how
to give SOS real time instruction about what
operation should be provided. We have decided to
create an external application that would get
impulses from the user (via GUI or any special
hardware) and at the same time it would send
commands for the SOS directly to the SOS server
over the telnet connection.
As additive hardware we have selected Nintendo
Wii Remotes, because several pieces were already
bought with the SOS system. As mentioned in
Section 2.1, they have originally just very limited
control function. And because they were not used at
all, we were asked to upgrade their function. For the
communication between computer and Nintendo Wii
Remote the bluetooth wireless technology is used.
3.1 Interactive Features Concept
We need to implement two basic features so that any
game or interactive application could be built on the
SOS interactive module – clicking cursor (or
multiple cursors) and places/areas determination.
The first feature is the cursor. A tool that would
move on the globe and by clicking would run any
actions. Moreover, if we want to use the system for
any game, where more users would compete, we
need to place more cursors on the globe and to
control them separately and so we should extend the
system for multiple cursors.
To select and mark interesting places or areas,
we need to create any tool that would be able to
border any selected area on the globe. Moreover,
these areas should be clickable. It means that if the
user will use the click action, the area placed on the
position of the cursor will be able run the action. So
we need a way to describe a continuous border, an
algorithm to decide if the point (position of the
cursor) is inside the border and some mechanism to
show the area on the globe. Moreover, it would be
useful so that the area could be marked as active, if
the cursor is moving over the sphere (it means, if the
cursor moves over the area, it changes its border
colour and if the cursor leaves the area, border
colour is changed back as the non-active area). To
describe the border, it is sufficient to keep
coordinates of poly-line vertices together with the
name of the area. Coordinates can be used as for the
border visualization and so for the inside decision
algorithm. The detection algorithm works in two
levels. Each area has its bounding box, and before
exact test, if the point lies in the area, the bounding
box test is provided. When it is positive, the ray-
crossing algorithm based on the Jordan Curve
Theorem (Schneider and Eberly, 2002) is used to
determine exactly, if the point (position of the
cursor) lies inside the polygon (tested area).
3.2 SOS Control Module
We have designed a module covering all the SOS
control functions, telnet connection operations and
also supporting functions for data preparation. This
section describes approaches of using SOS abilities
for the interactive use. The following subsections
show an example of the model usage that was
further developed and implemented into the form of
complete workable system transferred into the real
use (see Section 4). Also some facts about the real
implementation of the model and reasons for
technologies selecting are given (Section 3.3). The
main idea of module integration and example of the
module usage in the interactive educational game
can be seen in Figure 4. The game server (created on
the basis of the interactive module) is connected to
the SOS server and ensures the automation
commands processing. To the game server we can
connect several Wii gamepads, each can control its
own cursor and so the game server has to process the
commands from various sources. The client
application ensures the comfortable game selection,
GRAPP2015-InternationalConferenceonComputerGraphicsTheoryandApplications
426
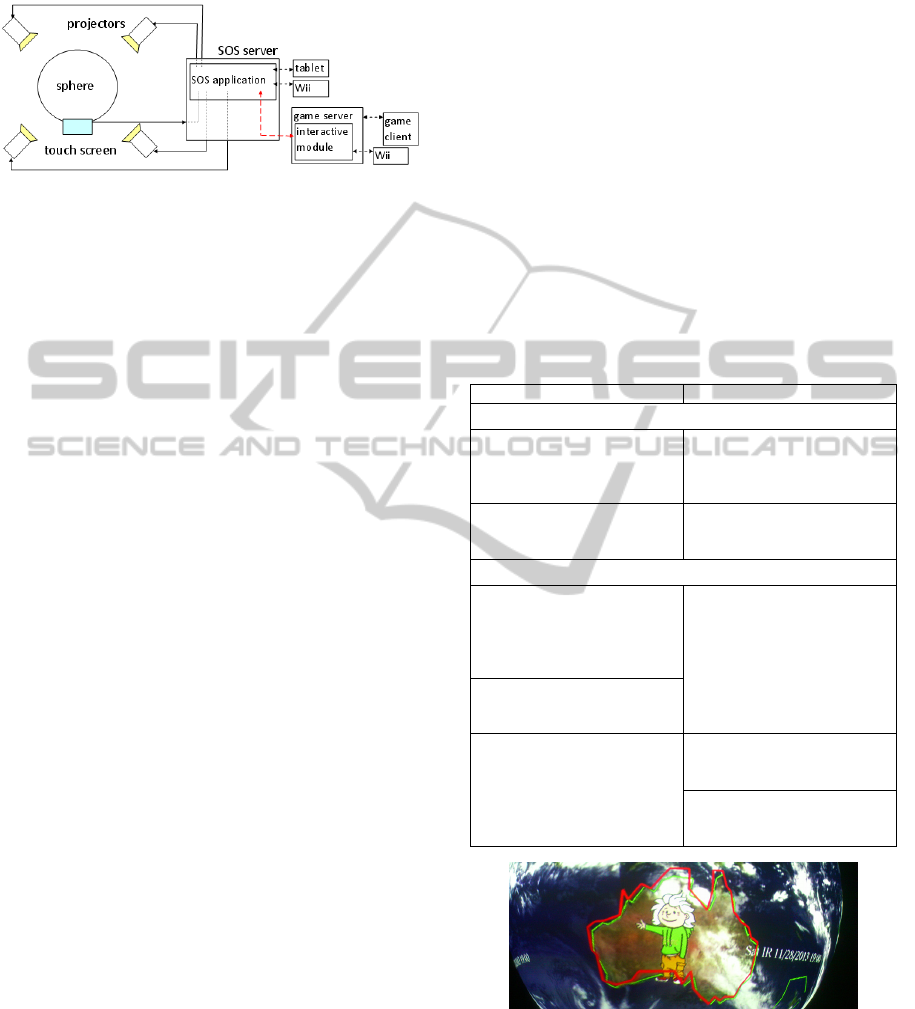
launching, switching of questions and the
communication with the game server.
Figure 4: Scheme of SOS with the interactivity module.
3.2.1 Interactive Features Implementation
We have really very limited opportunities while
adding any visual data on the globe. We can use
pointer and images in the form of layers and PIPs
and we can draw simple line segments. We need to
implement the basic interactive features described in
Section 3.1.
The first question to solve was the cursor. SOS
offers the pointer (it was shortly outlined in Section
2.2.3). It can be moved, resized or replaced by the
image, so it seems to be a perfect element. That is
why the pointer and its control was implemented
into the module. “Clicking” of the pointer can be
ensured in dependence on user demand, e.g. in GUI
or with the game pad. Because the pointer can be
placed on the globe only once, we have to find other
solution to implement multiple cursors. We have
decided to implement multiple cursors as PIPs. It
means that for each Wii Remote a new PIP is
created and serves as a cursor on the globe, it can be
moved or clicked. According to defined function we
can set any reaction of SOS on the “cursor click”,
we can define any button of the device to run any
action of the SOS system. When the Wii Remote is
reconnected, its PIP is removed.
SOS control module includes tool for connecting
the Wii Remote gamepad. There are two modes
which can be used. One Wii Remote can be used to
control pointer of SOS. When we need more users
(players), more Wii Remotes can be connected in
PIP mode. This is the most important feature added
into the system that enables interaction of the user.
The second interactive feature that should be
added was the management of interesting places and
areas. For the visualization on the globe we can
choose from two techniques. To decide, we have to
take into account two points of view – speed and
exactness of mapping of the area border on the
globe.
The first approach is based on the usage of the
prepared images placed on sphere as layers. For each
area we must prepare a separate image that must
have the same size or at least the same aspect ration
as the basic data image (or video). The border of the
area will be rendered in a defined colour into the
transparent background. We need to render each
area in two colours – the active and inactive state,
than, we can ensure the cursor area activation by
changing the layers. In the second approach, we can
draw directly on the globe with annotation
commands. The colour would be updated according
to the cursor position and the area repainted
repetitively. If we need to change any detail, we
have to redraw everything. Both alternatives have
some positives and negatives which are summarized
in Table 1.
Table 1: Positives and negatives of two basic SOS
visualization tools – layers and annotation.
Layers Annotation
POSITIVES
exactness (if base and layer
are the same in 2D, they are
the same on globe)
if we create any new area, we
can draw it without any data
preparation immediately on
the sphere
with one command can be
shown, hidden or made semi-
transparent in a simple way
NEGATIVES
sources must be saved on the
SOS server in advance,
everything must be prepared,
nothing can be added real
time
inexactness (although the
coordinates of the points are
computed from the same
values, resolution of the
sphere annotation is worse
than of the base image (see
Figure 5 on example of the
Australia border)
it needs 1-2 seconds to load
the area for the first time
if the loaded area is missing,
it is shown as the white non-
transparent layer that covers
everything under its position
in more detailed areas the
border is visibly being drawn
around the area
have to be repainted each
time we have to hide or show
it
Figure 5: Demonstration of inexactness of annotation in
comparison with the layer data. Green poly-line represents
the original border and red inexact border is the result of
annotation drawing.
As can be seen, there are many limitations of the
SOS system. The big shared problem of both
variants is the speed. Layer approach is independent
ScienceonaSphere-WaysofAddingInteractivityintotheUniqueProjectionSystem
427

on number of details of used borders, because each
area has a separate image with rendered border.
When drawing, we have to redraw each single line
segment of the poly-line and so the usable number of
areas depends closely on their level of detail. Usage
of annotation gives inexact borders of areas and it
needs to repaint all the time. We have tested the
system for 40 areas (the maximal number of
questions of the game). Finally, especially because
of its exactness and also higher speed, it was decided
to use layers for representation of areas borders.
Layer approach with 40 layers (each used area has
its own border rendered into separate image with
resolution 4096×2047 pixels) works well.
3.2.2 SOS Commands Serialization
All commands going to the SOS system are
processed serially. Some commands are single, but
some commands (e.g. PIP modification) go in a
sequence that should not be interrupted. If there are
more sources of the commands processing, we have
to keep the correct order. In principle, there is no
problem, when any two single commands change
their order, because if the sequence is interrupted by
the command from another source, it could cause a
wrong effect. For the better imagination we will
present an example – processing of two PIPs. As
mentioned in 2.2.4, each PIP (if we want to modify
it repetitively) should have its unique name. For
each modification we have to choose PIP we need to
process (pipselect name) and then all commands
concerning PIPs go to the selected one. Let us have
two sources sending commands to SOS (S1 and S2).
If the command sequences run independently (such
as in the left column), PIP1 would have width 30
degrees and PIP2 50 degrees. But if the commands
are serialized in a wrong way as in the right column,
PIP1 would have width 50 and PIP2 remains
unchanged.
S1: pipselect PIP1
S1: pipwidth 30
S2: pipselect PIP2
S2: pipwidth 50
S2: pipselect PIP2
S1: pipselect PIP1
S1: pipwidth 30
S2: pipwidth 50
From this reason all operations that should be
done in a block have to be grouped into atomic
blocks which are executed at once.
3.3 Model Implementation
The application should run on various operation
systems – Unix (SOS server), Windows (touch
screen, other connected PCs). The SOS system is
administrated by the third site, so it does not enable
many installations of any special software. That is
why the programming language and Bluetooth
library should be selected as platform independent
generally used system. Several libraries were tested
(BlueZ, 2014), (32Feet.NET, 2014), (Wireless
Communication Library, 2014). Finally, we have
selected Java 1.8 as the programming language and
BlueCove 2.1.1 library for the Nintendo Wii Remote
communication.
We have developed SOS control module that
enables programmers to connect their application to
a special projection and visualization system.
Module serves as interface for controlling the SOS
via user interface or any additive hardware added by
the programmer. Moreover, it enables directly to
connect Nintendo Wii Remote for user interaction.
The module can be integrated into any Java
application that needs to work with SOS. It offers
a set of methods corresponding to the automation
commands, providing telnet connection, commands
transfer and processing.
The module is designed in a component way.
Each feature described above has its program
equivalent – e.g., PIP, Layer, or Pointer. They are
supplied with object Telnet that ensures the telnet
connection and enables to all classes to send
automation commands directly to the SOS.
Everything is covered with SOS object that ensures
global commands and enables the other classes to
use SOS.
Automation commands serialization is solved
with synchronized java methods, where all the
commands sending sequence are processed at once.
The communication between the server and client
application is solved with the Java sockets.
4 INTERACTIVE GAME
The implemented system of game works on a very
simple principle. Let us start with a short motivation.
We can imagine group of children sitting around the
SOS globe and listening the edutainer speaking
about the Earth, its continents and oceans. But how
can we drag them into the education process or test
what they remember? We can use the interactive
game to increase their interest. We will divide
children into several groups. From each group one
child gets a gamepad controlling a cursor of a unique
colour and learns to use it, to move the cursor and to
click the action button. Now the game can start.
Edutainer has a list of questions concerning the topic
(e.g., “Select the continent with the highest
mountain of the World.”). After the question is read,
GRAPP2015-InternationalConferenceonComputerGraphicsTheoryandApplications
428
each group of children has to collaborate to agree on
a correct answer. The fastest correct answer brings a
point. Now, the edutainer can append an additional
piece of information about the place and continues
with the next question. Finally, the winner is a team
with the highest score.
4.1 Game Application
The described concept was implemented into the
Java application. The software is divided into four
applications. Client and server applications are used
for the game launch and two support tools, areas
editor and game editor, are used for new game
preparation. The whole game is built on the SOS
interactive module that ensures the connection to the
SOS system and commands sending and also
connection of Wii Remote device.
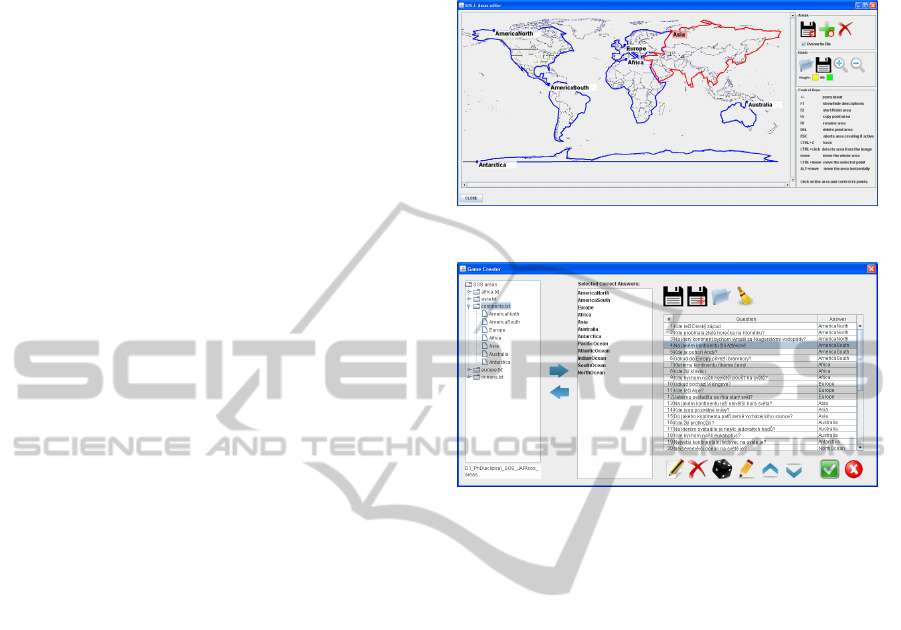
Creation of a new game goes in several steps.
Each game needs some data saved in several
description and image files. First we have to
determine the areas that will be active in the game.
Because for various games the areas can repeat, it is
recommended to create areas in logical groups (such
as e.g. continents, oceans, states, …) and to save
them in separate files. Later, areas can be combined
according to requirements of the game. For the
comfortable and precise data preparation the areas
editor serves. This application can be used
independently on the SOS and so data can be
prepared on any computer. It enables to design and
administrate particular areas in a 2D view. We can
set their descriptions, borders and also render image
layers. As the border colour any “neutral” colour
should be used (it means colour different from
colours of players), so that the number of used layer
would not increase with every additional player. As
the underlayer we can use directly the base image
from the dataset. An important output from the
application is the areas descriptions file and layer
images. All these files have to be copied manually
on the SOS server. In Figure 6, the areas editor with
loaded description of continents can be seen.
When areas are prepared, as a next step, the
game should be composed. Each game consists of at
most 40 questions and each question has one correct
answer. For the game creation, the second support
application (game editor) was prepared. It enables to
create and manage questions simply (as can be seen
in Figure 7, the user has many tools for the game
finalization). As well as the areas editor this
application can be used on any computer
independently on the SOS system. When the game is
ready, the game description file is saved and it is
transferred to the SOS server (together with the
original area descriptions files).
Figure 6: Areas editor.
Figure 7: Game editor.
When the data is prepared and the description
files and image layers are transferred on the SOS
server computer, we need a system for the game
launching. As it was mentioned before, we have
decided to divide this function between two
cooperating applications – server and client.
Server application should run on a computer
connected into the same network as the SOS system.
Moreover, the computer must be able to synchronize
with the Wii Remotes and so it has to use the
Bluetooth wireless technology standard. We can run
the application directly on the SOS server (i.e.,
computer controlling the SOS). The application is
very simple to use and, although it has a complex
functionality hidden under the GUI, the user needs
just to connect it to the SOS system and run the
server.
After the server is started, it waits for tasks sent
by the connected devices or clients. One or more
clients and independently also several Wii Remotes
can be connected to the server. Communication with
the gamepad runs through the Bluetooth interface.
Every Wii Remote can send demands on
synchronization and later information about pressed
buttons. The server reacts on them – moves the
cursor, runs clicking actions etc. Connection
between client and server is based on TCP
connection and socket communication. There is a set
ScienceonaSphere-WaysofAddingInteractivityintotheUniqueProjectionSystem
429

of text messages ensuring the data interchange and
actions providing (e.g., GAME_START, WIIS_ADD,
GAME_CLOSED, WII_ANSWER and many others).
If there is no task to solve, server application waits
and does nothing. If there comes any message,
server provides required action or sends the client
required data.
The last part of the whole game system that is
controlled directly by the user (edutainer) is the
game client. After it is connected to the server
application, it gets from the server list of available
games. When the selected game is started, edutainer
has a simple sequence of dialogs (each singular
window contains a question and a correct answer)
and can see what team of players has already
answered and if the answer was correct. The last
dialog shows results of the whole game. This
application can run on any computer connected into
the same network as the game server, the best is to
run it directly on the touch screen of the SOS
system. The edutainer can control the game directly
from the globe neighbourhood and he/she does not
have to keep any additional computer.
5 CONCLUSIONS
We have developed an interactivity module that was
used as a base for the interactive game designed
especially for groups of students and children.
During the development we had to explore SOS
features and possible ways how to affect the
visualization. The whole module and connected
application are created as an additional system that
can be connected to Science on a Sphere system and
extends the visualization system with an interactive
element without direct intervention into the original
equipment.
At this time the application has been already
tested, new games are being prepared and ideas for
further expansions and improvements are being
collected. Presently we would like to implement two
features, both of them are connected with the game
areas preparation process. We plan to add functions
for computing the game areas unions and we would
like to create module for loading geographical data,
so that the borders of states, continents or oceans
could be more precise and their preparation less time
consuming. The first function would enable to
prepare automatically e.g. area of any continent
simply as the union of all states in the continent. The
second extension would enable to use geographical
data (which are measured in various formats) to be
loaded into the application and processed into the
form of clickable areas.
We believe that there are many possible usage of
the SOS interactive module. Except for the
interactive game we have designed an application
that is not oriented on the game system and that can
be implemented in the future. It was designed as the
tool for visualization of information about
interesting places. The interactive application would
give the user better control about what to see. By the
gamepad it would be possible to choose one of
predefined areas/places, click on them and ask the
system to show prepared additional information e.g.
in the form of audio or overlaid image.
ACKNOWLEDGEMENTS
This action is realized by the project NEXLIZ –
CZ.1.07/2.3.00/30.0038, which is co-financed by the
European Social Fund and the state budget of the
Czech Republic. The authors would like to thank
Techmania Science Centre for enabling our work on
the unique equipment of Science on a Sphere and to
Scott Muller from BW Color Prints and Jindřich
Skupa from UWB for valuable advices.
REFERENCES
32Feet.NET library, 2014, http://32feet.codeplex.com/
[cit. 2014-09-25]
BlueCove, 2008, http://bluecove.org/ [cit. 2014-09-22]
BlueZ, 2014, www.bluez.org [cit. 2014-09-25]
Schneider, P., Berly, D. H., 2002, Geometric Tools for
Computer Graphics (The Morgan Kaufmann Series in
Computer Graphics, Morgan Kaufmann; 1
st
edition.
LatLon, 2014, http://www.worldatlas.com/aatlas/infopage/
latlong.gif. [cit. 2014-09-23]
NOAA, 2014, http://www.noaa.gov/ [cit. 2014-09-19]
SOS, 2014, http://sos.noaa.gov [cit. 2014-09-19]
SOS – automation, 2014, http://sos.noaa.gov/Docs/
automation.4.0.html. [cit. 2014-09-24]
SOS – sphere orientation, 2014, http://sos.noaa.gov/Docs/
automation.4.0.html#sphere_orientation [cit. 2014-09-
25]
Techmania Sciece Center (TSC), 2014, http://
techmania.cz/lang.php?lan=1 [cit. 2014-10-01]
Wireless Communication Library, 2014, http://
www.btframework.com/ [cit. 2014-09-25]
GRAPP2015-InternationalConferenceonComputerGraphicsTheoryandApplications
430
