
Estimation of Fingertip Force from Surface EMG
A Multivariate Bayesian Mixture of Experts Approach
Tara Baldacchino
1
, William Jacobs
2
, Sean R. Anderson
2
, Keith Worden
1
and Jennifer Rowson
1
1
Dynamics Research Group, Department of Mechanical Engineering, University of Sheffield, Sheffield, U.K.
2
Department of Automatic Control and Systems Engineering, University of Sheffield, Sheffield, U.K.
Keywords:
sEMG Signals, Finger Force Regression, Variational Bayes, Multivariate Mixture of Experts, Prosthetic Hand.
Abstract:
Improving the dexterity of active prostheses is a major research area amalgamating machine learning algo-
rithms and biosignals. A recent research niche has emerged from this- providing proportional control to a
prosthetic hand by modelling the force applied at the fingertips using surface electromyography (sEMG). The
publicly released NinaPro database contains sEMG recording for 6 degree-of-freedom force activations for
40 intact subjects. In this preliminary study the authors successfully perform multivariate force regression
using Bayesian mixture of experts (MoE). The accuracy of the model is compared to the benchmark set by
the authors of NinaPro; comparable performance is achieved, however in this work a lower dimensional fea-
ture extraction representation obtains the best modelling accuracies, hence reducing training time. Inherent
to the Bayesian framework is the inclusion of uncertainty in the model structure, providing a natural step
in obtaining confidence bounds on the predictions. The MoE model used in this paper provides a powerful
method for modelling force regression with application to actively controlling prosthetic and robotic arms for
rehabilitation purposes, resulting in highly refined movements.
1 INTRODUCTION
The rapidly developing state of the art in hand pros-
thetics is seeing the advancement of active prostheses
capable of highly dexterous kinematics with a high
degree-of-freedoms (DoF). The advent of this new
generation of prostheses provides a challenge for the
bio-robotics and rehabilitation engineering communi-
ties in developing sophisticated control strategies that
are capable of accurately predicting a large range of
human movements from user intent.
The feasibility of fine movement detection of the
upper limb has progressed rapidly in recent years, par-
tially due to advances in machine learning techniques.
There has been a bridging of the machine learn-
ing and rehabilitation robotics communities, bring-
ing together state-of-the-art robots/prosthetics and ad-
vanced algorithms (Castellini and van der Smagt,
2009). A variety of techniques are available for
obtaining biosignals for use as a human-machine-
interface (HMI), (Lebedev and Nicolelis, 2006). Sur-
face electromyography (sEMG) has become increas-
ingly popular as an HMI because of distinct advan-
tages in providing a non-invasive, relatively simple
and low cost method for voluntary activation.
Harnessing sEMG signals for the control of hand
prosthetics has a long history (Saridis and Gootee,
1982). However, until recently the control of pros-
thetics via sEMG was largely restricted to on-off con-
trol, often achieved by the classification of various
hand/wrist movements (Peleg et al., 2002). Most of
the literature concentrates on classifying these move-
ments using sEMG signals by applying appropri-
ate classifier techniques, see (Ferguson and Dunlop,
2002; Farrell and Weir, 2008; Atzori et al., 2012)
among others. A more recent and exciting new area is
the domain of proportional control by performing re-
gression between sEMG and the force applied at the
fingertips. This has the potential to provide the user
with a much greater functionality in multiple DoF
(Muceli and Farina, 2012).
Previous studies aimed at achieving proportional
control have met with some success. One of the
first investigations into force regression was done by
(Castellini and van der Smagt, 2009) where feed-
forward neural networks and support vector machines
(SVM) were used for both classification of move-
ments, then separately for force control at the finger-
tips. More recently finger force control has been per-
formed using; SVMs (Castellini and K
˜
oiva, 2012) and
270
Baldacchino T., Jacobs W., Anderson S., Worden K. and Rowson J..
Estimation of Fingertip Force from Surface EMG - A Multivariate Bayesian Mixture of Experts Approach.
DOI: 10.5220/0005260402700276
In Proceedings of the International Conference on Bio-inspired Systems and Signal Processing (BIOSIGNALS-2015), pages 270-276
ISBN: 978-989-758-069-7
Copyright
c
2015 SCITEPRESS (Science and Technology Publications, Lda.)

different nonlinear kernel functions trained via ridge
regression (Gijsberts et al., 2014). Linear and nonlin-
ear techniques were analysed in (Hahne et al., 2014)
for regression analysis of wrist movements, includ-
ing a mixture of experts (MoE) model limited to two
experts and trained using iterative reweighted least
squares separately for each DoF.
In this work the authors propose a novel frame-
work for performing force regression for finger con-
trol using a flexible multivariate Bayesian MoE
model. To the authors’ knowledge, using both a
Bayesian approach and MoE models to identify fin-
ger force regression from sEMG signals has not been
performed before. The adoption of a MoE model de-
scribes the natural sEMG/force relationship by break-
ing down different movements into individual linear
models. Furthermore, the neuromusculare and biome-
chanics of finger movements are typical of biolog-
ical systems in that they are subject to uncertainty,
which the authors desire to characterise as an intrin-
sic part of the modelling algorithm. Therefore the
approach proposed here is to perform the estimation
using Bayesian inference. The Bayesian framework
inherently incorporates uncertainty into the training
of the model via distributions over the parameters.
It also naturally allows the evaluation of confidence
bounds of the predicted signal thus providing a per-
formance check of the model at hand.
The MoE model was introduced in (Jacobs et al.,
1991). It probabilistically divides the input space of
a system using gates and allows experts to specialise
on certain regions of the input space. A powerful fea-
ture of MoE models is that the gates allow soft splits
of the input space that are functions of some or all of
the input variables. There are various different struc-
tures of the MoE model, and numerous methods for
training the model, see (Yuksel et al., 2012), and ref-
erences therein, for a recent review. The MoE model
is trained using variational Bayesian expectation max-
imisation (VBEM) using analytical closed form equa-
tions providing fast training times. Also, this form of
MoE described is capable of modelling several out-
puts simultaneously at little additional cost compared
to training a single output MoE, and hence it is re-
ferred to as multivariate Bayesian MoE. The MoE
model structure and training framework used in this
paper follows the work in (Baldacchino et al., 2014b),
and further developed in (Baldacchino et al., 2014a).
The rest of the paper is structured as follows. Sec-
tion 2 describes the sEMG/force dataset used in this
paper, along with preprocessing methods for sEMG
signals. The multivariate Bayesian MoE framework
is given in Section 3, and results on the sEMG/force
dataset are presented in Section 4.
2 NinaPro DATA
This section gives a brief description of the data used
in this paper: the second version of the publicly re-
leased NinaPro (Non-invasive Adaptive Prosthetics)
database. Details of the preprocessing performed on
the data are also given.
2.1 The Dataset
The NinaPro database contains surface sEMG record-
ings collected from 40 intact subjects while perform-
ing a large number of common hand movements and
grasp positions, including measurement of the applied
forces at the fingertips (Gijsberts et al., 2014).
The data analysed in this paper consists of sEMG
recordings collected while subjects produce a set of
nine force patterns given in Table 1, by pressing down
with one or more digits. Corresponding force mea-
surements were considered (6 signals): flexion of the
five digits as well as abduction of the thumb. sEMG
signals were recorded by 12 electrodes on the arm.
The 12 electrodes consisted of: 8 equally spaced
around the forearm at the height of the radio-humeral
joint, one on the finger extensor and flexor muscles
respectively, and one each on the biceps and triceps
(Figure 1). Each subject had to perform each of the
9 movements 6 times. In order to prevent muscle
fatigue, a rest period was enforced in between each
movement and each repetition. More information and
detail regarding the setup and data collection can be
found in (Atzori et al., 2012; Gijsberts et al., 2014).
Table 1: Description of the 9 force movements.
# Movement Description
F1-F4 Flexion of little through to index fingers.
F5/F6 Abduction/Flexion of the thumb.
F7 Flexion of the index and little finger.
F8 Flexion of the ring and middle finger.
F9 Flexion of the index finger and the thumb.
2.2 Data Preprocessing
The data preprocessing employed in this paper fol-
lows the proposed control scheme found in (Gijsberts
et al., 2014). All the data was first standardised to
be zero mean and unit variance using statistics calcu-
lated solely from the training set. The data was then
split into a training and testing set based on the repe-
tition of movements; the second and fifth repetitions
were used for testing and the four remaining repeti-
tions were used for training.
The signals were segmented into windows and FE
was performed on the windowed data. The signals
EstimationofFingertipForcefromSurfaceEMG-AMultivariateBayesianMixtureofExpertsApproach
271
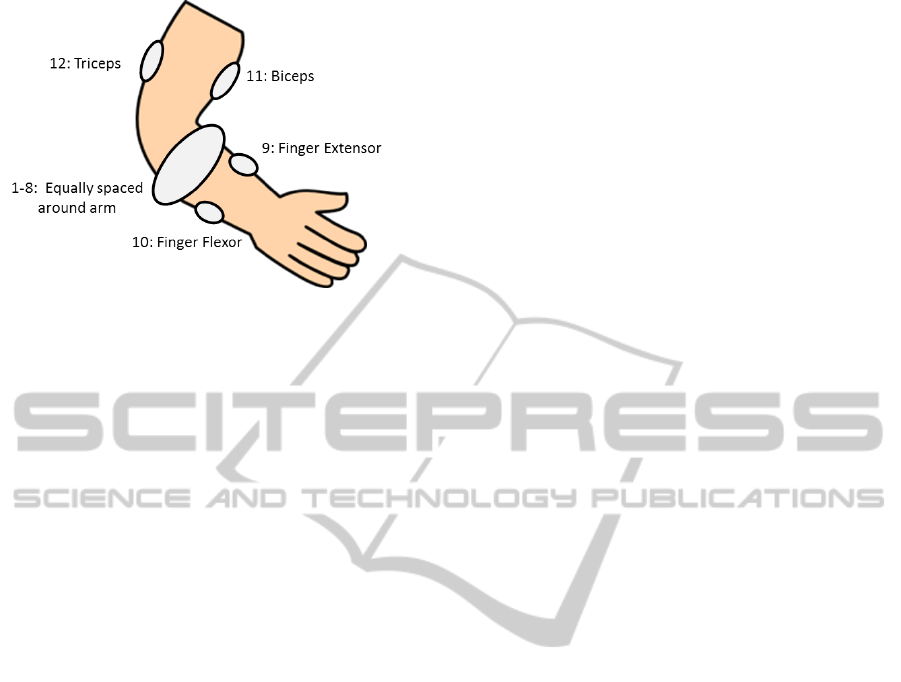
Figure 1: Placement of the 12 sEMG electrodes on the arm.
were segmented into windows of 400ms (800 sam-
ples) with a sliding window increment of 10ms (20
samples). Regression was then performed on the ex-
tracted features using the method described in Section
3. For computational feasibility the training set was
subsampled by a factor of 10 (at regular intervals) re-
sulting in approximately 3000 data points for training.
Three commonly used sEMG feature extractions
(FEs) are considered and compared in this work;
the root mean square (RMS), the marginal discrete
wavelet transform (mDWT) and sEMG histogram
(HIST). These FEs were chosen in order to compare
with the benchmark set in (Gijsberts et al., 2014),
and details can be found there. The RMS is a low
dimensional FE where the dimensionality of the fea-
ture space is the same as the number of inputs (in this
case 12), whilst the mDWT and HIST are high di-
mensional FEs having effective input dimensions of
36 and 240 respectively.
3 MULTIVARIATE BAYESIAN
MIXTURE OF EXPERTS
In Section 3.1 the multivariate MoE regression model,
including a probabilistic model, is defined based on
the MoE model developed in (Baldacchino et al.,
2014a). Training of the MoE model within a Bayesian
framework is discussed in Section 3.2.
3.1 Multivariate MoE Regression
Model
A MoE model with M regression experts, at time in-
stant n, is given by
y
y
y
n
=
M
∑
i=1
g
i
(x
x
x
n
, θ
g
i
) f
i
(x
x
x
n
, W
i
) , (1)
where x
x
x
n
= [x
1
n
, . . . , x
d
x
n
] ∈ R
1×d
x
is the input vector,
and y
y
y
n
= [y
1
n
, . . . , y
d
y
n
] ∈ R
1×d
y
is the corresponding
output vector. The i
th
expert function is restricted to
be linear such that f
i
(x
x
x
n
, W
i
) = W
>
i
[x
x
x
n
1] (the 1 repre-
sents a bias term). W
i
∈ R
d
x
+1×d
y
is the matrix rep-
resenting the expert weights. The i
th
gating function,
g
i
(·), is a normalised Gaussian function.
Given that N training data points are available,
then X = [x
x
x
1
, . . . , x
x
x
N
] ∈ R
N×d
x
and Y = [y
y
y
1
, . . . , y
y
y
N
] ∈
R
N×d
y
. The joint complete-data likelihood is ex-
pressed as
p(X, Y, Z|π
π
π, Θ
Θ
Θ) =
N
∏
n=1
M
∏
i=1
π
i
N (x
x
x
n
|µ
µ
µ
i
, Λ
−1
i
)
× N (y
y
y
n
|W
0
i
[x
x
x
n
1], χ
−1
i
)
z
ni
,
(2)
where N is the Gaussian distribution. Z =
{z
ni
}
M,N
i=1,n=1
∈ R
N×M
, are the latent variables such
that if (x
x
x
n
, y
y
y
n
) was generated from the i
th
expert
then z
ni
= 1, else it is 0. The gate parameters are
[π
π
π, θ
θ
θ
g
] = [π
π
π, {µ
µ
µ Λ
Λ
Λ}], where µ
µ
µ = {µ
µ
µ
i
}
M
i=1
is the mean
and Λ
Λ
Λ
−1
= {Λ
−1
i
}
M
i=1
is the covariance matrix. π
π
π =
{π
i
}
M
i=1
are the mixing coefficients satisfying π
i
≥ 0
and
∑
M
i=1
π
i
= 1. The expert parameters are θ
θ
θ
e
=
[W
W
W , χ
χ
χ], where W
W
W = {W
i
}
M
i=1
is the multidimensional
parameter weight matrix and χ
χ
χ
−1
= {χ
−1
i
}
M
i=1
is the
covariance matrix. The set of unknown model param-
eters is given by [π
π
π, Θ
Θ
Θ] = [π
π
π, θ
θ
θ
g
, θ
θ
θ
e
].
3.2 Variational Bayesian Learning
Conjugate priors are assigned to all the parameters ex-
cept for the mixing coefficients π
π
π (which are treated as
non-random variables). The assignment of prior dis-
tributions follows that found in the literature (Ueda
and Ghahramani, 2002; Baldacchino et al., 2014a)
and appropriately adjusted for use with multivariate
output signals. The joint distribution of all the ran-
dom variables can be expressed hierarchically as,
p(Y, X , Z, Θ
Θ
Θ|π
π
π)
= p(Y, X|Z, π
π
π, Θ
Θ
Θ)p(Z|π
π
π)p(µ
µ
µ, Λ
Λ
Λ)p(W
W
W , χ
χ
χ|a
a
a)p(a
a
a)
(3)
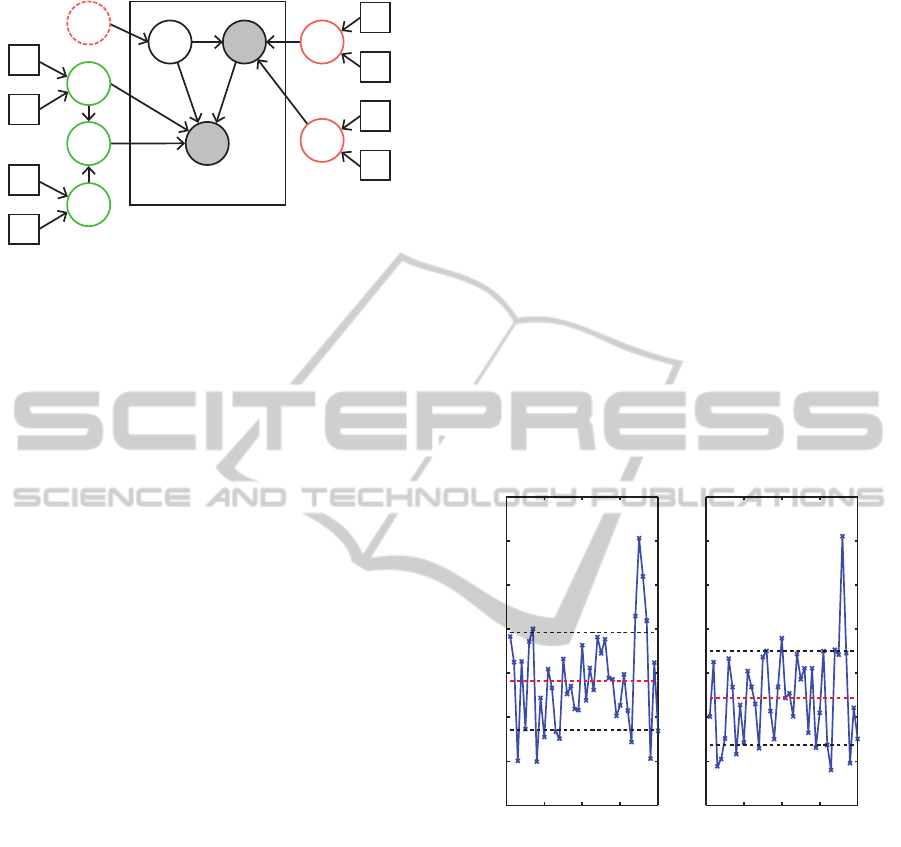
as shown in Figure 2.
An approximate Bayesian framework is used in
order to find the posterior distribution of the param-
eters p(Θ
Θ
Θ, a
a
a|Y ), since the marginal likelihood P(Y )
consists of a complex integral. The choice of conju-
gate prior distributions, along with a latent variable
model is elegantly accommodated by the variational
Bayes expectation-maximisation (VBEM) framework
(Beal and Ghahramani, 2003). The VBEM algo-
rithm is an iterative process which updates approx-
imate posterior distributions for the latent variables
BIOSIGNALS2015-InternationalConferenceonBio-inspiredSystemsandSignalProcessing
272
c
0
d
0
a
W
�
y
n
μ
Λ
N
z
n
x
n
Q
0
λ
0
χ
B
0
ν
0
m
0
β
0
Figure 2: Graphical model for Bayesian multivariate
MoE model: the plate denotes N i.i.d observations (ob-
served=grey shading, unobserved=no shading), red cir-
cles=gate parameters, green circles=expert parameters,
square boxes=known hyperparameters and dashed circle in-
dicates a non-random parameter.
and model parameters sequentially. The approximate
posterior distributions are denoted by q(·) and re-
ferred to as variational posterior distributions.
The variational distributions of both the latent
variables and the parameters for the MoE model de-
scribed in this paper can be expressed in a factorised
form as follows,
q(Z, µ
µ
µ, Λ
Λ
Λ, W
W
W , χ
χ
χ, a
a
a) = q(Z)q(µ
µ
µ, Λ
Λ
Λ)q(W
W
W , χ
χ
χ)q(a
a
a) . (4)
Since conjugate priors for the model parameters were
used, the functional form of the variational distribu-
tions will be the same as the priors. The update equa-
tion for π
π
π is obtained using maximum likelihood tech-
niques. A posterior predictive distribution can also be
obtained such that predictions of the output to new
unseen inputs can be performed. This distribution is
expressed as p(y
n
0
|x
x
x
n
0
, D), where D = [Y, X ] is the
training data, and n
0
= N + 1 is the new data point.
Details of the necessary equations can be found in
(Baldacchino et al., 2014a), and they are omitted here
for brevity (due to a lack of space).
4 RESULTS
Before implementing the training algorithm described
in the previous sections, the windowed data was stan-
dardised to zero mean and unit variance again. This
was done in order to simplify the assignment of hy-
perparameter values for the prior distributions which
were set in such a way so as to define broad priors.
4.1 Multivariate Bayesian MoE for
sEMG Data
The multivariate Bayesian MoE model is trained on
the data obtained from all 40 subjects, and all the
6 forces are trained together at negligible additional
cost compared to a single output. The algorithm is ini-
tialised with 10 experts since there are 9 movements
and a rest period. Preliminary results indicated that
the HIST FE is impractical in the context of this work
due to such a high dimensionality of the feature space.
Thus the algorithm was run for the mDWT and RMS
FEs, and a comparison between the two is considered.
The performance of the final models is analysed using
a normalised root mean square error (NRMSE, which
is the RMSE divided by the range of the output), and
the coefficient of determination (R
2
).
Figure 3 shows the average NRMSE across all
subjects (averaged over the 6 DoF force activations)
for the two FE representations (mDWT and RMS).
NRMSE (%)
Subjects
RMS
0 10 20 30 40
2
3
4
5
6
7
8
9
NRMSE (%)
Subjects
mDWT
2
3
4
5
6
7
8
9
0 10 20 30 40
Figure 3: A plot of average NRMSE for the model obtained
for each subject for the mDWT and RMS FEs. The red
dashed line represents the mean NRMSE (over the 40 sub-
jects), while the black dashed lines represent ± one std.
All subjects achieve an acceptable level of perfor-
mance, with Subject 35 for mDWT and Subject 36 for
RMS having the worst NRMSE of 8.07% and 8.11%
respectively. The best performance was achieved by
Subject 8 for mDWT and Subject 33 for RMS having
an NRMSE of 2.99% and 2.8% respectively. The val-
ues of the NRMSE are comparable to those reported
by (Castellini and van der Smagt, 2009) where the au-
thors analyse finger force regression using SVM for a
different dataset, and report an average NRMSE of
7.89%. The mean and unit standard deviation (std)
for both R
2
and NRMSE are reported in Table 2.
Both types of FE techniques achieve comparable
EstimationofFingertipForcefromSurfaceEMG-AMultivariateBayesianMixtureofExpertsApproach
273

Table 2: % average R
2
and NRMSE ± one std.
Feature type Average R
2
Average NRMSE
mDWT 88.21±5.30% 4.82±1.11%
RMS 89.81±5.00% 4.44±1.06%
performance, however it is interesting to note that the
RMS FE performs better than the mDWT. This is in
contrast to that reported in (Gijsberts et al., 2014),
where they obtain R
2
values of 91.74% and 88.93%
for mDWT and RMS respectively for a exp-χ
2
ker-
nel ridge regression. The RMS feature provides a
much simpler FE representation, which also results in
much faster training of the data (on average RMS took
5.47min compared to 13.3min for mDWT for 100
runs). The RMS FE is also quicker to compute, and
for this training data the preprocessing time took on
average 5.9s for RMS versus 417.5s for mDWT. RMS
FE also allows a natural interpretation between the in-
puts and outputs, because the inputs are the physical
sEMG signals themselves.
To investigate the performance of the models on
each of the 9 force patterns, the average NRMSE
per pattern is shown in Figure 4. Patterns involving
the individual activation of the four fingers (F1-F4)
are all characterised by high performance, and ad-
duction/abduction of the thumb (F5) achieves com-
parable performance (but with a slightly higher vari-
ance). The rest of the four movements (F6-F9) have
a slightly worse performance, especially those move-
ments involving flexion of the thumb (F6 and F9).
F1 F2 F3 F4 F5 F6 F7 F8 F9
1
2
3
4
5
6
7
Force Pattern
NRMSE (%)
mDWT
RMS
Figure 4: A plot of the average NRMSE for each force pat-
tern for mDWT and RMS FEs. The error bars indicate unit
std.
Several authors, for example (Castellini and
K
˜
oiva, 2012), have attributed the fact that predictions
of thumb movements are worse than for other fingers
due to no sEMG activity being recorded from the ma-
jority of the thumb muscles which are located at the
wrist. The RMS performs better than mDWT overall,
and again the values for the NRMSE are comparable
to those reported in the literature, such as (Castellini
and K
˜
oiva, 2012). The R
2
values are not reported
for the individual force patterns since the condition
∑
n
e
n
=
∑
n
(y
y
y
n
−
ˆ
y
y
y
n
) is not necessarily 0 and so the R
2
value can go negative even though the model provides
a good fit. Thus, direct comparison to the benchmark
is not possible since it would result in an incorrect in-
terpretation. However, the NRMSE values reported
here highlight what the authors in (Gijsberts et al.,
2014) established: single finger movements are easier
to predict than multiple finger and thumb movements.
4.2 Predictions for RMS FE
The results reported in this section concern the mod-
els obtained when the RMS FE technique was used,
since it shows better performance than the mDWT
and it is computationally cheaper to work with RMS.
The top plot given in Figure 5 shows the predic-
tions (red) obtained on the testing data (blue) for the
fourth force DoF (index flexion) for Subject 1. The
signals are plotted on a background of colours where
each colour indicates a particular expert. The 99%
confidence intervals are also plotted (black dashed),
since these arise naturally from the Bayesian infer-
ence framework. The confidence intervals comfort-
ably encloses most of the observed data (blue). In
both cases the model predictions of the force follow
the observed data well. Even more interesting is the
assignment of experts; the experts identified in the
training set are also the same ones used in the test
set. The rest period is almost always identified, and
it is assigned its own expert (bright green). Move-
ments corresponding to individual fingers along with
flex thumb, flex index and little, and flex index and
thumb are again assigned individual experts. Two ex-
perts are needed to model abduction of the thumb, and
this could be due to no sEMG activity being recorded
from the majority of the thumb muscles, and so this
presents difficulty in modelling it accurately. Flexion
of the ring and middle finger is modelled using the ex-
perts from both their corresponding individual finger
movements (dark green and pink). This assignment
of experts has the potential for further investigatory
work for classification of finger movements.
The bottom plot of Figure 5 shows the predictions
for all 6 DoF force measurements of all the nine force
patterns. Again, all the forces and force patterns are
predicted accurately, and similar to (Gijsberts et al.,
2014) the model even learned the involuntary negative
forces which they attribute to synergistic or compen-
satory mechanisms.
BIOSIGNALS2015-InternationalConferenceonBio-inspiredSystemsandSignalProcessing
274
Number of Samples
Force (N)
Test Data
0 500 1000 1500 2000 2500
0
5
−5
10
15
20
25
−10
ex little ex ring ex middle ex index
abduct
thumb
ex
thumb
ex index
& little
ex ring
& middle
ex index
& thumb
Observed Data
Model Predictions
99% CI
Number of Samples
Force (N)
0 500 1000 1500 2000 2500
0
5
−5
10
15
20
25
−10
ex little ex ring ex middle ex index
abduct
thumb
ex
thumb
ex index
& little
ex ring
& middle
ex index
& thumb
Little Ring Middle Index Thumb Abduction Thumb Flexion
Figure 5: Top plot: Predictions (red) versus observed data (blue) including 99% confidence intervals (dashed black) on the
test data of the fourth DoF force activation. The background of colours represent the individual experts. Bottom plot: A plot
of observed (solid) and predicted (dashed) forces for the second and fifth repetitions of all nine force patterns. Each colour
corresponds to a force measurement. For both plots, black vertical lines indicates when a movement starts.
Integral to the Bayesian training is the use of au-
tomatic relevance determination (ARD), whereby non
influential inputs are ’turned off’ thus avoiding over-
fitting and allowing the possibility of removing sur-
plus electrodes. The ARD values obtained from up-
dating the appropriate hyperparameters are analysed.
Figure 6 shows a box plot of the average ARD for
each sEMG input signal for all 40 subjects. Large
ARD values indicate that an input is heavily weighted
while low ARD values indicate that the particular in-
put is heavily attenuated. Not surprisingly, electrodes
11 and 12 (biceps and triceps) seem to have the least
effect on finger movement.
5 CONCLUSION
In this paper the authors propose a novel method for
the modelling of force regression from sEMG sig-
nals for the purpose of proportional control of pros-
thetic hands employing a multivariate Bayesian MoE
model. The algorithm presented provides fast learn-
ing of the data due to analytical closed form equa-
tions. The results on the 40 subjects are encourag-
ing since accurate predictions for several finger move-
ments are achieved. This method also highlighted that
better results can be achieved with a low dimensional
FE representation than with a higher one, thus reduc-
ing computational effort even further. The low dimen-
sional FE allows investigation into the influence of the
0
5
10
15
20
25
30
35
sEMG signals
ARD value
1 2 3 4 5 6 7 8 9 10 11 12
Figure 6: Box plot of average ARD values (over the number
of experts) for each sEMG input signal.
inputs on the force regression as the inputs are the
physical sEMG signals themselves. The fast manner
in which predicted outputs are generated suggests that
this method will be easily transferable to an online
situation for instantaneous proportional control of a
prosthetic hand (for a single data point it takes on av-
erage 16.8µs to generate a predicted output value). It
has been well documented within the literature that
for a method to be successful within a clinical ap-
plication, it should require minimum user training,
have low computational complexity and perform ad-
equately with few electrodes. The method presented
EstimationofFingertipForcefromSurfaceEMG-AMultivariateBayesianMixtureofExpertsApproach
275

in this work achieves all the above criteria. It will
be interesting to apply this framework to sEMG/force
data collected from amputees. As future work, the
authors are investigating the possibility of a simulta-
neous regression-classification framework for finger
force control.
ACKNOWLEDGEMENTS
Authors T. Baldacchino and W. Jacobs would respec-
tively like to thank the Leverhulme Trust (130986)
and EPSRC (EP/K503149/1) for financial support.
REFERENCES
Atzori, M., Gijsberts, A., Heynen, S., Hager, A.-G. M., De-
riaz, O., van der Smagt, P., Castellini, C., Caputo,
B., and M
¨
uller, H. (2012). Building the NINAPRO
database: A resource for the biorobotics community.
In The Fourth IEEE RAS/EMBS International Conf on
Biomedical Robotics and Biomechatronics.
Baldacchino, T., Cross, E. J., Worden, K., and Rowson, J.
(Under Review, 2014a). Variational Bayesian mixture
of experts models and sensitivity analysis for nonlin-
ear dynamical systems. Mechanical Systems and Sig-
nal Processing.
Baldacchino, T., Worden, K., and Rowson, J. (2014b). Sen-
sitivity analysis using Bayesian mixture of experts for
a bifurcating Duffing oscillator. In International Conf
on Noise and Vibration (ISMA) 2014, Leuven.
Beal, M. J. and Ghahramani, Z. (2003). The variational
Bayesian EM algorithm for incomplete data: with ap-
plication to scoring graphical model structures. In
Bayesian Statistics 7. Oxford University Press.
Castellini, C. and K
˜
oiva, R. (2012). Using surface elec-
tromyography to predict single finger forces. In
The Fourth IEEE RAS/EMBS International Conf on
Biomedical Robotics and Biomechatronics.
Castellini, C. and van der Smagt, P. (2009). Surface EMG
in advanced hand prosthetics. Biological Cybernetics,
100(1):35–47.
Farrell, T. R. and Weir, R. F. (2008). A comparison of
the effects of electrode implantation and targeting on
pattern classification accuracy for prosthesis control.
IEEE Trans on Bio-Medical Electronics, 55(9):2198–
2211.
Ferguson, S. and Dunlop, G. (2002). Grasp recognition
from myoelectric signals. In Proceedings of the Aus-
tralasian Conf on robotics and automation.
Gijsberts, A., Atzori, M., Castellini, C., M
¨
uller, H., and Ca-
puto, B. (2014). The movement error rate for eval-
uation of machine learning methods for sEMG-based
hand movement classification. IEEE Trans on Neural
Systems and Rehabilitation Engineering, 22(4):735–
744.
Hahne, J. M., mann, F. B., Jiang, N., Rehbaum, H., Fa-
rina, D., M
¨
uller, F. C. M. K.-R., and Parra, L. C.
(2014). Linear and non-linear regression techniques
for simultaneous and proportional myoelectric con-
trol. IEEE Trans on Neural Systems and Rehabilita-
tion Engineering.
Jacobs, R. A., Jordan, M. I., Nowlan, S. J., and Hinton, G. E.
(1991). Adaptive mixtures of local experts. Neural
Computation, 3:79–87.
Lebedev, M. A. and Nicolelis, M. A. (2006). Brainmachine
interfaces: past, present and future. Trends in Neuro-
sciences, 29(9):536–546.
Muceli, S. and Farina, D. (2012). Simultaneous and pro-
portional estimation of hand kinematics from EMG
during mirrored movements at multiple degrees-of-
freedom. IEEE Trans on Neural Systems and Reha-
bilitation Engineering, 20(3):371–378.
Peleg, D., Braiman, E., Yom-Tov, E., and Inbar, G. (2002).
Classification of finger activation for use in a robotic
prosthesis arm. IEEE Trans on Neural Systems and
Rehabilitation Engineering, 10(4):290–293.
Saridis, G. N. and Gootee, T. P. (1982). EMG pattern analy-
sis and classification for a prosthetic arm. IEEE Trans
on Biomedical Engineering, 29(6):403–412.
Ueda, N. and Ghahramani, Z. (2002). Bayesian model
search for mixture models based on optimizing vari-
ational bounds. Neural Networks, 15:1223–1241.
Yuksel, S. E., Wilson, J. N., and Gader, P. D. (2012). Twenty
years of mixture of experts. IEEE Trans. Neural Netw.
Learning Syst., 23(8):1177–1193.
BIOSIGNALS2015-InternationalConferenceonBio-inspiredSystemsandSignalProcessing
276
