
Nanophotonic Biosensors Within Lab on Chip Optical Systems
Daniel Hill
UMDO, Institut de Ciència dels Materials, Universitat de Valencia, Catedrático José Beltrán, Paterna, Spain
Keywords: Nanophotonics, Slot-Waveguides, Ring Resonators, Porous Silicon, Biosensing, Lab-on-Chip, Birefringence,
Quantum Dots.
Abstract: For ring resonator based sensors, volumetric limits of detection (LoD) of 510
–6
RIU and 8.3x10
−6
RIU
(refractive index units) for sensitivities of 246nm/RIU and 2169nm/RIU were reported from FP6 SABIO (at
1.31µm) and FP7 InTopSens (at 1.55µm) respectively. These compare well to the state of art of 7.6×10
−7
RIU
for a sensitivity of 163 nm/RIU, as does the porous alumina based membrane sensors in FP7 Positive with
their LoD of 5x10
-6
RIU. More interestingly for the membrane sensors, the standard deviation of their
measured values was below 5% and their flow through design with lateral distances to the sensor surface less
than a diffusion length permit fast response times, short assay times and the use of small sample volumes (<
100 µl). For protein binding recognition, within SABIO a surface LoD of 0.9 pg/mm
2
for anti-BSA on a
gluteraldehyde-covered surface was recorded, corresponding to a 125ng/ml anti-BSA solution, whilst in
InTopSens 5pg/mm
2
and 10ng/ml for biotin on a streptavidin coated surface was seen. For an assay of β-
lactoglobulin - anti-β-lactoglobulin - anti-rabbit-IgG –streptavidin conjugated CdSe quantum dots the Positive
sensors demonstrated a noise floor for individual measurements of 3.7ng/ml (25pM) for total assay times of
under one hour.
1 INTRODUCTION
Increasing demands for rapid, reliable and
economical near patient or in the field testing has led
to strong and growing trend towards in-vitro point of
care (PoC) sensing for clinical diagnosis, food safety,
environmental monitoring, safety and security (Fan et
al., 2008) (Hill, 2011). The demands for PoC sensing
that can be used, such as by a single medical
practitioner or in a remote field crop-testing
environment, are driven by their facilitation of a
massive socio-economic impact from the general
improvement of quality of life they would bring. PoC
sensing is enabled through the scaling of analytical
chemical and biological instruments down to a single
chip (Janasek et al., 2006) leading to: automation of
the analysis, increased mobility of the instrument,
shorter response times, reduced manual sample
handling, and a low cost per test. Typical
requirements for assay requirements consists of the
reliable and selective identification of extremely low
concentrations of biomarkers (infectious agents,
pesticides, cardiac markers, allergens etc.) from other
matter within small volumes of complex matrices
(e.g. whole blood, sputum swabs, faeces, cell
lysate…) within a few minutes. Furthermore, it
should have a commercially viable cost and be
useable by a relatively unskilled operator outside of a
lab environment. PoC in-vitro diagnostic devices are
therefore required to provide fast, sensitive and
selective analysis of assays, ideally in a parallel
format and therefore of a technology that permits the
fabrication of a high density of sensor ‘spots’ per chip
area, as well as negating the need for lengthy off-chip
sample preparation, all at an acceptable cost. To that
end, many of the new approaches that have been
explored are based on highly integrated sensors
within a Lab on Chip format (Ligler et al,, 2009).
At the core of these devices is the biosensor
(Brecht et al., 1995) and those based on optical
interrogation offer important advantages such as: 1)
non-invasive, safe and multi-dimensional (intensity,
wavelength, phase, polarization) detection; 2) well-
established tools from communication and Micro-
Nano technologies (MNT) industries (lasers,
detectors, waveguides) and 3) optical frequencies that
coincide with a wide range of physical properties of
bio-related materials.
Refractive index (RI) sensing is often used in real-
time monitoring of chemical processes and, when
used with separation techniques such as liquid
60
Hill D..
Nanophotonic Biosensors Within Lab on Chip Optical Systems.
DOI: 10.5220/0005259500600068
In Proceedings of the 3rd International Conference on Photonics, Optics and Laser Technology (PHOTOPTICS-2015), pages 60-68
ISBN: 978-989-758-093-2
Copyright
c
2015 SCITEPRESS (Science and Technology Publications, Lda.)

chromatography or capillary electrophoresis,
universal solute detection systems can be created
(Markov et al., 2002). Within LoC devices, silicon
nanophotonics has found much use recently as
affinity sensors (Zinoviev et al., 2008) as the RI of
aqueous macromolecular solutions is linear with
macromolecule density (De Feijter et al., 1978) and
so the mass of bound macromolecules, such as
proteins, DNA, peptides, to a waveguide can be
derived from measurements of the surface evanescent
field. The commercially successful surface plasmon
resonance (SPR) based sensors (Brecht et al., 1995)
are such an example. Furthermore, the nanophotonic
sensors can be economically mass-produced in a
highly integrated format by using the same waferscale
microfabrication technologies as those sued for
electronic microchips. Thus, to bring the powerful
tool of highly integrated and reliable sensing into the
hands of a wider user base, there is a strong interest
in integrating nanophotonic sensors into LOC
platforms for PoC applications. In this paper we
compare various nanophotonic transducers from
three EC funded projects (FP6 SABIO, FP7
InTopSens and FP7 Positive) that due to their small
footprints and ease of integration with other on-chip
optical and fluidic functions are particularly
interesting as sensors for LoC devices. In doing so,
we also compare them to the state of art for each
technology type to fully put their advances into
perspective.
2 SABIO
2.1 SABIO Nanophotonic Sensors
Optical ring resonators consist of a set of waveguides
with at least one being a closed loop that is coupled
to some sort of light input and output, conceptually
analogous for light to acoustic whispering galleries.
When light of the resonant wavelength is passed
through the loop from input waveguide, it builds up
in intensity over multiple round-trips due to
constructive interference and is output to the output
bus or detector waveguide which serves as a detector
waveguide. The ring acts as a filter with its finesse
determining how many select few wavelengths will
be at resonance within the loop and its quality factor
to how lossless it is. Researchers have been studying
them since the 1980s (Tiefenthaler et al., 1984)
(Lukosz et al., 1988) (Tiefenthaler et al., 1989) and
inspired by Almeida et al’s demonstration (Almeida
et al., 2004) (Xu et al., 2004) of slot waveguides in
Figure 1: A top view of the layout of the nanofabricated
SABIO optical chip (occupying a 3x7mm
2
area): Light is
injected at the surface grating coupler (C) and split, by the
multi-mode interference splitter (B), to the six sensing
channels M1–M6 and the two reference channels REF1 and
REF2. Inset are an optical micro-graph of the splitter (B);
and electron micro-graphs of the grating coupler (C), and a
slot-waveguide ring resonator (A), with an enlargement of
the coupling region.
2004 the SABIO project targeted the implementation
of these in a ring resonator format for biosensing. Si
planar waveguide ring resonators, and even more so
slot-waveguides ring resonators are very attractive for
biosensing due to their small footprint, high Q-
factors, and compatibility with on-chip optics and
microfluidics (Sohlström et al., 2010). Their design
permits parallel sensor operation which not only
yields higher throughput by multiple analyses of one
sample, or simultaneous analyses of multiple
samples, but it can also provide reference channels for
drift compensation and control experiments. Such
reference measurements are particularly important for
automated labs-on-chips without temperature
stabilization. In SABIO the optical chip (Figure 1)
was designed with 6 measurement channels and two
reference channels, and channel to slot-mode
converters were used for conversion between the two
waveguide types before and after the ring resonator
coupling regions, where the bus slot-waveguides have
rail widths of 400 nm and a slot width of 200nm.
The coupling gap was 350 nm and in the sensing
ring, asymmetric slot-waveguides with the inner rail
widened to 550 nm were used for high optical
confinement and low bending loss. Details of the
choice of low pressure chemical vapour deposition
(LPCVD) silicon nitride on thermally oxidized
silicon wafer technology, as well as general design
rules for the chip, that led to measurements being able
to be made over a 7K operating window, without
external temperature control and individual sensor
calibration (Gylfason et al., 2010), are beyond the
scope of this paper.
NanophotonicBiosensorsWithinLabonChipOpticalSystems
61

2.2 SABIO Measurements and
Discussion
In determining the volumetric RI sensitivity and limit
of detection for the SABIO chips, sensing
experiments were performed using a dilution series of
ethanol and methanol plugs in a running buffer of
deionized (DI) water. Full details of the sensing
experiments (Carlborg et al., 2010) are beyond the
scope of the paper including how a fitting algorithm
was used to determine more accurately the positions
of the drips in the ring characteristics, pushing down
the wavelength noise significantly to below the laser-
tuning step and the use of reference channels with DI
water to correct for drift. At 1300nm, an index
sensitivity of S
n
=246 nm/RIU was measured and the
sensor resolution (R) taken as 1.2pm, following the
convention of 3 standard deviations σ of the total
system noise, with the volumetric RI LOD given by
L
n
=R/S
n
and thus 5 x 10
-6
RIU.
The SABIO chip’s performance as a surface mass
sensor was studied by measuring the binding of anti-
bovine serum albumin (anti-BSA), injected in
increasing concentrations in a running buffer of
phosphate buffered saline (PBS), to a surface
selectively activated by a layer of the molecular linker
glutaraldehyde. From a saturation induced resonance
shift estimated at ∆λ=2.55 nm, with a surface density
of a monolayer (σ
p
) of anti-BSA measured at 2.0
ng/mm
2
by dual polarisation interferometry (DPI)
with the Farfield AnaLight 4D system, a mass
sensitivity, or S
m
=∆λ/σ
p
of S
m
=1.3 nm/(ng/mm
2
) was
measured. The surface mass detection limit, L
m
=R/S
m
,
where R is the sensor resolution, was determined at
0.9pg/mm
2
corresponding to a concentration of
125ng/ml anti-BSA in PBS solution.
The detection limits of 5 x 10
-6
RIU for volume
sensing and 0.9 pg/mm
2
or 125ng/ml for protein
binding,
compare favorably to other published ring
resonator results. These are primarily due to the use
of multiple transducers on the chip to compensate for
external disturbances, the high sensitivity of the slot-
waveguide ring resonators and the low system noise
of 1.2 pm from fitting an analytical model to the
spectrum, effectively due to utilizing all the
information available (Kazmierczak et al., 2009). As
seen ahead, this is in contrast to the approaches used
in the later projects InTopSens and Positive, neither
of which used a non-directly mass fabrication
compatible technology such as electron beam
lithography.
3 InTopSens
3.1 InTopSens Nanophotonic Sensors
Whereas the SABIO application required a chip
design with 6 ring resonator sensors, 64 were required
for the InTopSens application and therefore a far
smaller footprint per sensor. A starting point for
sensor development was therefore silicon-on-
insulator (SOI) ring resonators due to their higher
index contrast than those based on silicon nitride and
therefore potentially a higher degree of integration.
Moreover, they had previously demonstrated (De Vos
et al., 2007) a volumetric RI sensitivity of 70 nm/RIU
and LOD of 1.3x10
–5
RIU as well as a LOD of 7ng/ml
for protein binding (biotin-avidin) recognition.
Therefore for a suitably high degree of integration,
with an equal or better LoD, slot-waveguide racetrack
resonators with 100nm wide slots in SOI were
nanofabricated (Claes et al., 2009), with footprints of
just 13µm x 10µm, using the mass fabrication-
compatible optical lithography, opening the way
toward cheap, disposable chips in contrast to the
SABIO ring resonators.
3.2 InTopSens Measurements and
Discussion
Using aqueous salt solutions volumetric sensing
experiments with these SOI slot ring resonators,
demonstrated a refractive index sensitivity of 298
nm/RIU and a LOD of 4.2 x 10
-5
RIU (Figure 2). As
the sensitivity value lies within a range of theoretical
values from an empty slot to a liquid filled slot it
demonstrates that liquid has penetrated the narrow slot
region.
Figure 2: A comparison between the experimental
resonance wavelength shift of a normal-waveguide based
ring resonator and the theoretical and experimental
resonance wavelength shift of a slot-waveguide based ring
resonator for top refractive index.
PHOTOPTICS2015-InternationalConferenceonPhotonics,OpticsandLaserTechnology
62

After silanizing the sensor surface protein binding
experiments (biotin-avidin recognition) showed a
limit of detection of 10ng/ml (Claes et al., 2009), or
5pg/mm
2
. The saturation shift was 3.5 times that of the
SABIO device, lying between the theoretical values
for avidin binding only outside of the slot and for it
lying both inside and outside of the slot. Thus,
although it demonstrated that surface chemistry for
selective label-free sensing of proteins can be applied
inside a 100 nm wide slot region for a smaller foot
print slot waveguide sensor, it also showed a poorer
LoD compared to the SABIO device. Principally the
poorer LOD was due to a lower resolution or quality
factor mostly caused by bending and mismatch losses
although sidewall inclination, roughness from
silicon’s greater sensitivity to nanofabrication
limitations, the presence of a biochemical layer, and
absorption also contributed.
In an aim to improve the LoD whilst maintaining
a small footprint other ring resonators were fabricated
whose designs were based on modifications to
existing (slot) ring resonator waveguide sensors such
as:
• The use of notch ring resonator filters instead of
add-drop filters
• Increasing the sensor circumference
• Switching to 1300nm where water is less
absorbent
• Combining quasi-TE and quasi-TM modes
One such ring resonator demonstrated a
volumetric limit of detection of 5x10
–6
RIU through
aqueous salt solution sensing experiments and an
improved surface mass LOD of 2pg/mm
2
for protein
binding (biotin/avidin) experiments corresponding to
10ng/ml. Another was based around the use of the
Vernier effect through suitably designed cascaded ring
resonators that were folded to permit high integration.
For these (Claes et al., 2010), aqueous salt solution
sensing experiments demonstrated a volumetric
sensitivity of 2169nm/RIU and a limit of detection of
5x10
–6
RIU, equal to that of the larger SABIO
sensors, promising a favourable protein binding limit
of detection.
4 POSITIVE
4.1 Positive Nanophotonic Sensors
Planar nanophotonic sensors such as those in SABIO
and InTopSens have demonstrated LODs that meet
the criteria of analyte concentration measurements for
many applications. However, although some require
lower LoDs still, many sensors, including those in
SABIO and InTopSens, are far from becoming a
reality within commercial PoC diagnostic platforms
for other reasons. These include poor planar
integration, high fabrication costs, but most
importantly a slow time to response and subsequently
long times to assay result as well as the need for large
sample volumes and subsequently expensive
reagents. For example in both SABIO and InTopSens
the time taken to go from steady state concentration
to another was over 40 minutes and therefore assays
took typically far in excess of an hour whilst response
times to an analyte and/or reagent injection into their
microfluidic systems were typically in excess of 5
minutes. Furthermore, whilst SABIO and InTopSens
sensors required millilitres of blood, along with
millilitres of costly reagents, applications that test
young children can be limited to the ~100 µl of blood
taken by finger prick collection. All of these
deficiencies in both of these projects, and many
others, are due to the use of 2D or planar sensors and
the long path lengths of the analytes to their surfaces
relative to their diffusion lengths, arising from the
common use of lateral flow geometry in sensor
cartridge design.
Nanostructured materials like porous silicon (PSi)
or porous alumina (AAO) have however recently
gained special attention for sensing, due to their 3D
design allowing higher surface areas per unit planar
area for capturing analytes than planar biosensors,
permitting lower detection limits (Lazzara et al.,
2011) and higher integration of assays. Due to the use
of reflectrometric interference spectroscopy (RIfS)
however, optical biosensors based on porous
membranes (Orosco et al., 2009) (Tsang et al., 2012)
(Alvarez et al., 2009) (Kumeria, Kurkuri et al., 2012)
can have their pores only open at one end and the
diameters of those limited to 100nm to avoid light
scattering (Kumeria & Losic, 2012). With that
structure, the delivery of the analytes into the pores is
therefore mainly governed by the stationary flux
produced by electrostatic interactions, resulting in
slow responses and so long sensing times.
The choice of a porous membrane based biosensor
in the FP7 Positive project was based on the
constraints of its application that required the
detection of 16 different proteins found in
concentrations of 0.24ng/ml upwards in serum
sample volumes of 100µl samples within 15 minutes
of their introduction into the instrument. In order to
meet all of the application criteria, freestanding
macroporous AAO membranes with 200 nm pore
diameters were used, to allow analyte molecules to
flow-through the pores less than a diffusion length
from the assay surface on the pore walls, breaking the
NanophotonicBiosensorsWithinLabonChipOpticalSystems
63
mass transport limitations (Yanik, 2010) (Guo, 2011),
and so effectively targeting their delivery, for real-
time biosensing responses.
With the pores of macroporous AAO membranes
perpendicular to their planar surface, any induced
birefringence is very sensitive to the refractive index
of the material within the pores (Alvarez, 2011)
(Alvarez, 2012), and this was used as a sensing
mechanism (Alvarez, Sola et al., 2013) in an optical
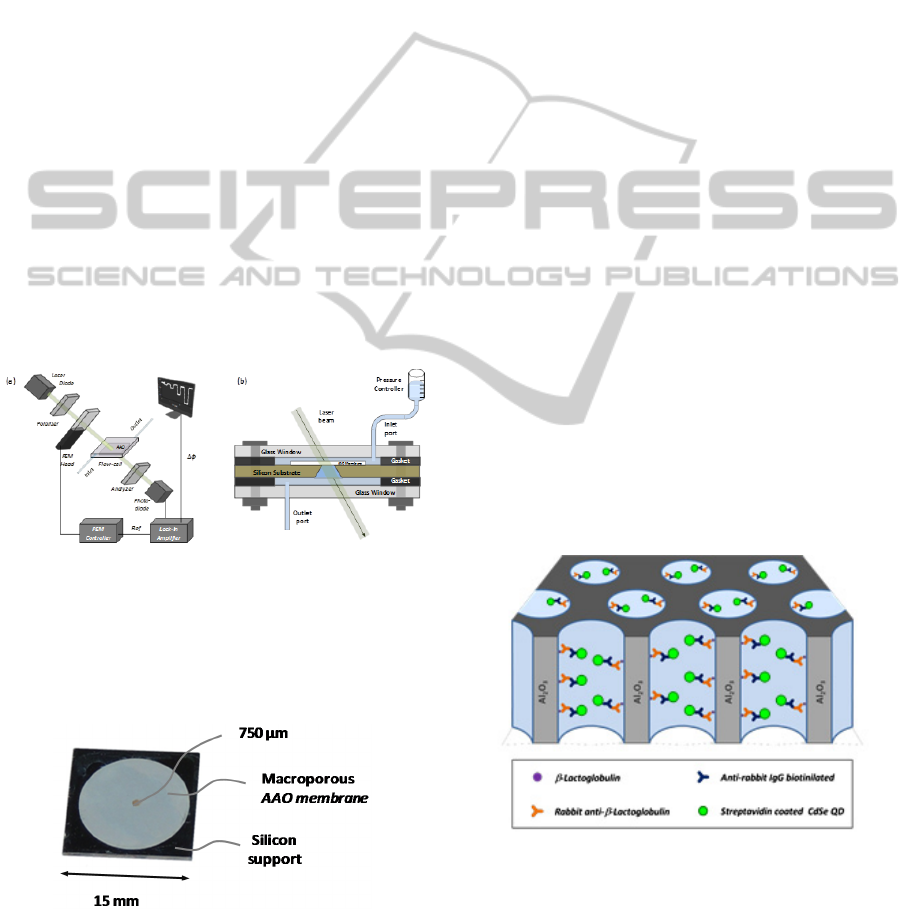
polarimetry based experiment (Figure 3).
In the experiment, the AAO pore walls within the
membrane were functionalized with an epoxysilane
before being spotted with -Lactoglobulin protein
and the binding first of rabbit anti--lactoglobulin and
then a secondary antibody anti-rabbit
Immunoglobulin G was monitored in real-time. The
membrane itself is affixed with a 1 μm thick layer of
PMMA (Poly(methyl methacrylate)) resist to a 500
μm thick 15 by 15 mm piece of single side polished
silicon wafer support, with a 750 μm diameter
opening (Figure 4). Prior to the biosensing
experiment, a bulk refractive index sensitivity of
5.2x10
-6
refractive index units was measured from
signal responses to different concentrations of NaCl
solutions for the mounted membranes within a flow
cell.
Figure 3: (a) Layout of the optical polarimetric readout
platform used for measuring the phase retardation within
the membranes from phase locked loop measurements
using a 980nm laser diode. (b) Scheme of fluidic setup
integrated within a flow-cell where the mounted membrane
is placed and whose inlet port is connected to a pressure
controller providing a constant pressure flow.
Figure 4: Picture of a freestanding membrane mounted on a
silicon support.
4.2 Positive Measurements and
Discussion
Recently this approach was repeated for
immunosensing (Alvarez 2014), by coating the
membrane with a functional copolymer,
copoly(DMA-NAS), through a novel procedure that
has demonstrated less non-specific binding, and
therefore greater selectivity, and more stability over
time for immobilized allergens than epoxysilane
(Platt, 2014). Specifically this polymer was
previously demonstrated to immobilize allergens on
different materials, such as glass, nitrocellulose,
silicon (Cretich, 2010) and more recently on a
SiOxNy DPI chip (Platt, 2014), whilst allowing an
efficient measurement of their interactions with
allergen-specific Immunoglobulin E (IgEs) in
complex matrices of serum, proving its suitability as
a non-fouling coating and that it is robust to allergen
storage.
Prior to the immunosensing experiments in order
to obtain both the bulk sensitivity, and its
reproducibility a series of bulk refractive index
experiments with the polarimetry setup were carried
out (Sola, 2015), on ten different copolymer
functionalized macroporous alumina membranes,
with an allergen immobilized on the pore surfaces
(Figure 5), on silicon supports and mounted within a
flowcell. Briefly, after purging with CO
2
, PBS-T
(PBS, 0.02% (v/v) Tween 20) was flown through the
membranes for fifteen minutes in order to obtain a
base line, before flowing four solutions of NaCl in
PBS with concentrations ranging from 0.2% (m/v) to
2% (Figure 6).
Figure 5: The immunoassay carried out in a macroporous
alumina membrane. β-lactoglobulin protein was used as the
immobilized antigen for the detection of rabbit anti-β-
lactoglobulin. Biotinylated secondary antibody (anti-rabbit-
IgG) and streptavidin coated CdSe quantum dots were used
to increase the signal produced by the primary antibody.
PHOTOPTICS2015-InternationalConferenceonPhotonics,OpticsandLaserTechnology
64
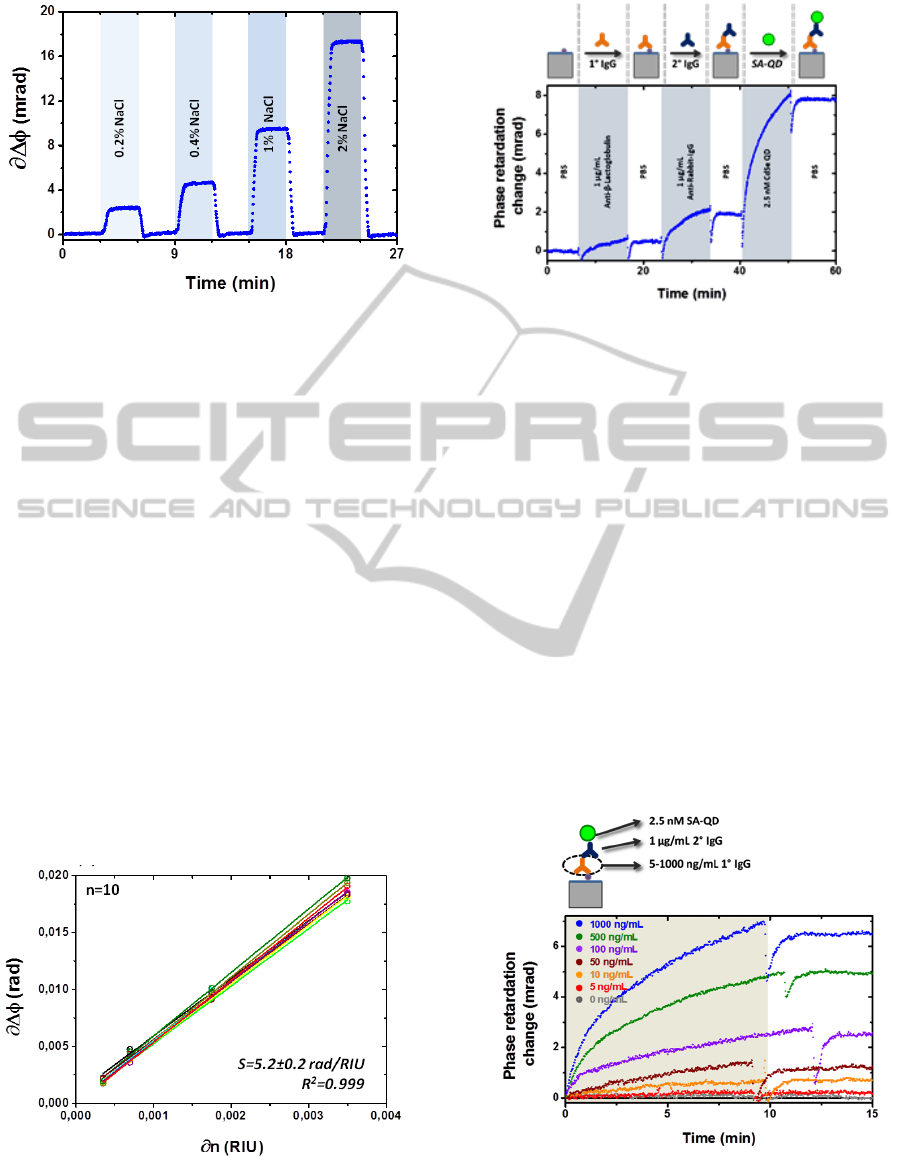
Figure 6: A sensorgram showing the signal response from
flowing several solutions of various concentrations of NaCl
in deionized water through a macroporous AAO membrane.
Measured polarimetric responses for all
membranes when fitted with a linear curve gave a
mean sensitivity of 5.2 radians RIU
-1
(rad RIU
-1
) with
a standard deviation equal to 0.2 rad RIU
-1
(Figure 7)
which is ~4% of the average sensitivity value (which
envisions a good reproducibility for these
membranes, a necessity for a commercial device).
This corresponds to a LoD of 5x10
-6
RIU from a
measurement system resolution of 2.7x10
-5
rad
(Alvarez, Serrano et al., 2013). Thereafter, each
immunosensing experiment began by first
introducing a running buffer of PBS-T for 15 minutes.
In a first experiment the activity of the immobilized
allergens were tested (Figure 8) using concentrations
of 1 μg/mL (6.7 nM) for the first and secondary
antibody and a concentration of 2.5 nM for
streptavidin coated CdSe quantum dots (SA-QD).
Firstly, the baseline obtained during the buffer rinse
showed good stability, demonstrating that the antigen
is stably immobilized on the polymer coated surface.
Figure 7: Overlaid phase retardation changes for ten
different alumina membranes as a function of refractive
index changes from different NaCl solutions.
Figure 8: A sensorgram showing the signal response due to
the binding of the first and secondary antibodies, followed
by the SA-QD.
After recording a stable baseline during six
minutes the first antibody rabbit anti-β-lactoglobulin
was injected during 10 minutes, followed by a six
minute rinse with the running buffer before the
secondary antibody anti-rabbit IgG was injected
during 10 minutes. As the secondary antibody is
polyclonal, a larger response is observed for this,
compared to the binding of the initial primary
antibody. After further rinsing, the SA-QDs were
added as a signal enhancer at a concentration of 2.5
nM, which was sufficient to saturate the captured
secondary antibodies. Due to the size of the SA-QDs
an enhancement of 5 times is observed in the signal
over the response produced by the secondary
antibody. Each sandwich assay, employing both a
secondary and tertiary binding, took less than one
hour reducing assay time fivefold and analyte
Figure 9: An overlay of the signal responses produced by
the SA-QD when the concentration of the first antibody is
increased from 5 ng/mL to 1000 ng/mL.
NanophotonicBiosensorsWithinLabonChipOpticalSystems
65
consumption by three orders of magnitude compared
to biosensors based on porous membranes in flow-
over configurations (Tsang, 2012). From
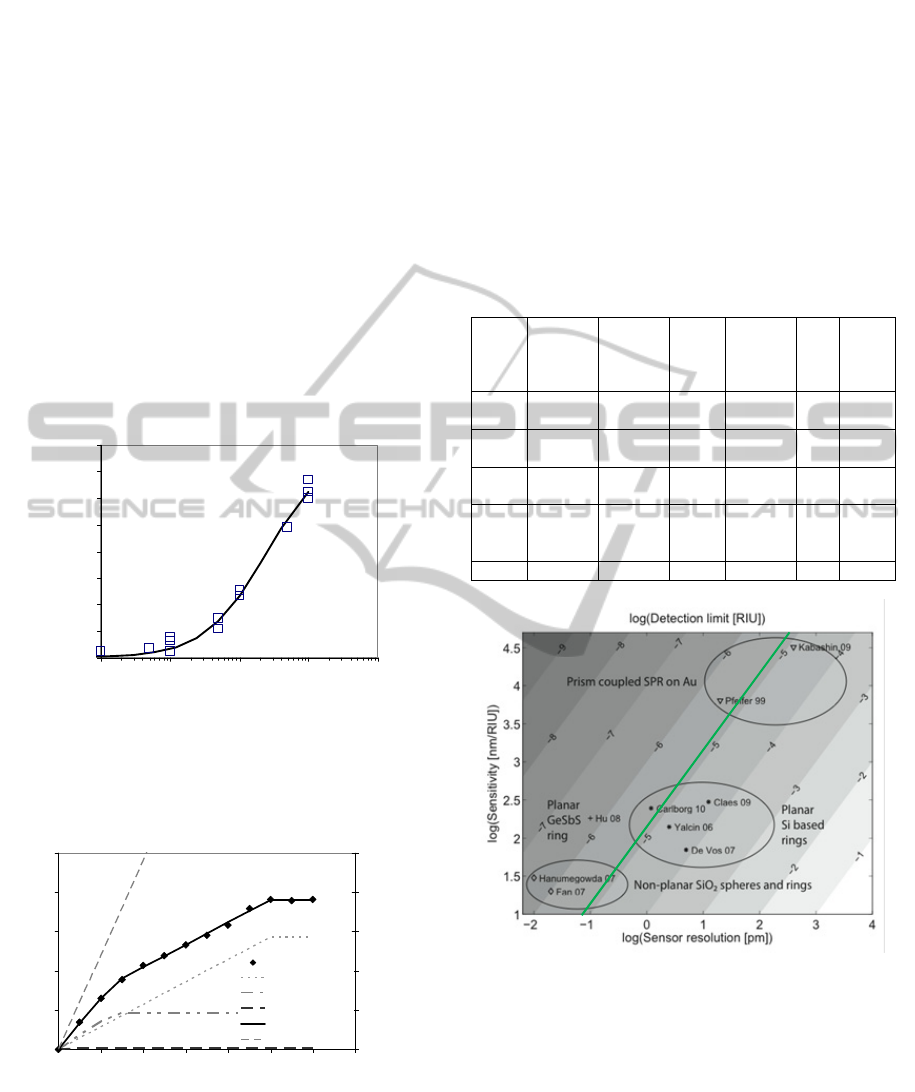
measurements (Figure 10) a LoD was calculated at
33.7ng/ml (225pM). The reductions in assay time,
sample and reagent volumes as well as response time
are clearly advantages that result from the use of a
flow through mechanism with analyte path lengths to
the sensor walls less than a diffusion length, and a
parameter related to these values is the capture
efficiency. This was determined (Sola, 2015) by the
use of a fluorescent flow-through capture assay using
Cy3 labelled streptavidin which, when combined with
modelling (Figure 11), was also used to provide pore
size distribution information for the AAO
membranes. Compared to a conventional planar
biosensors, they show much higher efficiency for
analyte capture from solution (17% vs 32%), which is
Figure 10: Phase retardation change upon injection of 2.5
nM SA-QD over biosensing experiments using a range of
primary AB concentrations (5-1000ng/mL). The fitted line
corresponds to a 1:1 binding model of K
D
228 ng/mL and
R
max
of 7.7 mrad.
Figure 11: Amount of SA-Cy3 captured by biotinylated
AAO membrane as a function of eluted sample volume.
Lines show the fit to a mass transport to the membrane
model with three pore sizes, assuming a fixed small pore
size of 200nm at fitted 82.9% number density, 314nm at
17% and 1.4 m at 0.1%
ultimately limited by the demonstration of a
distribution of pore sizes rather than the declared
nominal pore diameter. The combination of porous
membranes and SA-QD detection also raises the
potential for other transduction mechanisms to be
explored in these devices, such as fluorescence,
colorimetric or back-pressure measurement.
5 DISCUSSION
Table 1: A comparison of the three principle sensors from
the three EC projects along with the state of art.
Senso
r
V
olumetri
c
L
oD (RIU)
P
rotein
m
ass LoD
(pg/mm
2
)
P
rotein
concen -
t
ration
L
oD
R
esponse
t
ime
T
ime
t
o
r
esult
(
mins)
Sample
v
olume
(ml)
SiN slo
t
R
R
510
–6
1
125
ng/ml
>300 >>60 5
SOI slo
t
R
R
4x10
−5
5
10
ng/ml
>300 >>60 5
V
ernier
R
R
5x10
–6
NA NA >300 >>60 5
A
AO
M
em -
b
rane
5x10
-6
?
34
ng/ml or
225pM
<1 <60 0.1
SOA 8×10
−7
? 60fM <1 8 Small?
Figure 12: An analysis of the LoD from the principal sensor
technologies within the three EC projects compared to
others in the literature. The x-axis is the log of the
wavelength resolution and the y-axis is the log of the device
sensitivity in terms of wavelength shift per RIU. The
grayscale then represents LoD 0. The SABIO sensor is
labelled as Carlborg whilst the initial InTopsens sensor is
labelled as Claes. A green continuous line on the graph
represents the LoD of the Positive sensor. As the sensor
uses a phase based measurement instead of wavelength,
neither its sensitivity nor resolution can be plotted for a
specific point.
0
1
2
3
4
5
6
7
8
1 10 100 1000 10000
Anti b-Lactoglobulin concentration (ng/mL)
Phase Retardation Change (mrad)
0
0.5
1
1.5
2
2.5
02468101214
Sample Volume (mL)
Moles of Protein Captured (nmol)
0
0.5
1
1.5
2
2.5
Total Moles of Protein Flowed
(nmol)
Total SACy3 Bound
Small Pore
Medium Pore
Large Pore
total bound fit
Total Flowed
PHOTOPTICS2015-InternationalConferenceonPhotonics,OpticsandLaserTechnology
66

When comparing the results from the principle sensor
mechanisms used within the three EC projects one
can see (Figure 12) their volumetric limits of
detection are similar but still an order of magnitude
below that of the state of art (SOA) for nanophotonic
sensors (Iqbal, 2010).
Comparisons for protein mass or concentration
LODs are difficult to make as they depend on the
surface chemistry and exact protein used but all of
three sensors are similar and inferior to the SOA. The
POSITIVE sensor does however compare favourably
with the SOA in terms of response time, size of
sample and possibly time to result although the latter
two are assay dependent making them difficult to
compare especially given the lack of quantitative
information for sample volumes used for the SOA
results. It also probably has a far higher efficiency for
analyte capture and if other transduction mechanisms
were used simultaneously, it could have a far superior
specificity, a very important parameter for many
applications that rarely appears in academic
publications.
6 CONCLUSIONS
In comparing various optical biosensors developed
within three EC funded projects we have observed
that firstly, they all have similar volumetric limits of
detection, on the order of 10
−6
RIU whereas limits of
detection for proteomic assays vary and are difficult
to compare with the data coming from different
assays. It is noteworthy however that for the
POSITIVE sensor total assay times were far less as
were response times and minimum volumes of
analyte necessary making it comparable at least in
those regards to the state of art or nanophotonic
sensors and interesting for certain applications.
Research in non-planar sensors, although
currently facing more fabrication technology
challenges than the planar types, can be expected to
provide some very interesting results in the near
future.
ACKNOWLEDGMENTS
As project manager of all three projects there are
many contributors with whom I have worked directly
and am most grateful for their efforts. I thank Jesus
Alvarez, Hans Sohlström and Kristinn Gylfason for
their photonics contributions in both SABIO and
POSITIVE. Other direct contributors to the SABIO
work summarized here are Andrzej Kaźmierczak,
Fabien Dortou, Laurent Vivien, Jon Popplewell,
Gerry Ronan and Carlos A. Barrios. Other direct
contributors to the INTOPSENS work summarized
here include Tom Claes and Peter Bienstman. Further
direct contributors from the POSITIVE project for
article include Marcus J Swann, Laura Sola, Marina
Cretich, Marcella Chiari and Tormod Volden. As I
review the collaborative projects SABIO,
INTOPSENS and POSITIVE, many others have
contributed.
REFERENCES
X. Fan, I. M. White, S. I. Shopova, H. Zhu, J. D. Suter, and
Y. Sun. (2008). Sensitive optical biosensors for
unlabeled targets: A review, Anal. Chim. Acta, 620,
(1/2), p8–p26.
D. Hill. (2011). Advances in nanophotonic sensing
technologies during three international label-free lab-
on-chip projects, BioNanoScience, 1, p162–p172.
D. Janasek, J. Franzke, and A. Manz. (2006). Scaling and
the design of miniaturized chemical-analysis systems,
Nature 442, p374–p380.
F. S. Ligler, (2009). Perspective on optical biosensors and
integrated sensor systems, Anal. Chem., 81, (2), p519–
p526.
A. Brecht and G. Gauplitz. (1995). Biosensors and
Biolectronics, 10, p923-p936.
D. Markov, D. Begari and D. J. Bornhop. (2002). Breaking
the 10
−7
Barrier for RI Measurements in Nanoliter
Volumes, Anal. Chem., 74, p5438–p5441.
K. Zinoviev, L. G. Carrascosa, J. Sánchez del Río, B.
Sepúlveda, C. Domínguez, and L. M. Lechuga. (2008).
Silicon photonic biosensors for lab-on-a-chip
applications, Advances in Optical Technologies,
p383927.1-p383927.6.
J. A. De Feijter, J. Benjamins and F. A. Veer. (1978).
Ellipsometry as a tool to study the adsorption behavior
of synthetic and biopolymers at the air-water interface,
Biopolymers 17, (7), p1759–p1772.
K. Tiefenthaler, and W. Lukosz. Integrated optical switches
and gas sensors, (1984). Opt. Lett. 9, p137–p139.
W. Lukosz, and K. Tiefenthaler. (1988). Sensitivity of
integrated optical grating and prism couplers as
(bio)chemical sensors, Sensors and Actuators 15, (3),
p273–p284..
K. Tiefenthaler, and W. Lukosz. (1989). Sensitivity of
grating couplers as integrated optical chemical
sensors, J. OSA B: Opt. Phys. 6, (2), p209–p220.
V. R. Almeida, Q. Xu, C. A. Barrios, and M. Lipson.
(2004). Guiding and confining light in void
nanostructure, Opt. Lett. 29, (11), p1209–p1211.
Q. Xu, V. R. Almeida, R. R. Panepucci, and M. Lipson.
(2004). Experimental demonstration of guiding and
confining light in nanometer-size low-refractive-index
material, Opt. Lett., 29 (14), p1626–p1628.
NanophotonicBiosensorsWithinLabonChipOpticalSystems
67

H. Sohlström, K.Gylfason, D. Hill. (2010). Real-time label-
free biosensing with integrated planar waveguide ring-
resonators, Proc. SPIE 7719, 77190B.
Gylfason, K. G., Carlborg, C. F., Kazmierczak, A., Dortu,
F., Sohlström, H., Vivien, L., Barrios, C. A., van der
Wijngaart, W., and Stemme, G., “On-chip temperature
compensation in an integrated slot-waveguide ring
resonator refractive index sensor array”, Opt. Expr.
18(4), 3226–3237 (2010).
C. F. Carlborg, K. B. Gylfason, A. Kamierczak, F. Dortu,
M. J. Bañuls Polo, A. Maquieira Catala, G. M.
Kresbach, H. Sohlström, T. Moh, L. Vivien, J.
Popplewell, G. Ronan, C. A. Barrios, G. Stemme, and
W. van der Wijngaart. (2010). A packaged optical slot-
waveguide ring resonator sensor array for multiplex
label-free assays in labs-on-chips. Lab Chip. 10, p281–
p290.
A. Kazmierczak, F. Dortu, O. Schrevens, D. Giannone, L.
Vivien, D. M. Morini, D. Bouville, E. Cassan, K. g.
Gylfason, H. Sohlström, B. Sanchez, A. Griol, and D.
Hill. (2009) Light coupling and distribution for
Si3N4/SiO2 integrated multichannel single-mode
sensing system. Opt. Eng. 48, (1), 014401.
K. De Vos, I. Bartolozzi, E. Schacht, P. Bienstman, and R.
Baets. (2007). Silicon-on-insulator microring
resonator for sensitive and label-free biosensing. Opt.
Expr. 15, (12), p7610–p7615.
T. Claes, J. G. Molera, K. De Vos, E. Schacht, R. Baets. and
P. Bienstman. (2009) Label-free biosensing with a
slot-waveguide-based ring resonator in silicon on
insulator. J. IEEE Photonics 1, (3), p197–p204.
T. Claes, W. Bogaerts, and P. Bienstman. (2010).
Experimental characterization of a silicon photonic
biosensor consisting of two cascaded ring resonators
based on the Vernier-effect and introduction of a curve
fitting method for an improved detection limit. Optics
Express, 18, (22), p22747.
T. D. Lazzara, I. Mey, C. Steinem, A. Janshoff. (2011).
Benefits and limitations of porous substrates as
biosensors for protein adsorption, Anal. Chem., 83,
(14), p5624-p5630.
M. M. Orosco, C. Pacholski, M.J. Sailor. (2009). Real-time
monitoring of enzyme activity in a mesoporous silicon
double layer. Nature Nanotechnology, 4, p255.
C. K. Tsang, T. L. Kelly, M. J. Sailor, Y. Y. Li, (2012).
Highly Stable Porous Silicon–Carbon Composites as
Label-Free Optical Biosensors. ACS Nano, 6, p10546.
S.D. Alvarez, C. P. Li, C. E. Chiang, I. K. Schuller, M. J.
Sailor. (2009). A Label-Free Porous Alumina
Interferometric Immunosensor. ACS Nano, 3, p3301.
T. Kumeria, M. D. Kurkuri, K. R. Diener, L. Parkinson, D.
Losic, (2012). Label-free reflectometric interference
microchip biosensor based on nanoporous alumina for
detection of circulating tumour cells. Biosensors and
Bioelectronics, 35, (1), 167.
T. Kumeria, D. Losic, (2012). Controlling interferometric
properties of nanoporous anodic aluminium oxide”
Nanoscale Research Letters, 7, (88), p1.
A. A. Yanik, M. Huang, A. Artar, T. Y. Chang, H. Altug.
(2010). Integrated nanoplasmonic-nanofluidic
biosensors with targeted delivery of analytes. Applied
Physics Letters, 96, (2), p021101.
Y. Guo, H. Li, K. Reddy, H.S. Shelar, V.R. Nittoor, X. Fan.
(2011). Optofluidic Fabry-Perot cavity biosensor with
integrated flow-through micro-/nanochannels. Applied
Physics Letters, 98, (4), p041104.
J. Álvarez, P. Bettotti, I. Suárez, N. Kumar, D. Hill, V.
Chirvony, L. Pavesi, J. Martínez-Pastor. (2011).
Birefringent porous silicon membranes for optical
sensing. Opt. Express, 19, (27), p26106.
J. Álvarez, P. Bettotti, N. Kumar, I. Suarez, D. Hill, J
Martínez-Pastor. (2012). Highly-sensitive anisotropic
porous silicon based optical sensors. Proc. SPIE,
8212, (1), p821209.
J. Álvarez, L. Sola, G. Platt, M. Cretich, M. Swann, M.
Chiari, D. Hill, and J. Martínez-Pastor. (2013). Real-
time polarimetric biosensing using macroporous
alumina membranes. Proc. SPIE 8765, Bio-MEMS
and Medical Microdevices, p87650I.
J. Álvarez, L. Sola, M. Cretich, M. J. Swann, K. B.
Gylfason T. Volden, M. Chiari, D. Hill. (2014). Real
time optical immunosensing with flow through porous
alumina membranes. Journal of Sensors and Actuators
B, 202, p834-p839.
G. W. Platt, F. Damin, M. J. Swann, I. Metton, G. Skorski,
M. Cretich, M. Chiari. (2014). Allergen
immobilisation and signal amplification by quantum
dots for use in a biosensor assay of IgE in serum.
Biosensors and Bioelectronics, 52, p82–p88.
M. Cretich, D. Breda, F. Damin, M. Borghi, L Sola, S.M.
Unlu, & M. Chiari. (2010). Allergen microarrays on
high sensitivity silicon slides. Analytical and
bioanalytical chemistry, 398, (4), p1723-p1733.
L. Sola, J. Álvarez, M. Cretich, M. J. Swann, T. Volden, M.
Chiari, D. Hill. (2015). Characterisation of porous
alumina membranes for efficient, real-time, flow
through biosensing. J. Membrane Science, 276, p128–
p135.
J. Álvarez, C. Serrano, D. Hill, and J. Martínez-Pastor.
(2013). Real-time polarimetric optical sensor using
macroporous alumina membranes. Opt. Lett. 38, (7),
p1058-p1060.
M. Iqbal, M. A. Gleeson, B. Spaugh, F. Tybor, W. G. Gunn,
M. Hochberg, T. Baehr-Jones, R. C. Bailey, and L. C.
Gunn. (2010). Label-Free Biosensor Arrays Based on
Silicon Ring Resonators and High-Speed Optical
Scanning Instrumentation. IEEE Journal of Selected
Topics In Quantum Electronics, 16, (3).
K. B. Gylfason, (2010). Integrated Optical Slot-Waveguide
Ring Resonator Sensor Arrays for Lab-on-Chip
Applications. PhD Thesis TRITA-EE 2010:012, KTH-
Royal institute of Technology, Stockholm.
PHOTOPTICS2015-InternationalConferenceonPhotonics,OpticsandLaserTechnology
68
