
A Quick Method to Determine the Impurity Content in Gold
Ornaments by LIBS Technique
A. F. M. Y. Haider, S. Sengupta and K. M. Abedin
Physics Department and Laser Spectroscopy Laboratory, CARS, University of Dhaka, Dhaka, Bangladesh
Keywords: Libs, ED-XRF, Carat Values, Impurities.
Abstract: Laser induced breakdown spectroscopy (LIBS) and low energy dispersive X-ray fluorescence (ED-XRF)
spectrometer, were used to determine the line intensity and concentration ratios of the major impurities (Cu
and Ag) with respect to Au in gold ornaments with different caratage. Calibration curves were drawn with
the data sets, obtained from LIBS and XRF, and from these calibration curves the unknown caratage of gold
ornaments were obtained by using the line intensity of elements determined by LIBS. We have
demonstrated the accuracy of this method by comparing the result with the carat value obtained by typical
XRF method. This is yet another novel application of LIBS as a versatile analytic technique.
1 INTRODUCTION
Fast, reliable and accurate determination of the
elemental composition of gold alloys along with its
carat value has become an important task not only
for its use in worldwide jewelry manufacturing but
also in fields like nano-medicine (Ali et al., 2011)
and microelectronic industries (Goodman, 2002).
Traditional cupellation method or ‘Fire Assay’
(Bugbee, 1950) is one of the most trusted procedures
till date for measuring the caratage of gold and
hallmarking them. However, cupellation method is
destructive, time consuming, operator dependent and
involves the usage of lead and nitric acid which also
produces toxic fume at high temperature. Because of
these complications, X-ray fluorescence
spectrometry (Beckhoff et al., 2006) (wavelength
dispersive, WD-XRF and energy dispersive, ED-
XRF) has been adopted as a convenient and reliable
technique in gold market for testing gold purity as
they offer fast and sample preparation free (unlike
atomic absorption spectroscopy) nondestructive
analysis. In practice, high energy dispersive XRF
can provide fairly accurate result although it is quite
expensive and requires expert analysts; so they are
not commercially feasible for detecting caratage of
gold ornaments. But there exists low energy
dispersive XRF spectrometer specifically designed
and pre-calibrated by international standards for
simultaneous analysis of alloy constituents. Low
energy dispersive XRF offers accuracy of 2-5
0
/
0
.
However, its accuracy deteriorates if the sample is
small, curved or ball-shaped. Furthermore, with
XRF only about 1-2 μm of surface depth can be
examined. So XRF technique is less precise in
detecting forgery like a copper or silver bar
electroplated with a thick layer of pure gold. The
topic of gold jewelry analysis by XRF has been
reviewed by Marucco (Marucco, 2006). Also
Gamma ray transmission technique, proposed in
(Suzuki et al. 2006) provides analysis of gold
samples which are about 1-5 mm thick with 99%
accuracy. But because of radiation hazard due to
strong gamma ray and lack of portability, this
method is also not commercially feasible in
analyzing gold purity. Laser Induced Breakdown
Spectroscopy (LIBS) (for details, see (Miziolek et al,
2006, Singh et al. 2007), on the other hand has no
extra trouble of special sample preparation and
hence posses simplicity along with detection limit of
few ppm and unlike XRF, has larger information
depth of 10 μm or more depending on laser pulse
power which makes it an ideal choice for testing
gold purity within a very short period of time. Using
LIBS, all the elements in the periodic table can be
measured in a single setup of the spectrometer.
Despite all these advantages, LIBS has never
been adopted as an ideal method for impurity
detection in gold. Typically, the signal intensity for
an element present in the plasma depends on laser
parameters: laser energy, irradiance, laser focusing
and pulse duration. Fluctuations in any of these
41
Haider A., Sengupta S. and Abedin K..
A Quick Method to Determine the Impurity Content in Gold Ornaments by LIBS Technique.
DOI: 10.5220/0005249300410046
In Proceedings of the 3rd International Conference on Photonics, Optics and Laser Technology (PHOTOPTICS-2015), pages 41-46
ISBN: 978-989-758-092-5
Copyright
c
2015 SCITEPRESS (Science and Technology Publications, Lda.)

parameters and also sample inhomogeneity and
matrix effects may lead to nonlinearity in the
calibration curves, affecting the analytical precision
and consequently lowering the accuracy of
measurement by LIBS technique.
In general, sample inhomogeneity can be
categorized into two classes: bulk non-uniformity
and non-representative surface composition. The
first can be dealt with by averaging results of
multiple measurements taken over different parts of
the sample. Samples whose outer layers don’t
represent bulk composition can be probed by making
crater with depth ranging from few µm to 10-20 µm
depending on the laser parameters. This will usually
solve the problem of non representative surface
composition. Low ED-XRF, as mentioned before,
can’t probe such depth.
Matrix effect corresponds to the change in the
signal intensity of a specific element with variation
in the concentration of one or more elements
forming the matrix even though the overall
elemental concentration remains constant in the
sample. One approach to correct such effects is to
use internal standard principle i.e. to consider the
ratio of the intensity of analytical spectral line to that
of another component of the sample which has fixed
or known concentration because even if the
measured values change significantly, their ratio
alter a little (Haider et al. 2014). As LIBS offers
immense possibilities for spectroscopic analysis,
significant efforts are given to develop new
calibration methods (for a review, see (Zorov et al.
2010)) to correct LIBS measurements and increase
its ability of quantitative analyses.
Although LIBS is a standalone analytical
method, over the years, it has been combined with
other analytical methods to enhance performance for
selected applications. One such example is LIBS-
LIF (Laser Induced Fluorescence) where free atoms
in the plasma formed by LIBS laser are excited with
second laser beam tuned at specific frequency to
induce some transition in atoms and this method,
though not have multi-elemental detection
capability, has higher sensitivity to detect single
specific element in the sample. This has been
reflected in spectro-chemical analysis of metals in
soil (Hilbk-Kortenbruck et al., 2001).
In this paper, we report a method for determining
the carat values of gold in general, and in particular
of gold ornaments, by combining LIBS with low
energy dispersive XRF. This technique was also
adopted by Pouzar et al., 2011, for quantitative LIBS
analysis of vanadium in samples of hexagonal
mesoporous silica catalysts. One can thus bypass
the limitations, which both the systems suffer
individually, and enhance the detection ability of
impurity content in gold ornaments using calibration
curves obtained by correlating LIBS and XRF data.
It has been shown that improved accuracy of
determination of caratage of gold ornaments of any
size and shape are possible by using these
calibration curves and comparatively more reliable
results can be obtained from the LIBS technique.
2 EXPERIMENTAL
Suisse gold bar (24 carat) obtained from Singapore
Bullion market and gold ornaments: 3 finger rings
with known carat values, as determined by ED-XRF
technique, of 22.024K, 20.912K and 18.507K, a
round solid earring (20.495K), a round flat pendant
(18.807K), a curved ear-top (18.649K) and a stone
studded ring (8.040K) were used as samples. The
thickness of the targets was different for different
samples depending upon the type of ornaments.
Later an ornament of unknown carat value was used
for verification of the proposed method. It was
evident from XRF analysis that goldsmiths mostly
use copper and silver, as impurity to gold alloys for
obtaining desired color, shine and solidity of the
ornaments. The percentage content of impurity
elements (Cu and Ag) in the samples were
ascertained by low energy dispersive XRF. Other
elements which were present in trace amount were
Ni, Cd and Zn. That’s why in our work we have
mainly focused on establishing two separate
calibration curves; one for copper and another for
silver as the inclusion of other base metals were
negligible. These calibration curves were used to
estimate the impurity content of the gold ornament
of unknown caratage to verify the applicability of
this technique. The concentrations of constituent
elements in the gold samples were obtained by
desktop energy dispersive XRF spectrometer (EDX
3600B) which is equipped with Tungsten anode X-
ray tube operated at 40 KeV and 80 µA and electro-
cooling UHRD detector which leads to good energy
linearity, energy resolution, spectral property and
high peak-background ratio
(http://www.skyrayxrf.com/ edx3600b). The LIBS
spectrometer used in the present work is shown
figure 1 (Haider et al., 2014). It has a pulsed Q-
switched Nd:YAG laser operating at 1064 nm with
pulse duration of 8ns and repetition rate of 10 Hz.
But we have used harmonic generator that has a
nonlinear Potassium Dihydrophosphate (KDP)
crystal to obtain the 2
nd
harmonic at 532 nm with
PHOTOPTICS2015-InternationalConferenceonPhotonics,OpticsandLaserTechnology
42
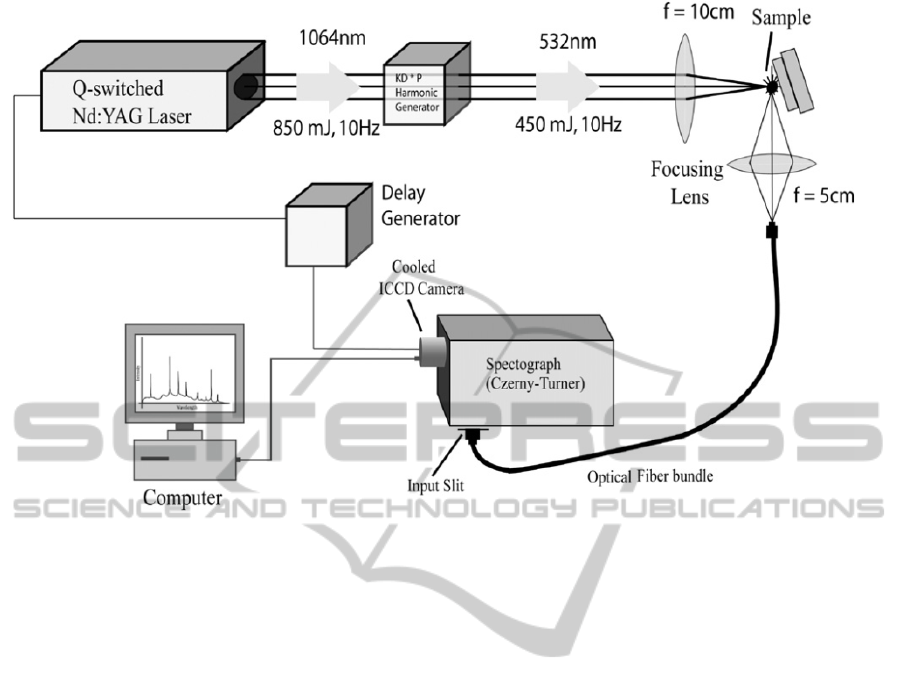
Figure 1 A Schematic diagram of LIBS set-up.
ablation energy varying from 40 mJ to 150 mJ for
our analysis. The spectrometer, SpectraPro 2758
(http://www.princetoninstruments.com/products/
spec/actonseries), used is a Czerny Turner
spectrograph with focal length of 750 mm and a
triple grating turret. With the focusing geometry
used in the experiment [see figure 1] the beam waist
at the focus of the lens is 10 micro-meters. The
spectrograph is equipped with three ruled gratings in
the turret, viz., 300 grooves/ mm blazed at 300 nm ,
600 grooves/mm blazed at 500 nm, and 2400
grooves/mm blazed at 240 nm, which are
interchangeable under computer control. The
selection of the gratings determines the resolution of
the instrument. If the 600 grooves/mm grating is
used, as was the case in the present experiment, a
spectrum of about 38 nm of spectral width can be
captured without moving the grating. The output end
of the spectrograph is coupled with an intensified
and gated CCD camera (Princeton PI-MAX with
Unigen II coating and programmable delay
generator). The ICCD camera has 1024 x 1024
pixels and was cooled to –20
0
C by a Peltier cooler
to reduce noise (http://www.princeton
instruments.com/products/imcam/pixis). The camera
was electrically triggered by the Nd: YAG Q-switch
pulses after a software-controlled, adjustable time
delay. With a suitable time delay, the intense
background initially created by the high-temperature
plasma can be largely eliminated, and the atomic
emission lines of theelements were more clearly
observed. In most of our experiments, a time delay
of about 1.0 micro-second was selected. Usually,
spectra from a number of laser shots (about 40-80)
were acquired and averaged to increase the signal-
to-noise ratio. The ICCD was interfaced with the
spectrometer and data acquisitionand spectral
analysis were carried out by theintegrated software
WinSpec/32, provided by the manufacturer.
The LIBS spectrum, taken in ambient air, was
analyzed by using the 600 grooves/mm grating. The
resolution of the spectrometer for the 600
grooves/mm grating is about 0.02 nm (Haider et al.,
2014) and the repeatability and accuracy of the
computer-controlled system is ±0.05 nm and ±0.1
nm respectively (manufacturer supplied data).
The plasma was checked for optical transparency
(optical thinness) following the method described in
one of our earlier paper (Haider et al., 2014).
3 RESULT AND DISCUSSION
The LIBS spectra of samples with different carat
values are shown in figure 2. The spectral lines were
identified using the online NIST (US National
Institute of Standards and Technology) Atomic
Spectra Database and the presence of Au and two
other alloying elements (Cu and Ag) was confirmed
AQuickMethodtoDeterminetheImpurityContentinGoldOrnamentsbyLIBSTechnique
43

310 320 330 340 350
0
5000
10000
15000
20000
25000
Ag I
Cu I
Au I
Au I
Au I
Au I
Au I
Au I
Au I
intensity
wavelength
(a)
310 320 330 340 350
0
5000
10000
15000
20000
25000
30000
Ag I
Au I
Ag I
Cu I
Cu I
Au I
Au I
intensity
wavelength
(b)
310 320 330 340 350
0
5000
10000
15000
20000
25000
30000
35000
Au I
Ag I
Ag I
Cu I
Cu I
Au I
Au I
intensity
wavelength
(c)
310 320 330 340 350
0
1000
2000
3000
4000
Ag I
Au I
Ag I
Cu I
Cu I
Au I
intensity
wavelength
(d)
310 320 330 340 350
0
20000
40000
60000
80000
100000
120000
140000
Au I
Cu I
Ag I
Cu I
Ag I
Cu I
Au I
intensity
wavelength
(e)
310 320 330 340 350
0
10000
20000
30000
40000
50000
60000
Au I
Ag I
Ag I
Cu I
Cu I
Au I
Au I
intensity
wavelength
(f)
310 320 330 340 350
0
20000
40000
60000
80000
100000
120000
Au I
Ag I
Ag I
Cu I
Cu I
Au I
intensity
wavelength
(h)
310 320 330 340 350
0
5000
10000
15000
20000
25000
30000
35000
Au I
Ag I
Ag I
Cu I
Cu I
Au I
Au I
intensity
wavelength
(g)
Figure 2: Typical LIBS spectra with identified lines for samples with different carat value (a) 99.99%, (b) 91.76%, (c)
87.13%, (d) 85.390%, (e) 78.36%, (f) 77.7%, (g) 77.10%, (h) 33.5%.
other alloying elements (Cu and Ag) was confirmed
in the samples. The intensity of the emission line
was measured by multiplying the peak intensity with
FWHM of the line. The line intensity ratio of
impurity to gold ( I
Cu
/ I
Au
and I
Ag
/ I
Au
) by LIBS and
the ratio of concentration of impurity to gold (Cu
/Au and Ag/ Au) as determined by XRF were
recorded for different samples.
The intensity ratios obtained from LIBS
measurement, as well as the ratios of concentration
of Cu and Ag, to Au, determined from XRF analysis
represent an estimate of how much impurities
(mainly Cu and Ag) are present in samples. The
LIBS spectral emission lines for Au, Cu and Ag
used in the intensity ratio calculations were at
312.278±0.15 nm, 324.754±0.15 nm
and338.207±0.15 nm respectively.
PHOTOPTICS2015-InternationalConferenceonPhotonics,OpticsandLaserTechnology
44
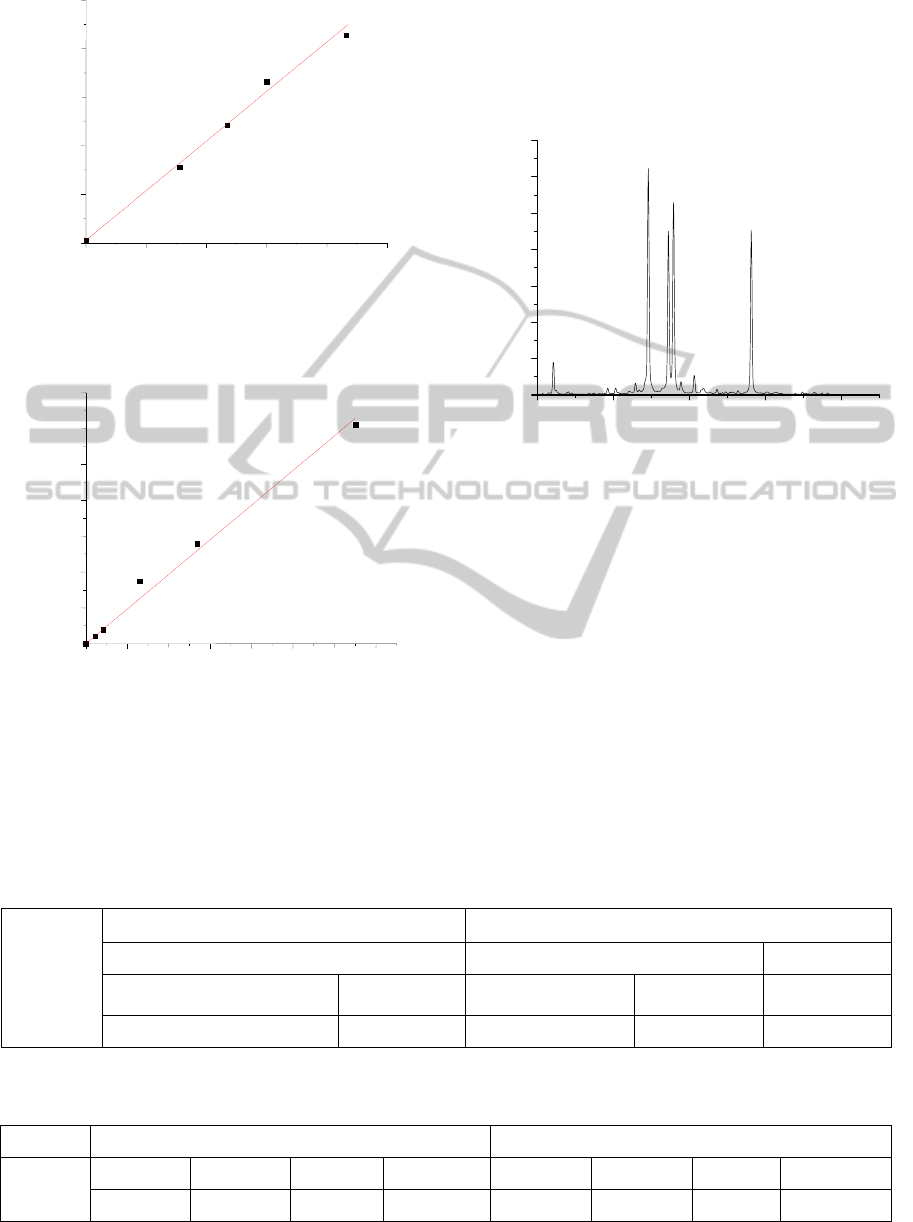
Figure 3: (a) Calibration curves for estimation of Cu
impurities in gold ornament.
Figure 3: (b) Calibration curves for estimation of Ag
impurities in gold ornament.
Therefore, by plotting the intensity ratio (from
LIBS) against the elemental concentration ratios
(from XRF), one can draw calibration curves for Cu
and Ag impurities as shown in Figures 3(a) and 3(b).
From these calibration curves, by knowing the line
intensity ratio by LIBS for an unknown sample, one
can immediately obtain the elemental concentration
ratio in that sample.
310 320 330 340 350
0
10000
20000
30000
40000
50000
60000
70000
Ag I
Ag I
Cu I
AU I
Cu I
Cu I
AU I
intensity
wavelength
Figure 4: LIBS spectrum for the sample of unknown
caratage.
For the verification of this method, LIBS spectra
(Fig 4) for an unknown sample was taken and from
the recorded spectra, line intensity ratios of impurity
(Cu and Ag) to gold i.e. I
Cu
/ I
Au
and
I
Ag
/ I
Au
were
determined. Then the elemental concentration ratios
of impurities to gold (Cu/Au and Ag/Au) were
measured for the corresponding line intensity ratios
from the calibration curves (Fig 3). Now, one can
easily calculate the % of impurity content in the
unknown sample using the Cu: Au: Ag ratio as
shown in Table 1. We have also analyzed the same
unknown sample by XRF technique. Table 2 shows
a comparison between the results obtained by XRF
method and the LIBS technique.
Table 1: Determination of ratio of impurity to gold from calibration curves (figures 3(a) and (b)) for gold sample of
unknown carat value.
Sample
By LIBS From calibration curve
Line intensity ratio of impurity to gold Ratio of impurity to gold
ICu/IAu IAg/IAu Cu/Au Ag/Au Cu:Au:Ag
17.702 12.190 0.173 0.065 17.3:100: 6.5
Table 2: Comparison of results obtained by XRF and that of LIBS technique in the present study for gold sample of
unknown carat value.
Sample By LIBS technique in the present study By XRF
Unknown
% of Au % of Cu % of Ag Carat value % of Au % of Cu % of Ag Carat value
80.78 13.97 5.25
19.39
78.610 14.829 6.252
18.87
0.00 0.05 0.10 0.15 0.20 0.25 0.30 0.35
0
10
20
30
40
50
60
70
(b)
I
Ag
/I
Au
0.00 0.05 0.10 0.15 0.20 0.25
0
5
10
15
20
25
(a)
I
Cu
/I
Au
A
g / Au
Cu/Au
AQuickMethodtoDeterminetheImpurityContentinGoldOrnamentsbyLIBSTechnique
45

4 CONCLUSIONS
We have shown that the LIBS technique can be used
as an effective and quick method for the
determination of carat value of gold ornaments. The
present method using LIBS enjoys a number of
advantages over other methods e.g. the XRF method
as discussed in the introduction. It only requires the
accumulation of the LIBS spectra in a single spectral
window (310nm to 348nm), if one uses the 600
grooves/mm grating and takes time of less than 1
second. One can also use the same LIBS set up for
detection of trace elements which aren’t detected by
XRF. The method of determining the caratage of
gold ornament by LIBS technique is particularly
preferable over the conventional ED-XRF technique
where forgery, by simple gold electroplating of
ornaments made of other metal, e.g. copper, silver or
bronze, is expected.
REFERENCES
Ali. J., Baizer. E., Jafarpur. M., Montazeri. M., Majdi. A.,
Aminifard. S., Zafari. M., Akberi. N. R. and Rad. H.,
2011. Nanotoxicity and Nanoparticle Safety in
Biomedical Designs. International Journal of
Nanomedicine, 6, 1117.
Beckhoff..B., Langhoff. N., Kanngiesser. B., Wedell.
R.and Wolff H. (eds.), 2006. Handbook of Practical
X-Ray Fluorescence Analysis, Springer.
Bugbee. E. E., 1950. A textbook of Fire Assaying, John
Weily and Sons.
For technical specifications: http://www.skyrayxrf.com/
edx3600.
Goodman. P.,2002. Current and Future Uses of Gold in
Electronics, Gold Bulletin, 35, 21.
Haider. A.F.M.Y., HedayetUllah. M., Khan. Z.H., Kabir
F. and Abedin. K.M., 2014. Detection of Trace
Amount of Arsenic in Groundwater by Laser-Induced
Breakdown Spectroscopy and Adsorption, Optics &
Laser Technology, 56, 299–303.
Haider. A. F. M. Y., Ira. M. K., Khan. Z. H. and Abedin.
K.M., 2014. Radiative lifetime measurement of excited
neutral nitrogen atom by Time Resolved Laser-
induced breakdown spectroscopy. J. Anal. At.
Spectrom., 29 (8), 1385-1392.
Hilbk-Kortenbruck. F. H., Noll. R., Wintjens. P., Falk. H
and Becker. C., 2001. Analysis of Heavy Metals in
Soils using Laser Induced Breakdown Spectroscopy
Combined with Laser Induced Fluorescence,
Spectrochimica Acta Part B, 56, 933.
http://www.princetoninstruments.com/products/
spec/actonseries.
http://www.princetoninstruments.com/products/imcam/pix
is.
Marucco. A., 2006. Low Energy ED-XRF Spectroscopy
Applications in Gold Assaying, Nuclear Instruments
and Methods in Physics Research B, 213, 486.
Miziolek. A. W., Palleschi. V. and Schechter. I., (eds.),
2006. Laser Induced Breakdown Spectroscopy:
Fundamentals and Applications, Cambridge
University Press.
Pouzar. M., Kratochvil. T., Capek. L., Smolakova. L.,
Cernohorsky. T., Krejcova. A.and Hromadko. L.,
2011. Quantitative LIBS Analysis of Vanadium in
Samples of Hexagonal Mesoporous Silica Catalysts,
Talanta, 83, 1659.
Singh. J. P. and Thakur S. N. (eds.), 2007. Laser Induced
Breakdown Spectroscopy, Elsevier Science.
Suzuki. T., Kitsutaka. R., Muto. T.and Morisaki. S., 2006.
Determination of the Purity of Gold Alloys Using
Gamma-Ray Transmission Techniques, Japan Journal
of Applied Physics, 37, 624.
Zorov. N. B., Gorbatenko. A. A., Labutin. T. A. and
Popov. A.M., 2010. A Review of Normalization
Techniques in Analytical Atomic Spectrometry with
Laser Sampling: From Single to Multivariate
Correction, Spectrochimica Acta Part B, 65, 642.
PHOTOPTICS2015-InternationalConferenceonPhotonics,OpticsandLaserTechnology
46
