
An Automated Medical Device for Ultimate ABO Compatibility Test
at the Patient’s Bedside
Towards the Automation of Point-of-care Transfusion Safety
Karine Charrière
1
, Alain Rouleau
2
, Olivier Gaiffe
2
, Pascal Morel
3
, Véronique Bourcier
4
,
Christian Pieralli
2
, Wilfrid Boireau
2
, Lionel Pazart
1
and Bruno Wacogne
1,2
1
INSERM CIC 1431, Besançon University Hospital, 25000 Besançon, France
2
FEMTO-ST Institute, UMR CNRS 6174, 15 B Avenue des Montboucons, 25030 Besançon cedex, France
3
Etablissement Français du Sang Bourgogne/Franche-Comté, 25000 Besançon, France
4
Hemovigilance Service, Besançon University Hospital, 25000 Besançon France
Keywords: Biosensor, Surface Plasmon Resonance, Human Red Blood Cells, Automated ABO Compatibility Test,
Optical Detection, Opto-Fluidic Prototype.
Abstract: In blood transfusion, accidents still occur because of ABO mismatch between donor and patient’s blood.
These errors, sometimes lethal, are principally due to wrong identification of patient and/or blood product or
to human errors. The best way to avoid these errors is to perform an ultimate ABO compatibility test at the
patient’s bedside immediately prior to transfusion. Ideally, this test should be performed automatically,
without human interpretation and with minimum blood exposure for nurses. This ideal and ultimate method
is not yet employed because of the lack of suitable device. In this paper, we propose a system that may fulfil
the above mentioned requirements. It is based on selective blood capture on biochip surfaces in a device
which automatically drives the different fluids, performs optical detection of captured red cells and finally
interprets the optical reading in terms of ABO compatibility. So far, our device achieved blood
compatibility test with 99.3 % sensitivity and 97.9 % specificity.
1 INTRODUCTION
In the field of blood transfusion, in all countries, a
concordance verification test is performed at the
patient’s bedside (concordance regarding the
patient’s identity and various elements that had
allowed the blood product delivery). In most
countries, a laboratory cross-match test is performed
before the concordance test. However, it becomes
useless when an error occurs after the delivery (the
wrong blood bag to the wrong patient, the most
frequent case). In very few countries (in France for
example), a second blood compatibility test is
performed at the patient’s bedside.
In countries where a unique test is performed at
the patient’s bedside and for which the hemo-
vigilance is reliable, the ratio of adverse effects due
to ABO incompatibility approaches 1/40000 red cell
concentrate (RCC). This was the case in France
before 2003 when only ABO compatibility was
tested. This is still the case in some countries where
only the concordance test is considered. After 2003
in France, the use of both concordance and ABO
tests at the patient’s bedside reduced the adverse
effects to about 1/600000 (in those very few cases,
concordance test had been omitted).
Based on these data, most countries are seeking a
second test at the patient's bedside in order to reduce
their number of ABO errors. However, the ABO test
cards used in France rely on delicate manual
operation and require a long and specific training.
Therefore, they appear difficult to be rapidly
employed worldwide. Furthermore, the
compatibility card still requires a human
interpretation of the agglutination test. Although iso-
group compatibility does not require difficult
interpretation of the agglutination test, non iso-group
compatibility is still subject to interpretation errors.
Indeed, the use of the current card is relatively
difficult and is the source of several errors as
illustrated later.
58
Charrière K., Rouleau A., Gaiffe O., Morel P., Bourcier V., Pieralli C., Boireau W., Pazart L. and Wacogne B..
An Automated Medical Device for Ultimate ABO Compatibility Test at the Patient’s Bedside - Towards the Automation of Point-of-care Transfusion Safety.
DOI: 10.5220/0005248700580067
In Proceedings of the International Conference on Biomedical Electronics and Devices (BIODEVICES-2015), pages 58-67
ISBN: 978-989-758-071-0
Copyright
c
2015 SCITEPRESS (Science and Technology Publications, Lda.)

All these facts highlight the need for a point-of-
care device able to automatically perform an
ultimate compatibility test with minimum
manipulation and without human interpretation. This
becomes urgent when considering the increase of
blood product distributed during the last decade. For
example in France an increase of the RCC delivery
of almost 24% has been observed between 2000 and
2011 (EFS, 2012). In 2011, more than 2.3 millions
of RCC where distributed (ANSM, 2012).
Several methods have been proposed for blood
typing. They are mainly based on gel agglutination
(Cid, 2006 – Langston, 1999). SPR (Malomgre,
2009 – Quinn, 2000 – Quinn, 1997) and Surface
Plasmon Resonance imaging (SPRi) (Berthier, 2011
– Boozer, 2006 – Campbell, 2007 – Mansuy-
Schlick, 2006) techniques can also be used.
However, these studies demonstrate the possibility
to detect captured cells with commercial laboratory
apparatuses. Therefore, a direct translation to the
patient’s bedside may be difficult because the entire
device used should be re-thought for point-of-care
use.
Recently, long-range surface plasmon-polaritons
to detect red blood cells (RBC) selectively captured
by the surface chemistry was demonstrated (Krupin,
2014). However, because packed RBC must be
diluted in a buffer of controlled refractive index,
translation of the device to clinical use is still
challenging.
Techniques based on image processing on plate
test have been reported (Ferraz, 2010 – Ferraz,
2013). In this case, image processing is used to
objectively observe and interpret red cell
agglutination obtained manually. Issues concerning
blood and antibodies manipulation still exist.
Spectroscopic methods have also been reported
(Ramasubramanian, 2008 and 2009). However, the
use of an optical spectrometer to measure absorption
of diluted red cells may be difficult in clinical
practice.
In fact, although these new devices are able to
realize blood typing by objectively reading
agglutination, they still require hard translational
research work before to be installed in the patient’s
room.
In this paper, we present a mobile device meant
to address the above mentioned issues. The main
idea is to replace the four reaction zones of the
manual compatibility card with four IgMs grafted
biochips (two for the patient and two for the RCC)
inspired from Surface Plasmon Resonance (SPR)
and SPRi biochips. Hemagglutination is therefore
replaced by red cell capture. The detection of
capture red cells does not rely on SPR anymore. A
simple optical absorption technique is used.
Biochips are inserted in a mobile reader/actuator that
drives the fluids (blood, RCC and physiological
serum) and performs the optical reading and final
interpretation.
Overall, research actions to set-up what we
named SmarTTransfuser include four main steps.
The first series of test consisted in studying the IgMs
grafting and red cell capture using SPR and SPRi
methods with homemade biochips. This has been
previously reported (Charrière, 2011 and 2012) and
will be briefly mentioned.
The second set of experiments consisted in
translating the SPR biochip to biochips inserted into
cartridges and to detect the capture of red cells in
these half-bulk conditions together with the
correlation between the number of captured cells and
optical reading (article in press).
The third part of the experiments is the subject of
the current publication. It consists in using a large
number of whole blood (WB) and RCC samples to
test the automated fluid flow control, optical reading
and software interpretation of the ABO
compatibility result. The goal is to determine
sensitivity and specificity of the device together with
the blood group concordance between what is
expected and what the device reads. We also studied
the performance of the device according to the age
of RCC.
The last part of the work will consist in inserting
the mobile device directly into the transfusion line
and to test the fluid flows and device compatibility
in a clinical-like situation before to envisage clinical
trials. This will be reported later.
In what follows, we present the general
SmarTTransfuser concept. We then briefly recall
biochips fabrication and testing using SPR and SPRi
techniques. In section 4, we will present the
SmarTTransfuser device before to present the
experimental studies and corresponding results.
Then, a conclusion and future work will be
proposed.
2 GENERAL CONCEPT
2.1 Current Card Test Technique and
Sources of Errors
Figure 1 shows the principle of current ABO
compatibility cards.
The principle consists in hydrating four reactive
zones. Two for the patient are coated with anti-A
AnAutomatedMedicalDeviceforUltimateABOCompatibilityTestatthePatient'sBedside-TowardstheAutomationof
Point-of-careTransfusionSafety
59
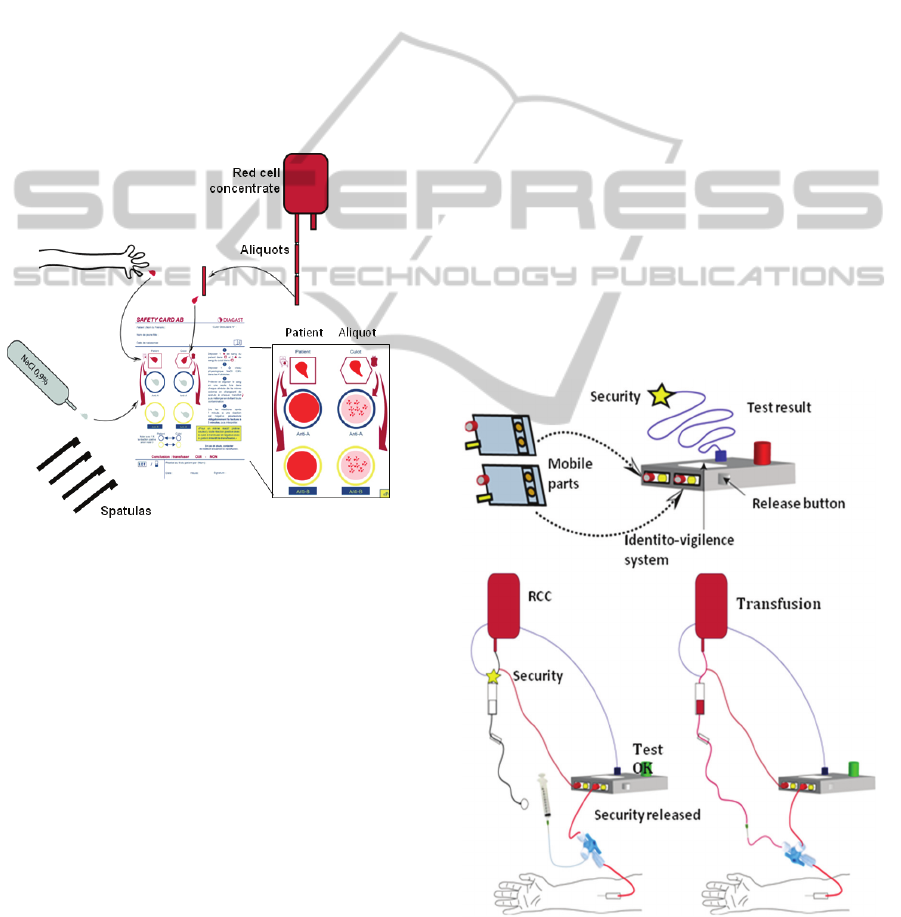
and anti-B IgMs, the same for the RCC. Blood is
sampled from the patient using a special needle. The
blood drop must be carefully deposited on the
patient's corresponding collection area. The same
holds for RCC aliquot. Once both bloods are
deposited in corresponding areas, the four antibody
zones must be hydrated using physiological serum.
Doing this, cross-contamination between antibodies
of different nature must be avoided.
One spatula is used to transfer the right quantity
of patient's blood to its corresponding anti-A zone.
The right blood volume must be taken at the first
attempt. A new spatula must be used for each of the
four blood transfers to avoid cross-contamination.
After this, the card is slightly shaken until a
possible hemagglutination is observed.
Figure 1: Current ABO compatibility cards.
Finally, the compatibility rules are applied to
interpret the results: for the same antibody zones,
positive reaction on RCC reaction zone and negative
on patient reaction zone forbids transfusion.
By
interpreting the card,
nurses decide if transfusion is
allowed or not. This method is the source of various
errors.
- Manipulation errors: cross contamination while
transferring bloods or hydrating antibodies.
- Reading errors: hemagglutination may be difficult
to observe, especially with patients requiring
transfusion.
- Interpretation errors.
- Risk of blood exposure when sampling patient's
blood.
Recently, cards a bit easier to use have been
proposed (ABTEST CARD®), but manipulation,
blood exposure and interpretation issues remains.
2.2 Concept of SmarTTransfuser
The general SmarTTransfuser concept is depicted in
figure 2. This concept is currently protected by two
patents (Pazart, 2011-1 and 2011-2).
As previously mentioned, two biochips are used to
test the patient’s blood. One is grafted with anti-A
IgMs the other one with anti-B IgMs. These two
biochips are inserted into a mobile cartridge.
Another similar cartridge is used to test the RCC.
The “patient” cartridge is connected to the patient’s
arm. Patient’s venous return is used to fill the
cartridge in order to minimise risks of blood
exposure. The “RCC” cartridge is connected to the
RCC.
Both cartridges are inserted into a mobile
reader/actuator. It is used to drive the fluids into the
cartridges (the measurement sequence will be
described later) and to perform the optical reading.
Embarked software is used to control ABO
compatibility. If bloods are compatible, the security
valve is opened and transfusion can be done.
Conversely, if bloods are not compatible, physicians
can either refuse the transfusion or force the security
valve to transfuse anyway (this may happen in
extreme cases).
Figure 2: General concept of SmarTTranfuser.
BIODEVICES2015-InternationalConferenceonBiomedicalElectronicsandDevices
60
3 BIOCHIP FABRICATION AND
TESTING
Here, we briefly recall the fabrication and testing of
biochips using SPR and SPRi techniques we
presented before (Charrière 2011 and 2012).
3.1 Chemical Functionalization and
SPR Experiments
Homemade chromium/gold biochips were
chemically functionalized as follows. The chemical
functionalization was obtained using a mixture of
11-mercapto-1-undecanol (11-MUOH) and 16-
mercapto-1-hexadecanoic acid (16-MHA)
(purchased from Sigma–Aldrich). The mixture of
11-MUOH/16-MHA (97/3 by mole) at 1mM in
absolute ethanol was sonicated for 10 min using an
Elma sonicator (power 90W, frequency 50/60 Hz).
Surfaces were rinsed by ethanol and ultra-pure water
and electrostatic preconcentration test was realized
with the Biacore™ 2000 apparatus at 25 °C at a rate
of 2 µL/min. Different immobilization pHs were
tested and the optimal pH conditions for promoting
functionalized antibody/surface interactions were
established. For each antibody, the best interaction
was obtained with pH 4.65.
Then, the carboxyl groups were activated using
240 µL of N-hydroxysuccinimide (NHS) at 10 mM
and 1-Ethyl-3-(3-dimethylaminopropyl) carbodi-
imide (EDC) at 48 mM (Amine Coupling Kit from
Biacore AB, Uppsala, Sweden) and incubated for 30
min at RT. Surfaces were rinsed by ultra-pure water.
This procedure prepares the chips for the
immobilization step.
The antibodies used were IgM anti-A or IgM
anti-B (DIAGAST, provided by the French Blood
Transfusion Center, Besançon). The running buffer
was saline phosphate buffer (PBS, 100 mM at
pH=7.4 with NaCl 50 mM). For each antibody, the
surface was nearly saturated after the first injection,
showing that our grafting conditions are optimized.
The grafting rate reaches 1500 IgMs/µm
2
on
average, which could potentially involve 100 000
antibodies for each captured red blood cell.
3.2 Red Cell Capture using SPR
Imaging
The biochip preparation was performed as described
above. Four spots of IgMs antibodies were grafted
onto the surface. Antibodies anti-A or anti-B were
diluted (1/10) in acetate buffer (0.1 mg/mL, pH=4.5)
and 2 spots of each specie (2 µL/spot) were
deposited on each surface and incubated for 1 hour
at room temperature in a humid chamber. Then a
blocking agent (Rat Serum Albumine 40 µg/mL,
pH=5.2) was used to passivate the surface by
incubation at room temperature for 30 min.
Incubation in ethanolamine (0.2 M) was then used to
target the free NHS entities in order to desactivate
the surface. Finally, the biochips were rinsed with
ultra pure water and used for SPRi experiments.
They were performed using a SPRi-Plex imager
(Horiba Scientific, France) equipped with a 660 nm
wavelength LED and a CCD camera.
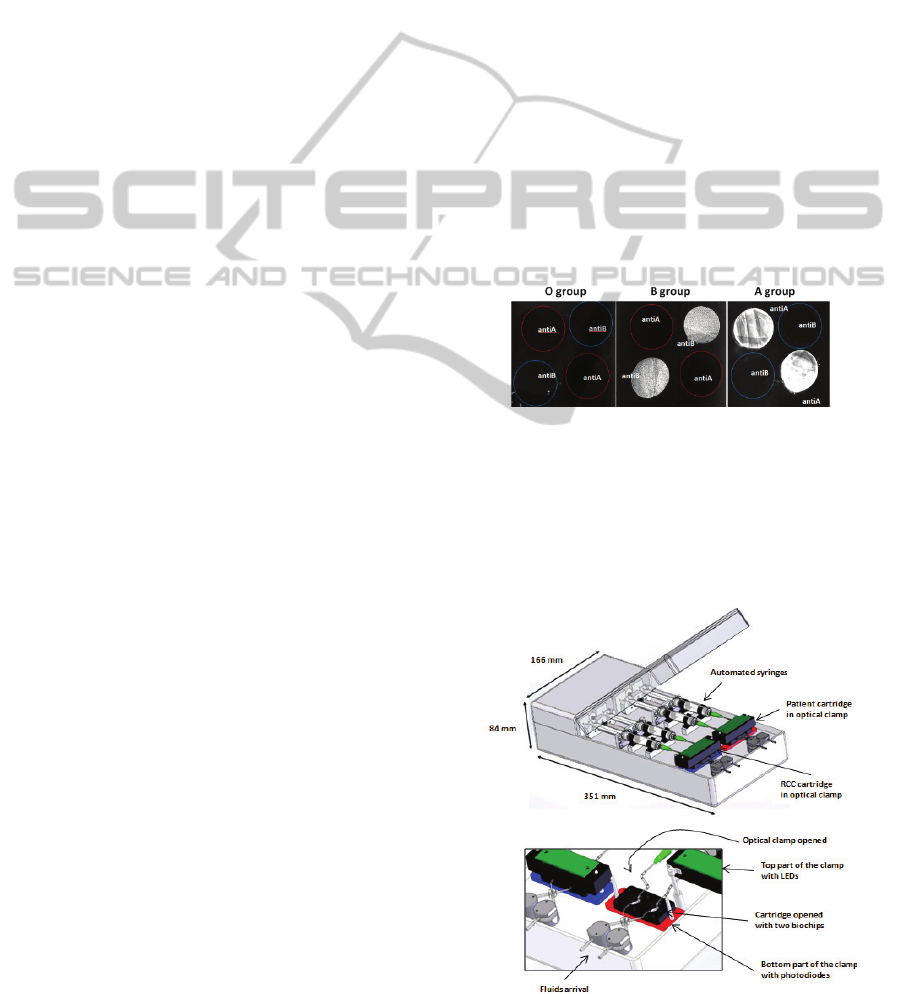
Erythrocytes are captured according to the
compatibility rules: red cells from A group are
captured on the anti-A biochip only. B group red
cells are captured only on anti-B biochips. AB red
cells are captured on both anti-A and anti-B biochips
while O red cells are not captured at all.
Figure 3 shows SPRi images obtained with this
technique. This illustrates the ability of the biochips
to efficiently and selectively capture red blood cells
Figure 3: Selective capture of RBC using SPR imaging.
4 DESCRIPTION OF THE
DEVICE
Schematic views of the device are shown in figure 4.
Figure 4: Views of the device.
AnAutomatedMedicalDeviceforUltimateABOCompatibilityTestatthePatient'sBedside-TowardstheAutomationof
Point-of-careTransfusionSafety
61
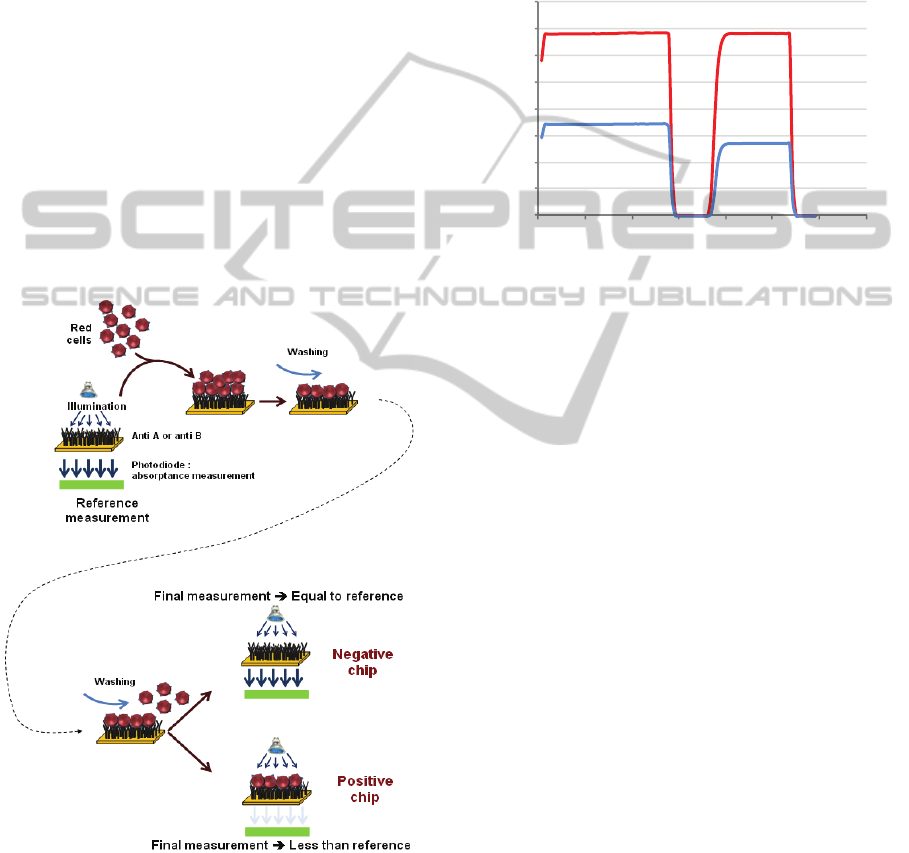
The heart of the device consists of two
cartridges, one used to test the patient's blood, the
other for the RCC. Both of them contain two IgMs
grafted biochips, one with anti-A, the other with
anti-B antibodies. When blood (either WB or RCC)
is applied to the biochips, antigen-antibody
recognition occurs.
These microfluidic cartridges are placed into an
optical clamp that consists of blue LEDs and
photodetectors. Each biochip can then be
interrogated with its own LED/Detector pair. Red
cells trapped onto the biochip absorb light. The
detection principle consists in measuring the
transmission before red cells are driven onto the
chip, when physiological serum fills the circuitry,
(reference measurement) and after red cell/surface
interaction followed by washing with physiological
serum (final measurement). This is illustrated in
figure 5. The optical reading is therefore an
absorbance measurement given by:
absorbance = (reference-final)/reference (1)
Figure 5: Optical detection principle.
In what follows, positive chips are defined as
chips that have captured red cells, regardless of the
blood group. Conversely, negative chips correspond
to chip where no capture occurred.
Fluids (blood, RCC and physiological serum) are
driven by means of automated syringes controlled
via dedicated software. This software also drives the
optical measurement, human-machine interface and
USB connection to a PC for data recording and
processing.
Figure 6 shows an example of signal recording
corresponding to both positive (red curve) and
negative (blue curve) chips.
Figure 6: Example of recorded signal.
5 EXPERIMENTAL TESTING
The device was tested using 148 blood aliquots. This
represents 296 biochips and therefore 148 cartridges.
Blood comes from both RCC and WB. Samples
were provided by the French Blood Agency in
accordance with the ethic rules and with informed
consent obtained from donors.
Among these 296 chips, 4 are not taken into
account because errors occurred while assembling
the cartridges. The goal of this paper is to present de
behaviour of the device and not the ability to
correctly fabricate cartridges. Perfect fabrication of
cartridges will be the responsibility of the company
who eventually will fabricate the device according to
their own quality control policy.
Therefore, only 292 biochips were tested.
Remember that 2 biochips are required to test 1
sample. For two samples, inversions of the anti-A
and anti-B biochips were made. Although the
biochips behave correctly and are taken into account
for biochip testing, the corresponding samples were
not taken into account for compatibility testing. At
the end, 142 samples were tested for compatibility.
The repartition of samples in terms of RCC, WB
and blood group is given in table 1.
0
200
400
600
800
1000
1200
1400
1600
00:00 01:12 02:24 03:36 04:48 06:00 07:12 08:24
V
o
l
tage
(
m
V)
Time
(
min
)
NaCl 0.9 % NaCl 0.9 %Blood
Negative
biochip
Positive
biochip
BIODEVICES2015-InternationalConferenceonBiomedicalElectronicsandDevices
62
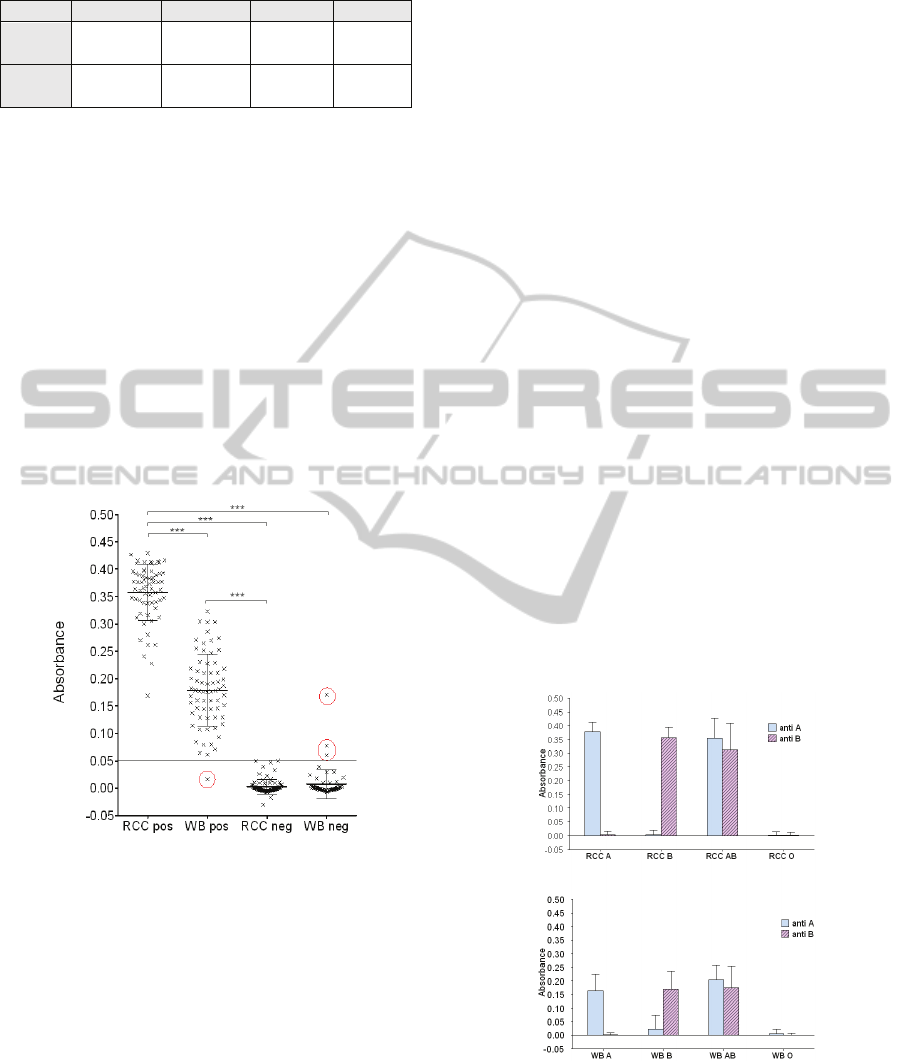
Table 1: Number of samples used in this study.
Group A B AB O
RCC 19 25 14 20
WB
17 13 20 14
In what follows, we present results concerning the
ability of the biochip to correctly capture red blood
cells regardless of the age of the blood, the
correlation between the red cell density on the chip
and the optical reading, the ability of the software to
interpret the result obtained from the optical reading
and the correlation between the tested blood group
and the blood group detected by the device.
5.1 Biochip Efficiency
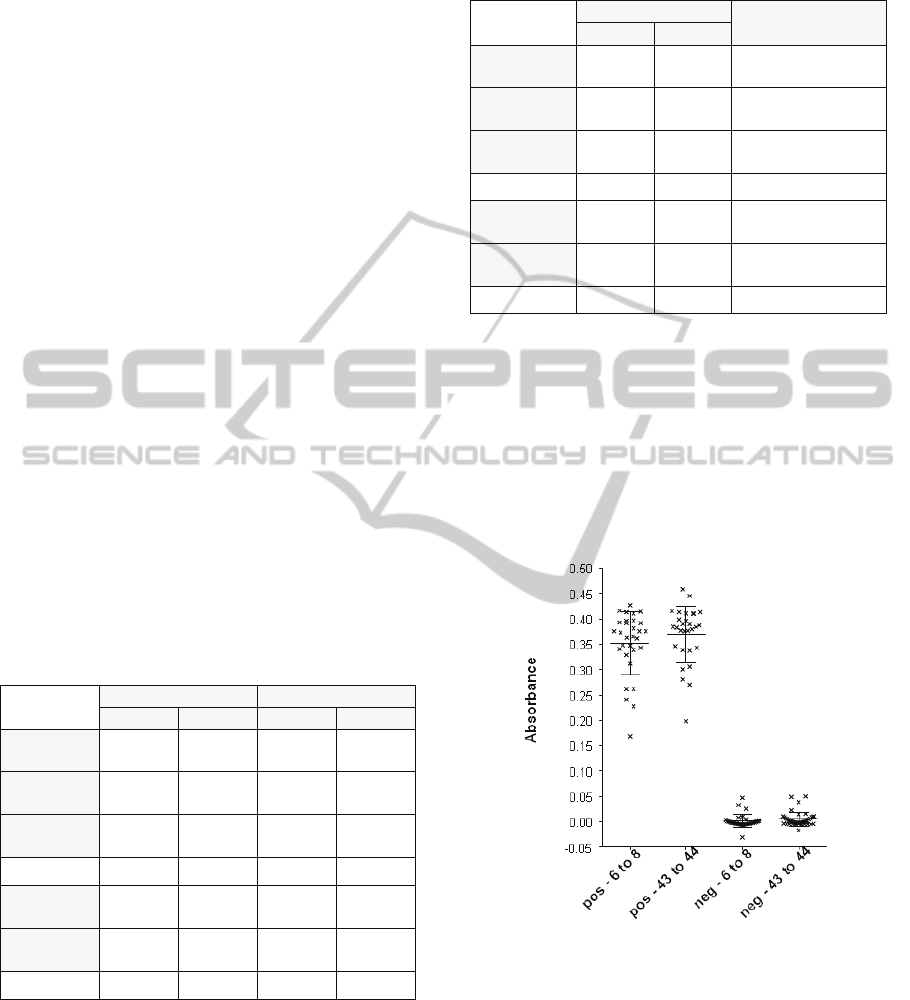
Here, 292 biochips were tested. Figure 7 shows the
absorbance measured as a function of positive and
negative biochips for both RCC and WB. Positive
and negative biochips correspond to the 4 blood
group.
Figure 7: Absorbance versus positive or negative biochips.
Mean ± SD. Kruskal-Wallis test followed by Dunn’s
multiple comparison tests. *** p < 0.001. Negative values
are due to a slight drift of the electronics (also visible in
figure 9).
There is a strong difference between positive and
negative biochips. No statistical variation of the
absorbance was observed in negative biochips
(0.003 ± 0.001 for RCC neg and 0.007 ± 0.02 for
WB neg). Conversely, significant difference is
observed in positive biochips (0.36 ± 0.006 for RCC
pos and 0.18 ± 0.008 for WB pos). This result may
be related to the large difference of erythrocytes
number in samples (4.3x10
9
± 10
8
RBC/mL for RCC
and 10
9
C/mL for WB).
The best absorbance threshold to discriminate
between positive and negative biochip was set to
0.05 (minimization of mis-assignments). In this way,
only 4 errors occurred (red circles in the figure). One
biochip represents a false negative. For it, not
enough red cells were captured although the biochip
should have been positive. Indeed, red cell capture is
not homogenous on the surface, probably due to an
antibodies graft problem. This means that 1 patient
of group O was detected as A. Three other biochips
were false positive. For them a strong non-specific
retention of red cells was recorded due to washing
problem. This means that 1 patient of group O was
detected as A, 2 patients B detected as AB and 1
patient AB detected as A.
As seen in figure 8, this positive and negative
determination is obtained for A and B groups for
both RCC (0.38 ± 0.008 for RCC group A anti-A
and 0.0035 ± 0.003 for RCC group A anti-B; 0.003
± 0.004 for RCC group B ant-A and 0.35 ± 0.008 for
RCC group B anti-B) and WB (0.16 ± 0.014 for WB
group A anti-A and 0.001 ± 0.002 for WB anti-B;
0.024 ± 0.013 for WB group B anti-A and 0.17 ±
0.018 for WB group B anti-B). As expected, no
difference is observed between anti-A and anti-B
biochips for AB and O groups for both WB and
RCC. ).
Results given in figures 7 and 8 are in good
agreement with measurements made during the
second set of experiments described in the
introduction.
Figure 8: Absorbance versus blood group. . It shows the
absorbance as a function of the blood groups for both RCC
and whole blood. For each kind of sample, absorbance of
both anti-A and anti-B biochips are given. Mean ± SD.
Kruskal-Wallis test followed by Dunn’s multiple
comparison tests. *** p < 0.001.
AnAutomatedMedicalDeviceforUltimateABOCompatibilityTestatthePatient'sBedside-TowardstheAutomationof
Point-of-careTransfusionSafety
63
From these results, sensitivity and specificity of
the device can be calculated. For this, we consider
the following definitions.
- True positive chip (TP): red cells are present on
biochips when it should
- False positive chip (FP): red cells are present on
biochips when it should not.
- A true negative chip (TN) does not capture cells
when it should not.
- A false negative chip (FN) does not capture
cells when it should.
Now, sensitivity is defined as the probability to
record a positive test with positive biochips. It is
given by:
sensitivity = TP / (TP+FN) (2)
In the same manner, the specificity is defined as
the probability to record a negative test with
negative biochips. It is given by:
specificity = TN / (TN+FP) (3)
Table 2 presents the sensitivity and specificity of
biochips in terms of grafted antibodies for both RCC
and WB. Almost all sensitivities are 100%, except
for anti-B biochips (97%) used with WB (false
negative described earlier). It is the same for
specificities: all biochips are 100% specific, except
the anti-A biochips used with WB (3 false positives
described previously).
Table 2: System performance in terms of biochips.
RCC WB
Anti-A Anti-B Anti-A Anti-B
Number of
Biochips
82 78 68 64
Expected
positives
36 39 39 33
Recorded
positives
36 39 39 32
Sensitivity 100% 100% 100% 97%
Expected
negatives
46 39 29 31
Recorded
negatives
46 39 26 31
Specificity 100% 100% 89.7% 100%
Table 3 presents the same parameters regardless
of the blood type and for the entire device. At the
end, specificity of the device is 99.3% and
specificity is 97.9%. Improving fabrication of the
cartridges would probably resolve these mis-
assignments and improved sensitivity and
specificity.
Table 3: Performance in terms of antibodies and for the
entire device.
RCC + WB
Entire device
Anti-A Anti-B
Number of
Biochips
150 146 292
Expected
positives
75 72 147
Recorded
positives
75 71 146
Sensitivity 100% 98.6% 99.3%
Expected
negatives
75 70 145
Recorded
negatives
72 70 142
Specificity 96% 100% 97.9%
Biochips performance was also tested as a
function of the age of the blood donation. In this
case, only RCC were considered because WB is
meant to be fresh. For this test we used:
- 30 positive biochips with 6 to 8 days old
donations.
- 31 negative biochips with 6 to 8 days old.
- 29 positive with 43 to 44 days old.
- 40 negative with 43 to 44 days old.
Figure 9: Efficiency versus age in terms of
positive/negative.
Figure 9 shows the absorbance obtained in terms
of positivity/negativity while figure 10 refers to
blood groups. No difference was observed between
all kinds of positive biochips: 0.35 ± 0.011 for 6 to 8
days old RCC and 0.37 ± 0.01 for 43 to 4 days old
RCC. The same is observed between negative
biochips: 0.001 ± 0.002 for 6 to 8 days old RCC and
0.005 ± 0.002 for 43 to 44 days old RCC. Statistical
BIODEVICES2015-InternationalConferenceonBiomedicalElectronicsandDevices
64
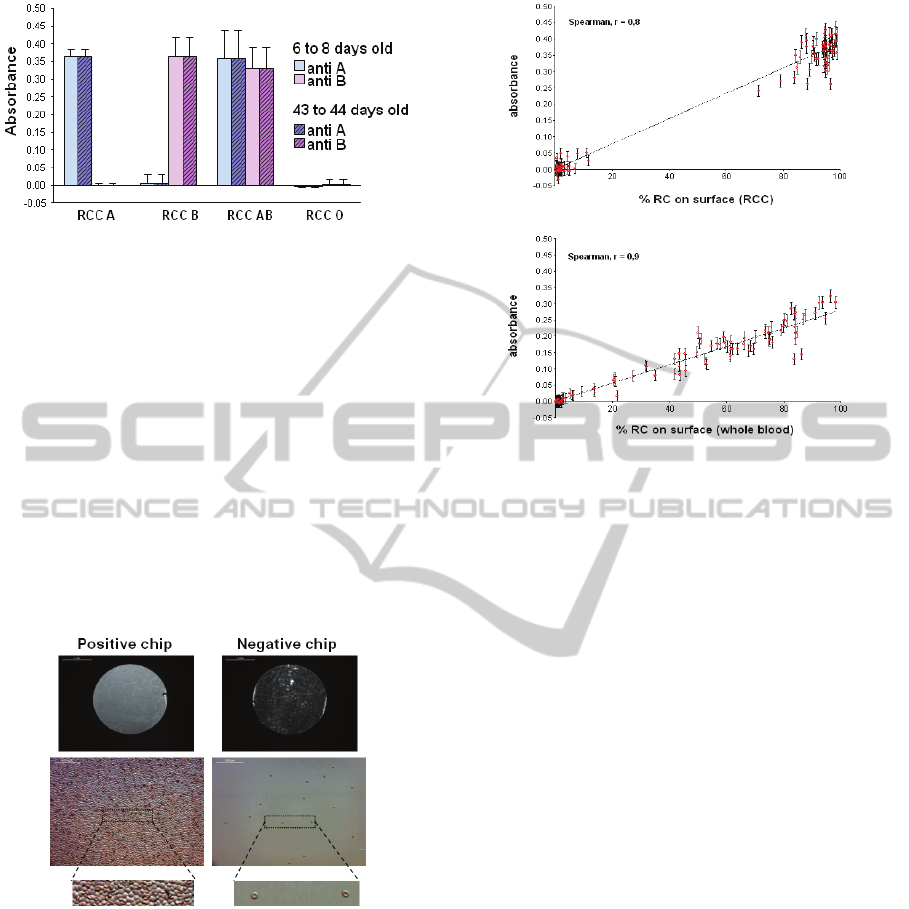
Figure 10: Efficiency versus age in terms of blood groups.
analysis: Kruskal-Wallis test followed by Dunn’s
multiple comparison test.
It is quite clear that the age of the blood donation
does not impact biochips performances.
5.2 Correlation Between Red Cell
Concentration and Optical Reading
After each test, cartridges are dismounted and
biochips are observed with a microscope. Pictures of
five random zones of the chips are taken and the
number of red cells in each zone is counted using
ImageJ software. Figure 11 shows pictures of red
cells trapped on the biochip surface for both positive
and negative biochips.
Figure 11: Pictures of red cells capture for both positive
and negative biochips.
The percentage of surface occupied by red cells
is then calculated by averaging measurements in all
zones. Figure 12 shows the correlation between the
percentage of red cells captured on the biochips and
the absorbance measured for both RCC and WB.
Again, results given in figure 12 are in good
agreement with measurements made during the
second set of experiments described in the
introduction.
Figure 12: Correlation between percentage of captured
cells and optical reading.
5.3 Compatibility Interpretation
For this, 74 compatibility tests were performed. In
all cases the software delivered the right
compatibility information, perfectly coherent with
what happened at the biochip surface.
Of course, we mentioned cases where mis-
assignments occurred. However, this part of the test
concerns the fact that the device delivers the right
information from the result of the optical
measurement.
For example, with sample SO11 (WB of group
O), a strong non-specific RCC retention has been
observed on the anti-A biochip, with an absorbance
of 0.06 corresponding to a percentage of red cells of
21% on the biochip surface. This "patient" was
considered A group. When testing the compatibility
with B group RCC, the device concluded that the
transfusion should not be allowed. Therefore the
optical reading and the interpretation software work
properly.
This highlights the fact that mis-assignments
principally come from biochips dysfunctions.
5.4 Concordance Tests
The last experiment concerned the ability of the
device to correctly identify blood groups. Among
142 concordance tests performed 4 mis-assignments
occurred. The concordance performance is therefore
97% as detailed in table 4.
AnAutomatedMedicalDeviceforUltimateABOCompatibilityTestatthePatient'sBedside-TowardstheAutomationof
Point-of-careTransfusionSafety
65

Table 4: Detail of the concordance test (m-a: mis-
assignment).
Group A B AB O
RCC
N° of tests
19 25 14 20
Concordance
%
100 100 100 100
WB
N° of tests
17 13 20 14
Concordance
%
100
84.6
2 m-a
95
1 m-a
94.4
1 m-a
All groups
RCC
+ WB
N° of test
142
Concordance
%
97
4 m-a
Mis-assignments reported here correspond to those
already mentioned in section 5.1.
6 CONCLUSIONS
In this paper, we presented a new device able to
semi-automatically perform an ultimate ABO
compatibility test. It is based on biochips grafted
with anti-A and anti-B antibodies. They are inserted
into disposable cartridges and placed into a mobile
and re-usable reader/actuator. The latter includes
embarked software that drives and controls the fluid
flows, performs the optical detection of captured red
cells and interpret the result in terms of ABO
compatibility.
In the current study, 292 biochips were tested.
The device exhibits sensitivity and specificity equal
to 99.3% and 97.9% respectively. We still need to
fully understand why 4
mis-assignments occurred
during these tests. However, for the 3 false positives,
washing was imperfect, probably due to a slight
motor dysfunction. For false negative biochips,
IgMs were probably not optimally grafted which
may explain the non-uniform red cells capture.
Optical reading and software interpretation are not to
be blamed. However, just after these 4 false results
have been observed, the same samples used with
new biochip were re-tested. This time, everything
worked correctly and no
mis-assignment was
observed.
Future work will consist in inserting the device
in the transfusion line and to control that RCC and
patient's blood are correctly driven onto the
biochips. Previous experiments (not shown here)
already demonstrated the efficient use of patient's
venous return in order to sample patient's blood with
minimum blood exposure risks.
To conclude, we believe that the
SmarTTransfuser concept may help enhancing blood
transfusion safety, not only in countries where a
double ultimate test is already performed, but also in
countries where only one test is considered.
Furthermore, such a device is meant to drastically
reduce non-compatibility accidents in countries
where the whole transfusion process (blood
donation, conservation, delivery and transfusion) is
not yet fully satisfactory.
ACKNOWLEDGEMENTS
This work was supported by the French
RENATECH network, the Etablissement Français
du Sang (EFS), the INSERM, the DGOS, the CNRS,
OSEO, the University of Franche-Comté
(“innovative project maturation” program) and the
European Community through the FEDER Program.
This work is developed in the frame of the Biom'@x
transversal axis at FEMTO-ST.
REFERENCES
ANSM, 2012 and 2014. Rapport d’activité hémovigilance.
http://ansm.sante.fr/Mediatheque/Publications/Bilans-
Rapports-d-activite-Bilans-et-rapports-d-
activite#folder_26762.
Berthier, A., Elie-Caille, C., Lesniewska, E., Delage-
Mourroux, R., Boireau, W., 2011. Label-free sensing
and atomic force spectroscopy for the characterization
of protein-DNA and protein-protein interactions:
application to estrogen receptors, J. Mol. Recognit.
JMR. 24, p.429–435.
Boozer, C., Kim, G., Cong, S., Guan, H., Londergan, T.,
2006. Looking towards label-free biomolecular
interaction analysis in a high-throughput format: a
review of new surface plasmon resonance
technologies, Curr. Opin. Biotechnol. 17, p. 400–405.
Campbell, C., Kim, G., 2007. SPR microscopy and its
applications to high-throughput analyses of
biomolecular binding events and their kinetics,
Biomaterials. 28, p. 2380–2392.
Charrière, K., Guerrini-Chapuis, J.S., Wacogne, B., Elie-
Caille, C., Pieralli, C., Pazart, L., Morel, P., Boireau,
W., 2011. SmartTransfuser: a lab-on-chip system for
enhancing transfusion security", 2
nd
International
Conference on Bio-sensing Technology, Amsterdam,
The Nederlands.
Charrière, K., Guerrini-Chapuis, J.S., Wacogne, B., Elie-
Caille, C., Pieralli, C., Pazart, L., Morel, P., Boireau,
W., 2012. SmarTTransfuser - A Biochip System for
the Final ABO Compatibility Test, in: SciTePress -
Science and and Technology Publications, Vilamoura,
p. 257-262.
Cid, J., Nogués, N., Montero, R., Hurtado, M., Briega, A.,
Parra, R., 2006. Comparison of three microtube
column agglutination systems for antibody screening:
BIODEVICES2015-InternationalConferenceonBiomedicalElectronicsandDevices
66

DG Gel, DiaMed-ID and Ortho BioVue, Transfus.
Med. Oxf. Engl. 16 p. 131–136.
EFS, 2012 and 2013. Rapport d’activité 2012, (2013).
http://www.dondusang.net/rewrite/article/5592/l-efs/
publications/feuilletez-en-ligne-le-rapport-d-activite-
2012-de-l-efs.htm?idRubrique=790.
Ferraz, A., Carvalho, V., Soares, F., 2010. Development of
a Human Blood Type Detection Automatic System, in:
B. Jakoby, M.J. Vellekoop (Eds.), Eurosensors Xxiv
Conf., Elsevier Science Bv, p. 496–499.
Ferraz,, A., Carvalho, V., 2013. A Prototype for Blood
Typing Based on Image Processing, in:
SENSORDEVICES 2013 Fourth Int. Conf. Sens.
Device Technol. Appl., p. 139–144.
Houngkamhang, N., Vongsakulyanon, A., Peungthum, P.,
Sudprasert, K., Kitpoka, P., Kunakorn, M., et al.,
2013. ABO Blood-Typing Using an Antibody Array
Technique Based on Surface Plasmon Resonance
Imaging, Sensors, 13 p. 11913–11922.
Krupin, O., Wang, C., Berini, P., 2014. Selective capture
of human red blood cells based on blood group using
long-range surface plasmon waveguides, Biosens.
Bioelectron. 53, p. 117–122.
Langston, M.M., Procter, J.L., Cipolone, K.M., Stroncek,
D.F., 1999. Evaluation of the gel system for ABO
grouping and D typing, Transfusion (Paris), 39, p.
300–305.
Malomgre, W., Neumeister, B., 2009. Recent and future
trends in blood group typing, Anal Bioanal Chem.,
393, p. 1443–1451.
Mansuy-Schlick, V., Delage-Mourroux, R., Jouvenot, M.,
Boireau, W., 2006. Strategy of macromolecular
grafting onto a gold substrate dedicated to protein–
protein interaction measurements, Biosens.
Bioelectron., 21, p. 1830–1837.
Quinn, J.G., O’Neill, S., Doyle, A., McAtamney, C.,
Diamond, D., MacCraith, B.D. et al., 2000.
Development and Application of Surface Plasmon
Resonance-Based Biosensors for the Detection of
Cell–Ligand Interactions, Anal. Biochem., 281, p.
135–143.
Quinn, J.G., O’Kennedy, R., Smyth, M., Moulds, J.,
Frame, T., 1997. Detection of blood group antigens
utilising immobilised antibodies and surface plasmon
resonance, J. Immunol. Methods., 206, p. 87–96.
Ramasubramanian, M., Anthony, S., Lambert, J., 2008.
Simplified spectrophotometric method for the
detection of red blood cell agglutination, Appl. Opt.,
47, p. 4094–4105.
Ramasubramanian, M.K., Alexander, S.P., 2009. An
integrated fiberoptic–microfluidic device for aggluti-
nation detection and blood typing, Biomed.
Microdevices, 11, p. 217–229.
Steiner, G., 2004. Surface plasmon resonance imaging,
Anal. Bioanal. Chem., 379, p. 328–331.
Pazart, L., Wacogne, B., Pieralli, C., Boireau, W., Morel,
P.,2011. Device for taking a sample of a body fluid
and method for implementing same, WO 2011055029.
Pazart, L., Wacogne, B., Pieralli, C., Boireau, W., Morel,
P., 2011. Secure perfusion system. WO 2011055031.
AnAutomatedMedicalDeviceforUltimateABOCompatibilityTestatthePatient'sBedside-TowardstheAutomationof
Point-of-careTransfusionSafety
67
