
Traffic Expression through Ubiquitous and Pervasive Sensorization
Smart Cities and Assessment of Driving Behaviour
Fábio Silva
1
, Cesar Analide
2
and Paulo Novais
2
1
Computer Science and Technology Center, University of Minho, Braga, Portugal
2
Department of Informatics, University of Minho, Braga, Portugal
Keywords: Pervasive Monitoring, Indicator Assessment, Sustainable Development.
Abstract: The number of portable and wearable devices has been increasing in the population of most developed
countries. Meanwhile, the capacity to monitor and register not only data about people’s habits and locations
but also more complex data such as intensity and strength of movements has created an opportunity to their
contribution to the general wealth and sustainability of environments. Ambient Intelligence and Intelligent
Decision Making processes can benefit from the knowledge gathered by these devices to improve decisions
on everyday tasks such as planning navigation routes by car, bicycle or other means of transportation and
avoiding route perils. Current applications in this area demonstrate the usefulness of real time system that
inform the user of conditions in the surrounding area. Nevertheless, the approach in this work aims to
describe models and approaches to automatically identify current states of traffic inside cities and relate
such information with knowledge obtained from historical data recovered by ubiquitous and pervasive
devices. Such objective is delivered by analysing real time contributions from those devices and identifying
hazardous situations and problematic sites under defined criteria that has significant influence towards user
well-being, economic and environmental aspects, as defined is the sustainability definition.
1 INTRODUCTION
Ambient Intelligence (AmI) is a very active area of
knowledge and constitutes a multi-disciplinary
subject which takes advantage of advances in
sensing systems, pervasive devices, context
recognition and communications. Nowadays, AmI
applications can be found in fields ranging from
home, office, transport, tourism, recommender and
safety systems, among many others (Sadri, 2011).
There is also a renewed concern towards the quality
of living and well-being inside great cities. It is
forecasted that most people will be living inside
cities until 2050. If true, such statement would
predict the increase of road traffic in cities that were
neither originally designed nor prepared to handle
such influxes of traffic. Current identification
systems compromise direct evaluation and costly
field studies to assess and evaluate the impact of the
flux of traffic in certain cities. Additionally,
simulation experiments provide possible scenarios
under which some assessment can be made.
However, the downside of simulations is the use of
simplified models that are thought to mimic reality
when in fact they may differ to some degree. Even
more, the accuracy of these simulations is made by
measuring the current state which in itself can
include measurement errors and possible virtual
scenarios under the realistic behaviours.
Ubiquitous Sensorization may be used to assess
current traffic conditions, avoiding the use of costly
field studies. The nature of those ubiquitous devices
enables the possibility of direct analysis of driver
behaviour and community habits (points of
congestion, high speed areas and hazardous corners)
assessed trough the statistical treatment of driving
records. Such model has a direct impact diagnosing
the current state of traffic and traffic behaviours to
each route that may be used in modern GPS
navigation systems as an additional parameter.
Approaches to real time safety assessment can be
found in the research community, for instance in
(Laureshyn, Svensson, and Hydén, 2010) and
(Minderhoud and Bovy, 2001) a set of indicators is
used to assess driving safety through the use of
indicators. Such indicators take into consideration
time of reaction, vehicle breaking time and whether
or not there is a collision course. Yet, the analysis is
still in real time, local to the surrounding area and
activities such as identification of other vehicles
within the nearby visible space. These capabilities
are produced with the help of video interfaces and
33
Silva F., Analide C. and Novais P..
Traffic Expression through Ubiquitous and Pervasive Sensorization - Smart Cities and Assessment of Driving Behaviour.
DOI: 10.5220/0005242500330042
In Proceedings of the 5th International Conference on Pervasive and Embedded Computing and Communication Systems (PECCS-2015), pages 33-42
ISBN: 978-989-758-084-0
Copyright
c
2015 SCITEPRESS (Science and Technology Publications, Lda.)

disregards other sources of information.
In the case of transport applications, an area also
known as Smart Cars the AmI system must be aware
of not only the car situation, but also the driver's
intention, his physical and physiological conditions
and the best way to deal with them (Rakotonirainy
and Tay, 2004). The driver's behaviour is, thus, of
key importance. Some authors have used machine
learning and dynamical graphical models for
modelling and recognizing driver's behaviours (Sun,
Wu, and Pan, 2009). Examples of applications
integrating AmI and ubiquitous principles in driving
and traffic analysis were already purposed in the
literature. In (Li et al., 2012), it is described a
monitoring and analysis system to approach
personalized driving behaviour, for emerging hybrid
vehicles. The system is fully automated, non-
intrusive with multi-modality sensing, based on
smartphones. The application runs while driving and
it will present personalized quantitative information
of the driver's specific driving behaviour.
The quality of devices used to perform monitoring
has a direct relationship to the quality of
measurements, thus, in this case, they are the main
source of measurement error which needs to be
controlled and contained to known values of error in
order to make this study effective to production use.
Other advantages include the possibility to increase
information quality and create new routing
algorithms in existing navigation systems taking into
consideration aspects such as driver’s driving style
or hazardous event rate during the routing and
planning phase.
In (Paefgen, Kehr, Zhai, and Michahelles, 2012) a
mobile application assesses driving behaviour, based
on critical driving events, giving feedback to the
driver. The Nericell system (Mohan, Padmanabhan,
and Ramjee, 2008), from Microsoft Research,
monitors road and traffic conditions using the
driver’s smartphone and corresponding incorporated
sensors, but it can also detect honking levels and
potholes on roads. The I-VAITS project
(Rakotonirainy and Tay, 2004) is an example that
pretends to assist the driver appropriately and
unobtrusively, analysing real-time data from the
environment, from the car and from the driver itself,
by the way the driver uses the different elements of
the car, their movements or image processing of
their face expressions. In (Bosse, Hoogendoorn,
Klein, and Treur, 2008), in the context of a car
safety support system, an ambient agent-based
model for a car driver behaviour assessment is
presented. The system uses sensors to periodically
obtain information about the driver's steering
operation and the focus of the driver's gaze. In the
case of abnormal steering operation and unfocused
gaze, the system launches proceedings in order to
slow down, stop the car and lock the ignition.
In what refers to devices used, there are today a wide
range of options that can be used. The most effective
should be devices that are always present and can
perform complex tasks while not requiring user’s
direct attention. In such list, there are devices like
smartphones, smartwatches, and intelligent
wristbands. Those offer the advantage of
accompanying user from one situation to another,
but there are devices that can be used that are
situation and local specific such as the internal
computer of a car. In this last case the object itself
becomes part of the car which might increase its
production cost while on the other hand multi-
purpose portable devices suffice to the work
described.
Another important subject in these studies is the
preservation of privacy, which may matter in order
to make user trust the system. Privacy concerns can
be included in many steps from the information
collection and protection to the disclosure of
aggregated information. Framework have been
proposed in the literature to raise awareness to the
potential causes that impair privacy. Martínez-
Ballesté et. al (Martinez-Balleste, Perez-martinez,
and Solanas, 2013) discusses a five dimensional
framework to handle privacy which can be applied
these projects. In this study, privacy concerns the
identity of users, their queries in the system, their
location, their footprint generated by sensors and the
information they own. In the study portrayed in this
article, privacy disclosure is maintained locally to
the device the user holds and in the central server
requires user’s token to access is own information.
Aggregated results are disclosed coupled with
different user and with no reference to user, location
or records used. Though privacy issues are being
addressed, as stated in the literature, in order to
ensure privacy it is felt the need of a minimum
community users which have to have overlapping
routines to mask their own habits statistically.
2 TRAFFIC ASSESSMENT
Traffic assessment is directly related to trending
topics such as smart cities and sustainable services.
It is an increasing concern not only the quality of life
of people inside big cities with millions of
inhabitants but also its sustainability. Such concern
has already derived the construction of sustainable
PECCS2015-5thInternationalConferenceonPervasiveandEmbeddedComputingandCommunicationSystems
34

development indicators and sustainable indicators
that directly target this theme.
2.1 Road Traffic Analysis
2.1.1 Slow and Congested Sites
The definition of congested sites refers places in
which traffic flow becomes affect by the overflow of
cars that affect negatively usability of such roads to
a point where the movement and flow becomes
much slower than the norm of is even stopped.
Aside from the stressful environment the
concentration of pollution gases in traffic jam can be
a negative influence for one’s health. The
identification of traffic jams, and more importantly
their avoidance can help mitigate its influence over
the social dimension of sustainable driving. With the
advent of the paradigm Smart Cities, health has
become one of the topics of concern (Solanas et al.,
2014). Smart assumption with information from
vehicle configuration, speed and fuel can be used to
grossly estimate the gas emissions to the
atmosphere. Toxic emissions from vehicle exhaust
fumes can be tracked both by the number of vehicles
identified in a certain area and by the time the
vehicle is present in such area. This can also be used
to monitor air quality, even if grossly, it can give
meaningful information to healthcare frameworks
and help raise awareness for such problems in
mobility and city planning.
2.1.2 Dangerous and Hazardous Routes
There are different approaches to identify hazardous
routes or places. Depending on the approach results
may vary which indicates that the analysis and
classification of this parameter can become complex
and include coverage problems, where the definition
and identification process might miss classes of
spots due to incomplete definition or incomplete
detection systems.
Traditional approaches consider the number of
accidents or the number of fines issued. In this case,
they fail to identify situations like preponderance to
aggressive driving, dangerous events such as high
variance in velocity in short periods of time or
dangerous maneuverers like high speed cornering
sudden near full or full stops.
2.2 Driving Analysis
2.2.1 Driving Profiles
The usage of roads can be affected by driver’s
driving patterns. It is accepted that, if the majority of
drivers have a predisposition to drive more
aggressively in certain areas than others, then those
areas are more dangerous. Our approach uses this
thought to gather the driving records from a
community of users and use them to calculate
potential hazardous spots inside cities. Most
evaluations are made using standard driving
attributes, matured in the literature over a number of
studies across different authors and projects. Thus,
the list of most used attributes is:
Time
Average velocity
Standard deviations of velocity
Number of breaks
Standard deviations of breaks
Number of accelerations
With those measures, a complete profile can be
designed and executed in applications that monitor
current driver’s performance. In (Ericsson, 2001),
(Ericsson, 2000) other parameters were used to
collect data from ordinary drivers in real traffic
situations, such as wheel rotation, engine speed,
ambient temperature, use of breaks and fuel
consumption. In these studies, GPS data was also
monitored, where each driving pattern was attributed
to street type, street function, street width, traffic
flow and codes for location in the city (central, semi-
central, peripheral). It was concluded that the street
type had the most influence on the driving pattern.
The analysis of the 62 primary calculated
parameters, resulted in 16 independent driving
pattern factors, each describing a certain dimension
of the driving pattern. When investigating the effect
of the independent driving pattern factors on exhaust
emissions, and on fuel consumption, it was found
that there already studies with a common number of
factors amongst the literature. As seen on table 1,
there some studies across time that share the same
factors.
Due to the decision to implement a pervasive system
over mobile sensorizaion the work here described
will account the attributes that are able to be
collected by smartphone applications.
While these attributes characterize driving in a long
term analysis, such strategy might miss spontaneous
events that occur sporadically. An example of such
is a sudden break with high intensity. In order to
deal with these one-off events, other attributes are of
relevance:
Force exerted in the car
Slope of the line connecting initial to final
velocity during breaking and accelerating
events
TrafficExpressionthroughUbiquitousandPervasiveSensorization-SmartCitiesandAssessmentofDrivingBehaviour
35

Degree of the curvature of the road and force
exacted in the car
Table 1: Attribute Study.
Attribute Study References
Fuel
Consumption
(Ericsson, 2001); (Mohan et al., 2008);
(Kuhler and Karstens, 1978)
Velocity
(Ericsson, 2001); (Mohan et al., 2008);
(Kuhler and Karstens, 1978);
(Johnson and Trivedi, 2011)
Acceleration
(Ericsson, 2001); (Mohan et al., 2008);
(Kuhler and Karstens, 1978);
(Johnson and Trivedi, 2011)
Street Type
(Ericsson, 2001); (Mohan et al., 2008);
(Kuhler and Karstens, 1978)
Trip Duration
(Ericsson, 2001); (Mohan et al., 2008);
(Kuhler and Karstens, 1978);
(Johnson and Trivedi, 2011)
Wheel
Rotation
(Ericsson, 2001); (Kuhler and
Karstens, 1978)
Motor
Monitoring
(Ericsson, 2001); (Kuhler and
Karstens, 1978)
Hour of day
(Ericsson, 2001); (Mohan et al., 2008);
(Kuhler and Karstens, 1978);
(Johnson and Trivedi, 2011)
This kind of analysis is only possible with a
dedicated user community that constantly updates
and makes use of the platform supporting these
models. With the general availability of internet of
things and the advent of portable and wearable
devices with the ability to sense and store user
locations, speed, gravitational force, sound and force
among some examples.
2.2.2 Context Awareness
Aside from driving study, another complex analysis
can be made with the help of context conditions.
Such conditions include weather, traffic congestion
and time of day, for instance. Each example can
have significant influence on the safety and on the
assessment of attributes related to driving.
Aggressiveness and dangerous behaviour has
different meanings in any of these conditions and
while some concepts are broad enough to be used by
all, others are situation specific meaning that what is
dangerous in one situation might not be in another.
Usually, driving pattern is defined and associated to
the speed profile of the driver, but it can be
expanded to other variables, as gear changing, and
big changes on the acceleration (Ericsson, 2001). In
1978, Kuhler and Karstens (Kuhler and Karstens,
1978) introduced a set of ten driving pattern
parameters. Later, in 1996, André (André, 1996)
reviewed those parameters, and reviewed some of
the most common parameters such as action
duration, speed, acceleration, idle periods and
number of stops per kilometre. Experiments with
communities are often used to provide real time
analysis of geographic conditions and events, with
examples of such in the Waze platform (Waze Ltd,
2014). However, they are the lacking features of
historic analysis and historical supported
suggestions.
The aim of this work is to focus on intangible and
soft attributes which we define as attributes that are
not directly observed by data records but rather
computed with techniques from static analysis and
machine learning processes. Such attributes should
be used to find hidden patterns of road usage that
might be missed in standard traffic flow simulations.
Examples of such errors in simulation include
driving aggravation due to unforeseen events even
with normal traffic conditions.
2.3 Sustainable Driving
Traffic assessment is directly related to trending
topics such as ubiquitous and pervasive methods that
allow the balancing of economic, environmental and
social factors needed for sustainable development. A
new emerging and interdisciplinary area, known as
Computational Sustainability, attempts to solve
problems which are essentially related to decision
and optimization problems in correlation to welfare
and well-being. Due to its importance, some
researchers have discussed and proposed
quantification methods, and modelling process for
sustainability (Todorov and Marinova, 2011),
(Kharrazi, Kraines, Hoang, and Yarime, 2014).
Often, decision and assessment are based on
measurements and information about historical
records. Indicator design provides an explanation on
why such decisions are being made and it often uses
information fusion to create and update its values.
From a technological point of view, indicator
analysis uses different and sometimes nonstandard
data which sounds feasible by technological data
gathering software that collect, store and combine
data records from different sources. In the case of
transportation systems, the assessment of the impact
of a given driving pattern is made over sustainability
indicators, like fuel consumption, greenhouse gas
emissions, dangerous behaviour or driving stress in
each driver’s profile.
PECCS2015-5thInternationalConferenceonPervasiveandEmbeddedComputingandCommunicationSystems
36
A system to estimate a driver profile using
smartphone sensors, able to detect risky driving
patterns, is proposed in (Eren, Makinist, Akin, and
Yilmaz, 2012). It was verified whether the driver
behaviour is safe or unsafe, using Bayesian
classification. It is claimed that the system will lead
to fuel efficient and better driving habits. In (Healey
and Picard, 2005), and in addition to car sensory
data, physiological data was continuously collected
and analysed (heart rate, skin conductance, and
respiration) to evaluate a driver's relative stress. The
CarMa, Car Mobile Assistant, is a smartphone-based
system that provides high-level abstractions for
sensing and tuning car parameters, where by
developers can easily write smartphone applications.
The personalized tuning can result in over 10%
gains in fuel efficiency (Flach, Mishra, Pedrosa,
Riesz, and Govindan, 2011). The MIROAD system,
Mobile-Sensor-Platform for Intelligent Recognition
Of Aggressive Driving (Johnson and Trivedi, 2011),
is a mobile system capable of detecting and
recognizing driving events and driving patterns,
intending to increase awareness and to promote
safety driving, and, thus, possibly achieving a
reduction in the social and economic costs of car
crashes.
3 EVALUATION APPROACH
In the work presented in this paper, the evaluation of
city traffic is made using a platform named PHESS
Driving. This platform inludes smartphone
aplications, server backends for adminisrators and
users and webpages for data visualization.
Management is made either by platform managers or
users of the platform in distinct, non-overlapping
areas. Platform managers are responsible for the
integrity of the data collected and the monitoring of
processes while users can manage their own records
(Fábio Silva, Analide, Gonçalves, and Sarmento,
2014).
This platform is responsible for synchronizing
driving data from user’s smartphones with a central
server that analyses the behaviour of a community of
users to deliver metrics and information about traffic
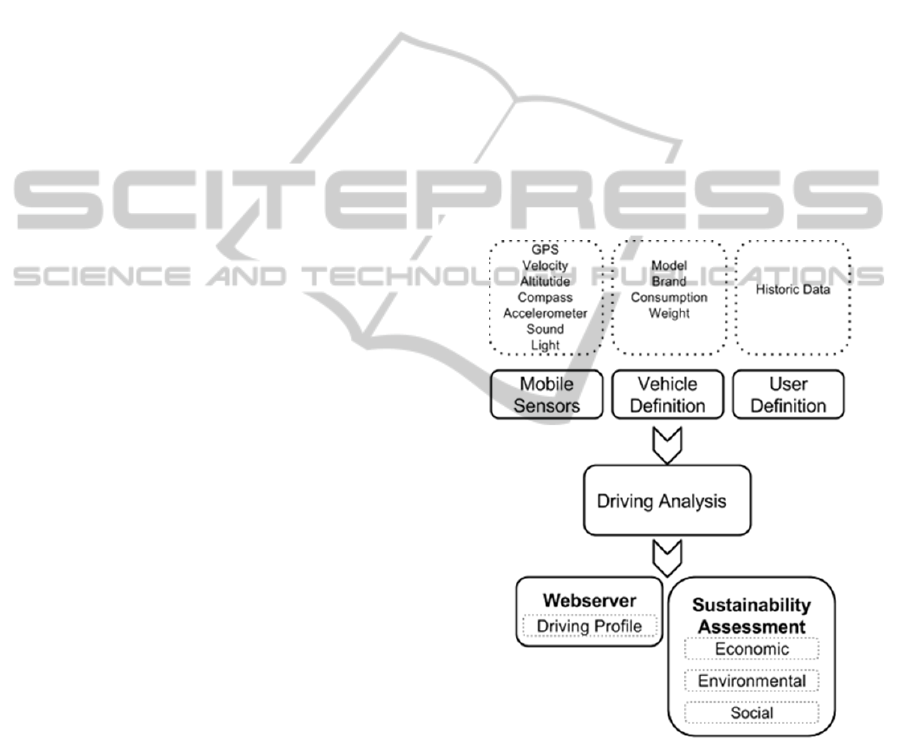
and risky driving patterns in these areas. In figure 1,
it is depicted the general flow of data used in the
system. The user smartphone acts both as sensor
collection device and as a display of information
about user metrics. Internal metrics and indicators
are supported at the server level which by
coordination and conjunction of web services
delivers processed information towards user’s
displays.
Assessment of metrics and indicators is made using
data fusion processes detailed in sections 3.1 and
3.2. Such metrics and indicators provide the value
added information of this system and have a
preventive objective to warn the user about potential
dangerous routes and avoid its use.
In order to provide a smart analysis for smart cities,
the indicators are used in squares of terrain in city
maps and the data used to classify that square is an
aggregation of the indicators that fit geographically
inside such square. For classification a three level
classification was used from initial sample data
present in the PHESS platform. In this sample data
the focus was on outlier data present in over the 80%
quartile representing the most extreme cases. Such
cases are them flagged as yellow or red depending if
they are between the 80% - 95 % or over 95%
quartile respectively.
Figure 1: Conceptual architecture of the PHESS platform.
3.1 Driver Evaluation
In order to produce information about traffic flow
and route safety it is necessary to gather information
about relevant driving patterns in city areas. The
focus of our analysis was derived from indicators
accepted from the literature review and already
present is the system PHESS Driving. Towards this
effect it was considered:
TrafficExpressionthroughUbiquitousandPervasiveSensorization-SmartCitiesandAssessmentofDrivingBehaviour
37

Intensity of acceleration and breaking;
Number of breaking and accelerating events;
Curve driving analysis;
The intensity of acceleration and breaking events is
a challenging task. Due to the usage of mobile
smartphones, sensor access is not easily controllable.
Efficiency measures make data reading uneven in
time meaning sometimes there is oversampling
where others there is under sampling. In order to
mitigate such problem the assessment is made using
the linear slope from the line connecting an initial
and final velocity as presented in equation 1. Such
slope provides a mean to assess intensity that is
independent of the size of the time interval.
(1)
The classification of the intensity of breaking is
made using a green, yellow and red scale, derived
from the initial sample as depicted in table 2.
Table 2: Indicator for slope of line between two different
velocities.
Behaviour Slope Sample Coverage
Green < 0.0017 80 %
Yellow 0.0017 – 0.0079 15 %
Red > 0,7 5 %
Number of breaking and accelerating events are
measured in time windows. Defining an event
window is helpful because only accelerations and
breaking inside such window are considered and can
be analysed and compared between time windows.
Table 3 provides information about classification for
breaking and accelerating events.
Table 3: Indicator defined for acceleration and breaking
events per 10 minutes.
Behaviour Average Sample Coverage
Green < 42 80 %
Yellow 42 - 63 15 %
Red > 63 5 %
Lastly, curve driving is a special event due to
characteristic and driving difficulty. Due to car
uneven handling, driving inside curvatures can
present a risky task specially if driven at too much
speed. For this analysis a special strategy is
employed which monitor the degree trough
smartphone sensors. Equation 2 demonstrates the
formula used to track angle difference in the
direction between two points. As the curvature
becomes more intense the road curvature is
identified as potentially more dangerous than others.
tanh
sin
∗ cos
, cos
∗sin
sin
∗ cos
∗ cos
(2)
In table 4 it is depicted the assessment made by the
extended PHESS platform to the degree of curvature
found using mobile sensorization.
Table 4: Indicator defined for assessing degree of
curvature.
Behaviour Average Sample Coverage
Green < 24º 80 %
Yellow 24º – 47º 15 %
Red > 47º 5 %
3.2 Dynamic Modelling and Historic
Information
There is information that is dependent on external
conditions of traffic and not related with driving
itself. The platform developed will try to assess
external condition using context estimation from the
data gathered. Again the strategy is made with the
help of indicators. The indicators defined are:
Road congestion;
Road high speed.
In this case, the velocity recorded by users is
aggregated inside each square of terrain. After an
initial sample of the system the average speed is
classified in a grid map identifying high speed
squares and low speed, congested, squares. For such
analysis it is considered the squares with average
speed over the 80% quartile and the inverse for the
selection of low speed squares.
Value added information produced in the system is
published using a range of public web services.
These web services provide public information
about current traffic and driving conditions as well
as, modelling analysis based on the historical data
available in the platform.
4 RESULTS AND DISCUSSION
The model described in this article was tested as a
complimentary module to the sustainability
framework PHESS (Fabio Silva, Analide, Rosa,
Felgueiras, and Pimenta, 2013). Its aims are to
produce and generate knowledge that can be used to
perform decisions and suggestions that have a direct
impact on sustainability and the sustainability of
user’s actions. More than a responsibility
PECCS2015-5thInternationalConferenceonPervasiveandEmbeddedComputingandCommunicationSystems
38
framework, it is intended to increase awareness to
sustainable problems that arise from user’s own
actions and road usage by drivers.
Taking into consideration a test city with a
community of 10 users, it is possible to assess the
sample metrics and indicators defined. The
community of users was chosen from volunteers
who recorded their driving routes during their daily
habits without restrictions to the rate of recordings,
duration of trips or locations. The nature of
recording device was by definition their own android
smartphones as long they were equipped with GPS,
accelerometers, internet connection and able to
install the application to gather driving records. Due
to the strain on the recording device and their
availability, cross-validation with approaches from
other projects over the same information was not
assessed in this study. Additionally, the
unavailability of access to tools stated by research
conducted in the community increases the difficulty
comparing results with these studies. The nature of
the results presented is also different relying on zone
assessment instead of street assessment, due to the
fact that street close to traffic jam tend to suffer the
same problems as the main street. These results
express areas according to the square granularity
defined in the system and, as result may identify
portions of a street englobing its assess routes within
the same zone. Platforms such as Waze (Waze Ltd,
2014), currently do not do such assessment instead
when indicated as congested, the full street is
assigned a congested parameter and its assess routes
are not automatically classified as well.
Nevertheless, the use of a decentralized capture
devices presented no problems recording user’s
driving records. Analysing the flow of data, the
bottleneck of the system should be the central server.
However, during this experiments no problem was
detected and measures to handle synchronization
between device and central server can be mitigated
with additional servers and load balancers.
The coverage of cities and metropolitan areas is
dependent on the community. Not only its size, but
also frequency, duration and length are determinant
to allow users to produce information that can be
used to assess cities. Its calculation is rather
difficult, but considering the most popular and
influential routes used by the vast majority of users,
then small communities can produce meaningful
results, which users can relate to. That was the case
with our own experiments.
Statistical results from the data collected according
to the principles defined in section 3 can be found in
this section. Over table 5 and table 6, it is
represented the summary of green, yellow and red
evaluation according to each non-conformant
behaviour defined in the system. In this specific case
information about indicators in section 3.1 is used
aggregating classification rounding the average
classification in each square.
Table 5: Analysis of the indicator defined for acceleration
per User per Trip.
Behaviour Average Number of
Accelerations and
Decelarations
Standard
Deviation
Green 38 3
Yellow 12 4
Red 3 8
Table 6: Analysis of Curvature and Intensity per User per
Trip.
Behaviour Average Curvature Standard Deviation
Green 10 4
Yellow 12 3
Red 15 2
These results provide evidence that our initial
sampling strategy to define green, yellow and red
accelerations and curvatures hold in a real scenario.
This means, the proportion of events classified is not
excessively different from expected. A
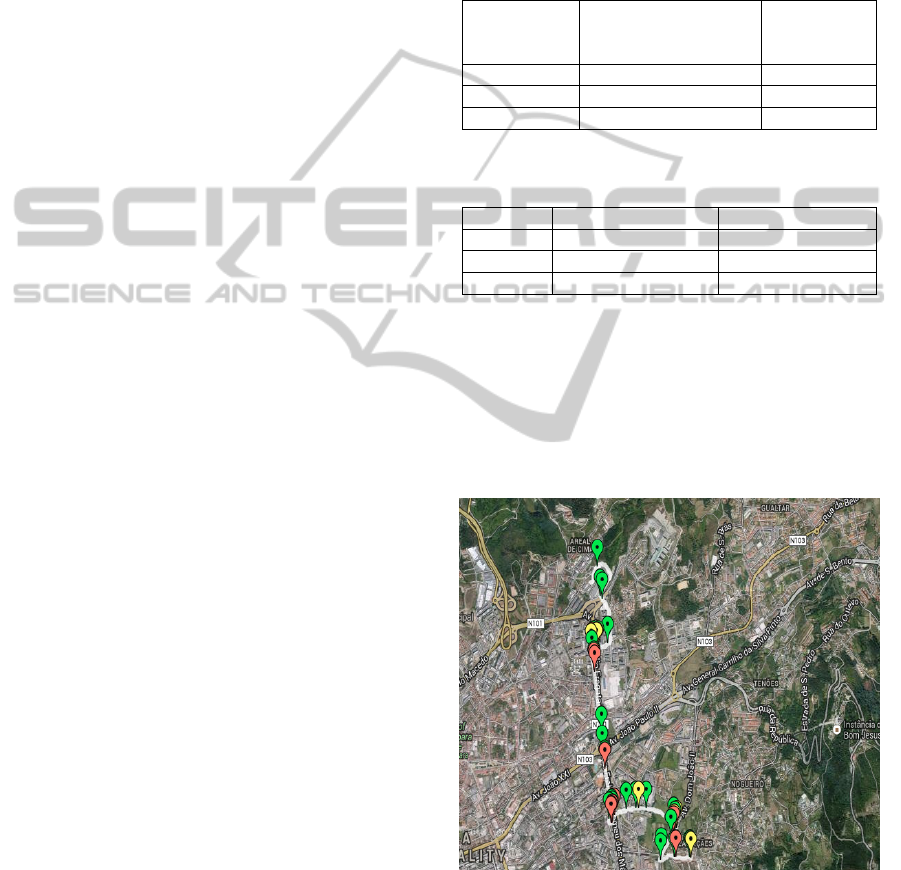
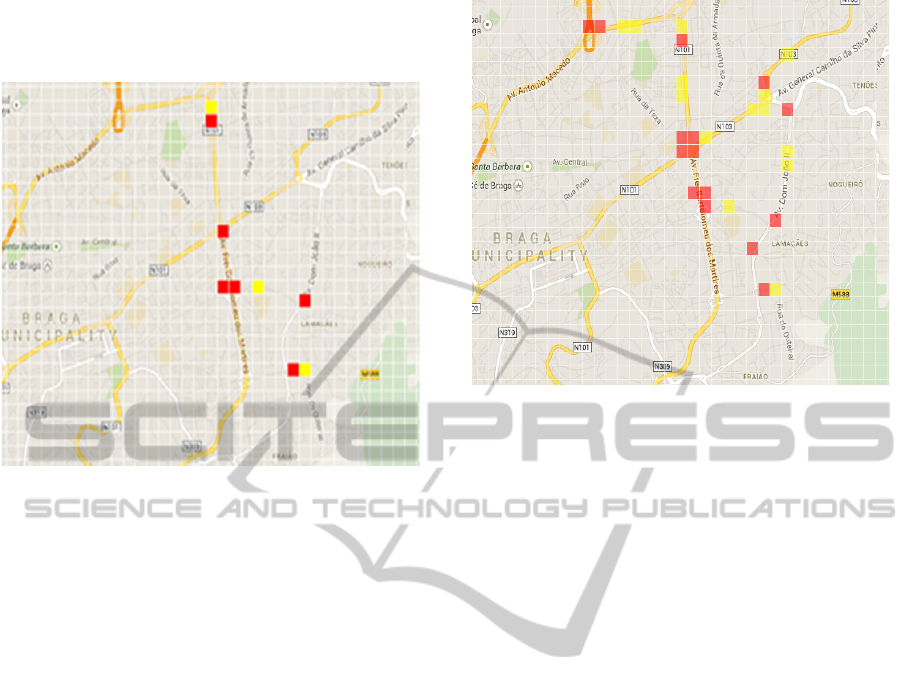
demonstrative example of the classification of
events is made in figure 2 and its impact on the grid
map on figure 3.
Figure 2: Individual Trip Event Classification.
In order to analyse the classification and demons-
trate that the scale has been appropriated to detect a
small but significant set of yellow and red events.
Such detection mechanisms can be improved with
more technical data about dangerous events or even
TrafficExpressionthroughUbiquitousandPervasiveSensorization-SmartCitiesandAssessmentofDrivingBehaviour
39
adjust the quartiles used for classification,
nevertheless the proposed approach provides
satisfactory results.
Figure 3: Individual Trip Impact on Community Map.
Each event is characterized in the map, and for the
user it is possible to see the information relevant to
that assessment. A set of filters with each indicator
defined may alter the map zone classifications
according to whether or not they are selected.
Current available filters are acceleration and
decelerations and curvature, as shown in the results
of this paper. Speed information is available but as a
heat map index as speed classification is dependent
of traffic regulations directly enforced on each
street. Due to this, the approach presented cannot
accurately classify according to speed but it can
clearly indicate faster zones than others.
On the other hand, figure 4 does not provide event
level explanation but rather aggregations of the
driving records of users that have been in such
zones. The set of filter according to each indicator is
also present but instead of providing information
about individual records, they also use the
aggregated values from the community of users in
the same location.
The identification of only yellow and red locations
over the grid helps mitigate privacy problem as it
provides the user with relevant aggregated
information but holds a significant portions of the
data, green evaluations (±80% of the total records).
Without this information it becomes more difficult
individual user identification as the information not
displayed may or may not exist in the system.
Nevertheless, the critical information that can be
used by drivers and for studies of mobility and
transport planning is presented.
Figure 4: Aggregated User Data on Community Map.
The map covered by the classification results is
within the expected range but varies according the
time of day. However, the location of squares is
preserved to allow direct comparison by time and
day if necessary. Each square can have different
averages, according to the time and classifications,
Our approach, identifies such metrics on daily basis
but the identified spots are within 10% to 15% of the
visible map.
5 CONCLUSIONS
The use of pervasive devices already adopted by
communities of users possess enough information
and computing ability to build collaborative systems
to tackle complex tasks. City traffic evaluation is
one of such problems that are costly to audit and
diagnose structural problem but can be simplified
with crowd computing. Results are seem as
satisfactory are reliable with the possibility to adjust
according to specifics needs or needed improvement.
The use of mobile sensors does constitute an
additional effort to mitigate external influences such
user involuntary movement, measurement and
coverage errors. Nevertheless, the outputs generated
in this platform were also found of relevance to the
study of sustainability, where the intangible metrics
and the structures employed to the indicator analysis
pave the way to building sustainability assessing
indicators able to join general purpose sustainability
assessment frameworks such as the platform PHESS
in discussion in this work.
In future iterations there are plan to update from grid
analysis to road detection and road analysis
PECCS2015-5thInternationalConferenceonPervasiveandEmbeddedComputingandCommunicationSystems
40

becoming more accurate. Also, the validation of
experiments on other cities are planned in order to
prove both resilience and adaptation of the system.
Integration of metrics found by this platform in
common navigation systems are planned on the long
term project, thus influencing routing options of
people and acting as a true pervasive and ubiquitous
object directing people away from dangerous
situations into more comfortable and safe
environments.
ACKNOWLEDGEMENTS
This work was developed in the context of the
project CAMCoF - Context-aware Multimodal
Communication Framework funded by ERDF -
European Regional Development Fund through the
COMPETE Programme (operational programme for
competitiveness) and by National Funds through the
FCT - Fundação para a Ciência e a Tecnologia
(Portuguese Foundation for Science and
Technology) within project FCOMP-01-0124-
FEDER-028980 and PEst-OE/EEI/UI0752/2014.
Additionally, it is also supported by a doctoral grant,
with the reference SFRH/BD/78713/2011, issued by
FCT and included in the financial program
POPH/FSE in Portugal.
REFERENCES
André, M. (1996). Driving Cycles Development:
Characterization of the Methods. doi:10.4271/961112.
Bosse, T., Hoogendoorn, M., Klein, M. A. C. A., and
Treur, J. (2008). A Component-Based Ambient Agent
Model for Assessment of Driving Behaviour. In F.
Sandnes, Y. Zhang, C. Rong, L. Yang, and J. Ma
(Eds.), Ubiquitous Intelligence and Computing (Vol.
5061, pp. 229–243). Springer Berlin Heidelberg.
doi:10.1007/978-3-540-69293-5_19.
Eren, H., Makinist, S., Akin, E., and Yilmaz, A. (2012).
Estimating driving behavior by a smartphone. In 2012
IEEE Intelligent Vehicles Symposium (pp. 234–239).
IEEE. doi:10.1109/IVS.2012.6232298.
Ericsson, E. (2000). Variability in exhaust emission and
fuel consumption in urban driving. URBAN
TRANSPORT SYSTEMS. PROCEEDINGS …, (1980),
1–16. Retrieved from http://trid.trb.org/view.aspx?
id=715489.
Ericsson, E. (2001). Independent driving pattern factors
and their influence on fuel-use and exhaust emission
factors. Transportation Research Part D: Transport
and Environment, 6(5), 325–345. doi:http://dx.doi.org/
10.1016/S1361-9209(01)00003-7.
Flach, T., Mishra, N., Pedrosa, L., Riesz, C., and
Govindan, R. (2011). CarMA. In Proceedings of the
9th ACM Conference on Embedded Networked Sensor
Systems - SenSys ’11 (p. 135). New York, New York,
USA: ACM Press. doi:10.1145/2070942.2070957.
Healey, J. A., and Picard, R. W. (2005). Detecting Stress
During Real-World Driving Tasks Using
Physiological Sensors. IEEE Transactions on
Intelligent Transportation Systems, 6(2), 156–166.
doi:10.1109/TITS.2005.848368.
Johnson, D. A., and Trivedi, M. M. (2011). Driving style
recognition using a smartphone as a sensor platform.
In 2011 14th International IEEE Conference on
Intelligent Transportation Systems (ITSC) (pp. 1609–
1615). IEEE. doi:10.1109/ITSC.2011.6083078.
Kharrazi, A., Kraines, S., Hoang, L., and Yarime, M.
(2014). Advancing quantification methods of
sustainability: A critical examination emergy, exergy,
ecological footprint, and ecological information-based
approaches. Ecological Indicators, 37, Part A(0), 81–
89.
doi:http://dx.doi.org/10.1016/j.ecolind.2013.10.003.
Kuhler, M., and Karstens, D. (1978). Improved Driving
Cycle for Testing Automotive Exhaust Emissions.
doi:10.4271/780650.
Laureshyn, A., Svensson, A., and Hydén, C. (2010).
Evaluation of traffic safety, based on micro-level
behavioural data: theoretical framework and first
implementation. Accident; Analysis and Prevention,
42(6), 1637–46. doi:10.1016/j.aap.2010.03.021.
Li, K., Lu, M., Lu, F., Lv, Q., Shang, L., and Maksimovic,
D. (2012). Personalized Driving Behavior Monitoring
and Analysis for Emerging Hybrid Vehicles. In
Proceedings of the 10th International Conference on
Pervasive Computing (pp. 1–19). Berlin, Heidelberg:
Springer-Verlag. doi:10.1007/978-3-642-31205-2_1.
Martinez-Balleste, A., Perez-martinez, P., and Solanas, A.
(2013). The pursuit of citizens’ privacy: a privacy-
aware smart city is possible. IEEE Communications
Magazine
, 51(6), 136–141. doi:10.1109/MCOM.2013.
6525606.
Minderhoud, M. M., and Bovy, P. H. (2001). Extended
time-to-collision measures for road traffic safety
assessment. Accident; Analysis and Prevention, 33(1),
89–97. Retrieved from http://www.ncbi.nlm.nih.gov/
pubmed/11189125.
Mohan, P., Padmanabhan, V. N., and Ramjee, R. (2008).
Nericell. In Proceedings of the 6th ACM conference
on Embedded network sensor systems - SenSys ’08 (p.
323). New York, New York, USA: ACM Press.
doi:10.1145/1460412.1460444.
Paefgen, J., Kehr, F., Zhai, Y., and Michahelles, F. (2012).
Driving Behavior Analysis with Smartphones: Insights
from a Controlled Field Study. In Proceedings of the
11th International Conference on Mobile and
Ubiquitous Multimedia (pp. 36:1–36:8). New York,
NY, USA: ACM. doi:10.1145/2406367.2406412.
Rakotonirainy, A., and Tay, R. (2004). In-vehicle ambient
intelligent transport systems (I-VAITS): towards an
integrated research. In Proceedings. The 7th
TrafficExpressionthroughUbiquitousandPervasiveSensorization-SmartCitiesandAssessmentofDrivingBehaviour
41

International IEEE Conference on Intelligent
Transportation Systems (IEEE Cat. No.04TH8749)
(pp. 648–651). IEEE. doi:10.1109/ITSC.2004.
1398977.
Sadri, F. (2011). Ambient intelligence. ACM Computing
Surveys, 43(4), 1–66. doi:10.1145/1978802.1978815.
Silva, F., Analide, C., Gonçalves, C., and Sarmento, J.
(2014). Ubiquitous Sensorization for Multimodal
Assessment of Driving Patterns. In C. Ramos, P.
Novais, C. E. Nihan, and J. M. Corchado Rodríguez
(Eds.), Ambient Intelligence - Software and
Applications (Vol. 291, pp. 143–150). Cham: Springer
International Publishing. doi:10.1007/978-3-319-
07596-9.
Silva, F., Analide, C., Rosa, L., Felgueiras, G., and
Pimenta, C. (2013). Gamification, Social Networks
and Sustainable Environments. International Journal
of Interactive Multimedia and Artificial Intelligence,
2(4), 52. doi:10.9781/ijimai.2013.246.
Solanas, A., Patsakis, C., Conti, M., Vlachos, I., Ramos,
V., Falcone, F., … Martinez-Balleste, A. (2014).
Smart health: A context-aware health paradigm within
smart cities. IEEE Communications Magazine, 52(8),
74–81. doi:10.1109/MCOM.2014.6871673.
Sun, J., Wu, Z., and Pan, G. (2009). Context-aware smart
car: from model to prototype. Journal of Zhejiang
University SCIENCE A, 10(7), 1049–1059. doi:10.
1631/jzus.A0820154.
Todorov, V., and Marinova, D. (2011). Modelling
sustainability. Mathematics and Computers in
Simulation, 81(7), 1397–1408. doi:10.1016/j.matcom.
2010.05.022.
Waze Ltd. (2014). Waze. Retrieved September 23, 2014,
from https://www.waze.com/
PECCS2015-5thInternationalConferenceonPervasiveandEmbeddedComputingandCommunicationSystems
42
